Nasdaq Intraday Review – Tuesday 9 Jan 2024I trade Nasdaq intraday exclusively
Trading in GMT time zone
Sharing my post day review & analysis in case it can help you :)
Did my analysis around 5:20am GMT.
At time of analysis, the following was noted:
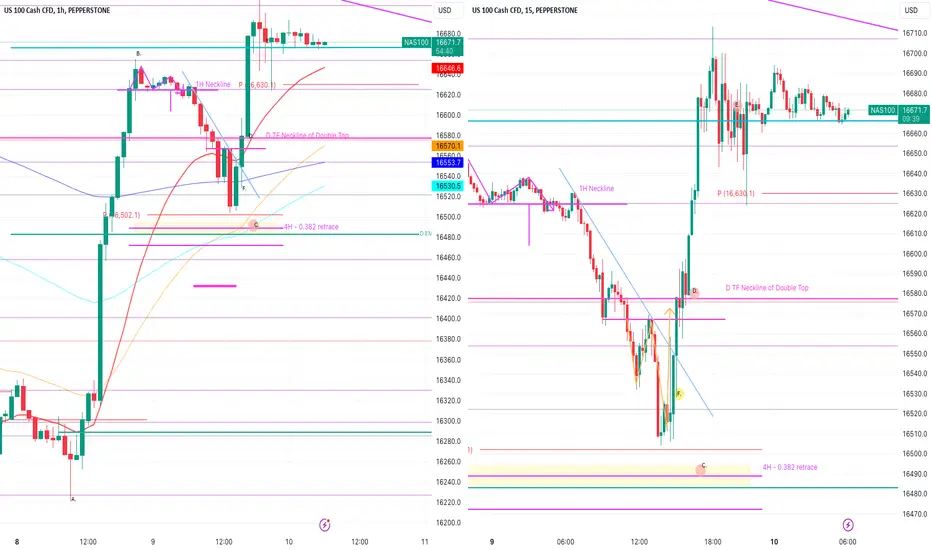
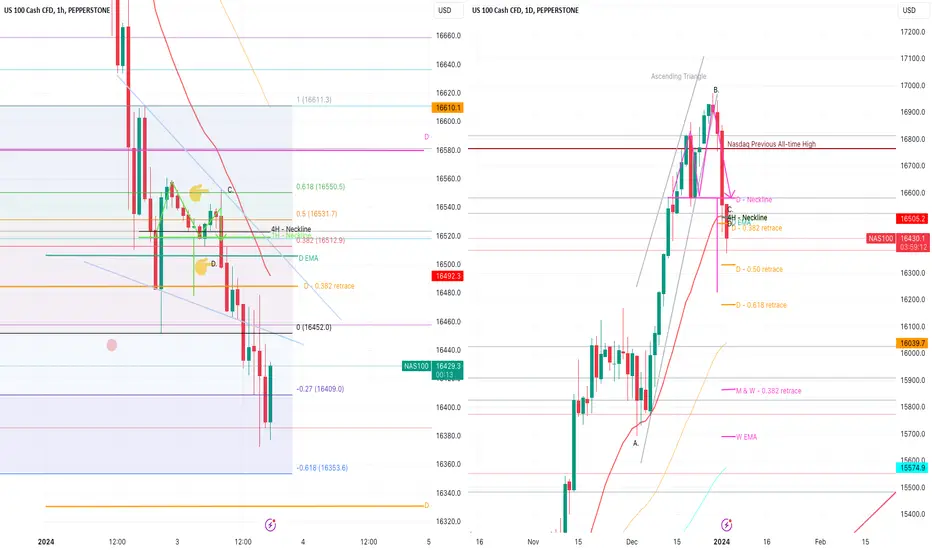
A double top was forming on the 1H TF (marked with purple lines).
I knew that market would come down to test the neckline (marked in pink) of the D Double top that it broke through yesterday.
Drawing retracement levels in the charts in purple (swing low at A. and swing high at B.)
Noted that both the D 20 EMA and the 4H 20 EMA were close to the 4H – 0.382 retracement level. This created a strong area of confluence in my opinion (so I highlighted this area in yellow).
I set a buy limit at C. for half on my usual position size.
Mental stop was placed by the thick pink line, as this was also just below the 0.50 fib level so I would give my trade some breathing room in case market decided to test the 0.50 fib level.
Ultimately, market never reached my buy limit.
For me, today was a really important day for Nasdaq. If the bulls were not able to break the neckline of the D Double top that had formed previously, then we would see a further down swing of the market and a larger bearish pushdown.
With the candles, pivot point + EMAs + 0.382 retracement level below the neckline of the D double top (i.e. market had ALREADY broken below the D neckline), I felt unsure of a buy because the market was already in a risky area (below the neckline).
I entered a buy at D – Confirmations:
- Market Patterns: formation of double bottom on 1H TF. Entered when market had broken the neckline of the double bottom as well as the D neckline (marked in pink)
- Trend Line: D also represented the level where market had broken the temporary down trend line (marked in blue) and closed a higher high after a period of lower highs – signaling the end of the downtrend.
- Candlesticks: Strong green candle close on the 1H, breaking D Neckline
- Fib: Market had been down in the region of the 0.382 4H Fib retracement level and was now moving higher
Mental stop was the same.
Bulls continued the push up and eventually I closed my position in stages at E. as candles began consolidating at the level.
So that 933 pips profit for me today!
What could I have done differently:
I could have been more aggressive and entered at about F.
I already had a buy limit at C. so I was already willing to risk the buy from below the neckline at C. So when the double bottom started forming on the 15 min TF just above the level of my buy limit, I should have jumped in with my buy. But having to enter manually, I felt myself hesitating and being fearful that bears would step in at the neckline. Lesson to be learnt, if you have an ideal entry point where you set a buy / sell limit and then market forms a reversal pattern very close to your desired entry then jump in at that point and delete your pending order. If I had done that I would have had 511 extra pips in my pocket!
Hope you caught this nice buy!
TF = timeframe
TP = take profit
1H = 1 hour
4H = 4 hour
D = day
W = week
M = month
S&R = support and resistance
EMA = exponential moving average
US NAS 100
NASDAQ - 4HR With Monday's price action giving us a retracement into a discount. We can look for shorts 15500-15600 area. Wait for candle confirmation. We can see price push into the 4hr OB 15800-900 level.

NAS100 - LONG SPECULATIONHi Traders,
We've got ourselves a monster position on the NAS100, right now I'm speculating a several month position to ride out.
However we could see even further lows if we do break through these prices.
Marked on the chart are a few important price points I'd like you to understand.
We will also consider the latest fundamental data, such as CPI, Unemployment claims, interest rate data and stock flow.
Why should we include this data?
It helps us as traders to make clear, strategic based speculations, strong guesses so to speak on the direction of movement. Using this data is crucial for any trader who is serious.
We can see the chart is also on the weekly time frame. I will continue to add to this idea while price is being monitored.
I'll look to add more ideas further down that relate directly to this setup, until proven wrong by Wall St...

Nasdaq Intraday Review – Monday 8 Jan 2024I trade Nasdaq intraday exclusively
Trading in GMT time zone
Sharing my post day review & analysis in case it can help you :)
Today was a different day for me. I planned the trade I took today over the weekend.
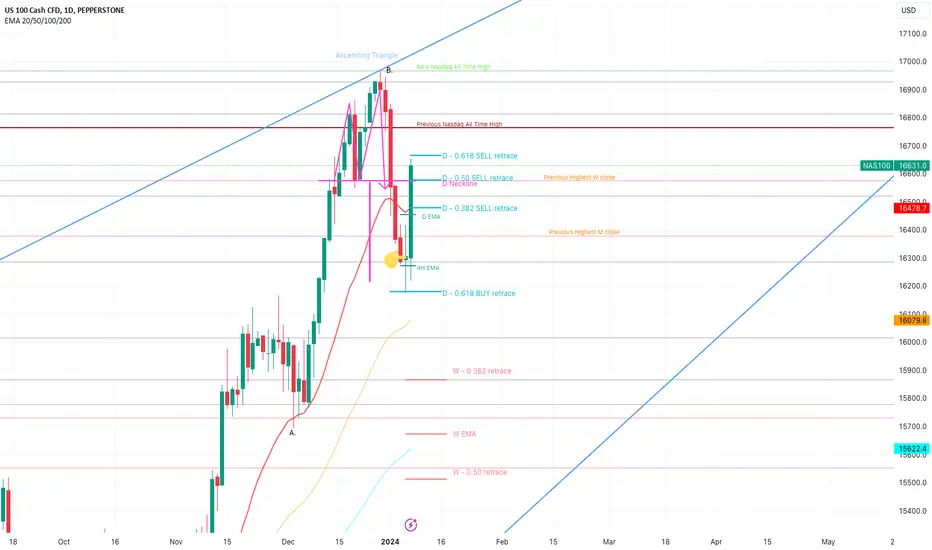
Friday 5th Jan trading day ended with a green doji candle close on the D TF.
This D candle touched the 0.618 Fib level on the D TF and closed above the 4H 200 EMA.
To me this signalled the start of a bullish move, at the very least to re-test the neckline of the Double Top on the D TF (marked in pink).
I decided I wanted to enter a swing trade and so I stayed up late on Sunday evening and opened a nice big buy position in the seconds as market opened on Sunday 11pm GMT.
My swing trade buy confirmations:
- Market Pattern – double top had formed on the D TF and price had traveled the full distance of the profit target (i.e. the same distance down as the height of the market pattern). I like to enter a trade that will re-test the neckline in the same direction as the overall trend (bullish in this case if we assume that the bear move was just a retracement and not a full trend reversal. I will consider a full trend reversal to be in place if market tests the neckline of the double top and then moves down again).
- Fib – a strong fib level was reached on a high TF (0.618 on a D TF)
- Candle stick – green doji on a D TF
- S&R – 4H 200 EMA providing dynamic support to 2 x D candles
I funded my trading account with the amount of money I was prepared to lose and I would not place a stop loss. I correctly choose my position size to handle a drawdown of 1500 – 2000 pips and if my account bust then that would be the end of my swing trade.
All went according to plan, and I am currently on 3166 pips profit for the day.
I did close a small portion of my position to recover my small losses over the previous days and also take some profit for my efforts today. But the majority of the trade is running.
I secured my trade at entry and am now trading risk free.
The plan is to wait to see if bulls break through the neckline (so far so good, but I am expecting a bearish push down tomorrow to test bulls strength). Luckily pivot point + 1H, 4H and D 20 EMA’s will be under the candles hopefully giving a push up.
What could I have done differently:
I am happy with my performance today.
Hope you caught this nice buy!
TF = timeframe
TP = take profit
1H = 1 hour
4H = 4 hour
D = day
W = week
M = month
S&R = support and resistance
EMA = exponential moving average
Nasdaq Visiting Liquidity levelsNasdaq already took into account t that the FED will decrease the interest rates by 160 points, & the market is pricing it as if it’s true.
In reality it is not true and J. Powell didn’t take any decisions yet. Supposedly J. Powell sees that his ambitions are. It yet met, he might decrease the rate by 75 points only and the market might easily decline by 8% as a reaction to that.
Keeping all realistic scenarios in mind is a must, and speculated assumptions without any facts or decisions must remain a hypothesis. Watch the market as it digests reality next week.
(This is not a financial advice nor guidance. It’s my humble opinion in the markets within 12 years in the market)

Idea for NASDAQ @ 4th Jan.Currently I supposed that the wave B is completed, and we have an opportunity to place a short position to catch Wave C in the High TF correction wave.

NASDAQ is going to pull back to the bottom of the broken channelWhen NASDAQ index reached the midline of the main historical channel, the hammer landed on its head. Then the bottom of the ascending channel was lost and now it is pulling back to the bottom of the broken channel with the confirmation of the indicator for a pullback.
The predicted route is specified.

NASDAQHi guys
The Nasdaq entered correction after a bearish wave
And I hope it reacts to the green resistance levels and continues its downtrend
The indicated resistance zone overlaps with Fibonacci-45

NAS100 Trapped Buyers?We can see price has broken the high and pushed back down. If this is a liquidity trap trapping buyers could be a potential. As seen above I have 2 zones of interest, if the higher zone is broken I can see the price easily pushing down to the 14500 area.
We will need to check this on lower timeframes over the upcoming week and see if we have a true shift in structure across all timeframes which will once again give us more of a reason to believe it was a buyers trap.

US100 NASDAQ Technical Analysis and Trade Idea NAS100Sharp Retracement in NAS100: Opportunity on the Horizon?
Eyes are laser-focused on the NAS100 after it slammed into a key resistance level. The current aggressive pullback sets the stage for an intriguing dynamic ahead of the NFP data drop later today. A strong dollar boost (or unexpected weakness) could significantly impact the index, making this data release a potential swing point.
With such a sharp retracement already underway, I'm eyeing a potential long entry as the price plunges towards a crucial support zone. In the video, we dissected the trend, price action, market structure, and other technical essentials to build a comprehensive picture.
Remember: This analysis is purely for educational purposes and should not be interpreted as financial advice. Do your own due diligence before making any trading decisions.

Nasdaq Intraday Review – Friday 5 Jan 2024I trade Nasdaq intraday exclusively
Trading in GMT time zone
Sharing my post day review & analysis in case it can help you :)
Did my analysis at +- 5:20am GMT
Usually, I am looking exclusively for a buy because Nasdaq was bullish overall and trading with the trend is always a good idea.
I believe this bearish pushdown is a big buy retracement on the D TF and not a trend reversal.
During my analysis, I noted the following:
Today was NFP. I usually don’t like trading during the day of a big news event. Often times markets are muted during the day with the true volatility coming with the news event.
I entered a buy one minute before NFP came out – Confirmations:
Market Pattern – Price had already travelled down the full distance equal to the height of the D double top. In theory, it is at this point that often market will reverse to test the neckline of the pattern.
Fib: Price was just above the 0.618 fib level of the D TF (a very high and strong TF)
S&R: 4H 200 EMA
My NFP buy was at A.
As NFP hit I was expecting a big reaction. However, market seemed quite unreactive.
For 10min price was sliding down.
I was very surprised and thought to myself that if NFP can’t turn this bearish retracement around, then price will fall a long way still.
I have been taking small losses in the past few days, attempting to catch the correct reversal point. But these have been quite small losses and overall, I am not too sad about them because my risk management was pretty good.
But in this moment, during the 10min after NFP, fear took over and I was not able to think straight.
I didn’t want to take further unnecessary losses and I was fearful that market would slip down because even NFP couldn’t introduce bulls into the game.
So, I closed at B. (right on the 0.618 D fib level).
As I was writing this trade in my trade journal and I was documenting the reasons for entering the trade, I thought to myself that these are such strong confirmations and that I didn’t give my trade enough breathing room. I realized then I had been too quick to react (out of fear) and should have waited to see how the candles would react to the 0.618 fib level.
So basically, keeping my trade journal highlighted to me that I had acted in fear and not rationally. I took a minute to think clearly what I wanted to do and knew I was prepared to put some money on the table for those strong confirmations, so I entered a buy at C.
Overall, bulls pushed up from B. by 2400 pips – this could be the start of the bullish trend again, especially as we saw the day close with a green doji candle on the D TF.
When I saw the weakness on the 15min TF after price had touched the 4H EMA, I closed half my position at D. I secured my remaining half position at entry and was hoping for market to continue pushing up to at least test the neckline of the double top on the D TF. But alas, we did not get there on Friday and candles spiked down to take me out at entry.
But felt really good to make some pips (950 pips) for the day!
Dealing effectively with emotions is one of the hardest parts of trading. Today, fear came into the game for me, but happy that my good habit of trade journaling helped me recognize this and that I still came out with some pips!
What could I have done differently:
Controlled my emotions better.
Hope you had a good trading day!
Catch ya on Monday!
TF = timeframe
TP = take profit
1H = 1 hour
4H = 4 hour
D = day
W = week
M = month
S&R = support and resistance
EMA = exponential moving average
NASDAQ DAY 2Hi guys
The second day of the Nasdaq trend
I hope it will react to the levels and activate the order

Nasdaq Intraday Review – Thursday 4 Jan 2024I trade Nasdaq intraday exclusively
Trading in GMT time zone
Sharing my post day review & analysis in case it can help you :)
Did my analysis at +- 5:20am GMT
Usually, I am looking exclusively for a buy because Nasdaq was bullish overall and trading with the trend is always a good idea.
Bears have totally dominated, with a push down of +- 7000 pips. I believe this is a big buy retracement on the D TF and am waiting for the reversal.
During my analysis, I noted the following:
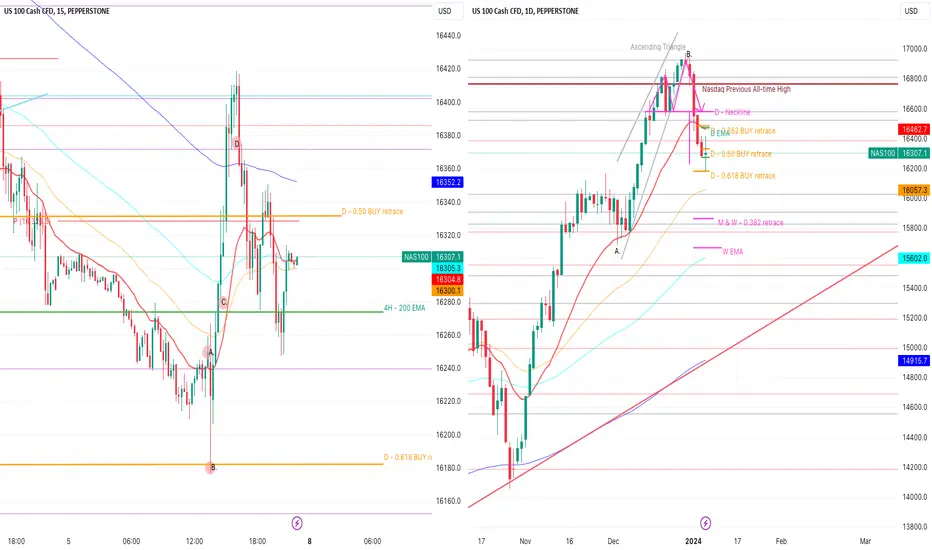
A double bottom formed on the 1H TF (marked in purple lines).
Market pushed up to break the neckline of the double bottom & temporary down trend line (marked in light blue).
I entered a buy at A. – Confirmations:
- Market Pattern: This was the 1st time that a double bottom formed on the 1H TF since the bearish retracement, indicating the growing strength of the buyers. Entered at break of the neckline
- Fib: There was no buy fib level but there was some distance to travel to the 0.382 sell retracement (drawn at time I entered the buy and not as indicated on the chart now because swing low changed) so I felt there was enough distance for market to travel and secure my position at entry.
- Candle sticks: Strong 1H momentum candle + first time we saw 2 green candles in a row close on the 4H TF, again indicating the growing strength of bulls.
- S&R: Strong weekly and monthly support and resistance zone
It was a risky entry because the pivot + 1H EMA were just above pushing down, so I entered 50% of my usual position size.
Mental stop was place at thick pink line.
1H EMA proved too strong, and bulls were unable to break through. Took a 370 pip loss on this entry.
Not sad about it because I feel it was a valid entry and worth putting some money on the table for.
Bears push down further. Towards market open price was approaching the 4H 200 EMA (a very strong dynamic support zone) + the profit target of the D TF double top (marked by C. in bottom left corner – i.e., market will generally move the same distance as the height of the market pattern).
When a double bottom formed on the 15min TF in this zone, I was very interested to enter a buy.
However, just yesterday I said in my post “It’s ridiculous of me to think that its enough confirmation to enter a buy on a 15min TF (a very small TF). A 6000 pip bearish move will not come to a screaming halt on a 15min double bottom.”
The difference now was that this pattern was forming in an area of confluence as opposed to just a random 15min double bottom anywhere in the charts.
I chose to wait for the re-test of the neckline and entered a buy at B. as market was moving up again – Confirmations:
- Market pattern: retest of broken neckline of a double bottom of the 15min chart
- Fib: in the 0.50 fib zone on a D TF
- Candlestick: inverted green hammer candlestick on the 1H (a potential bullish reversal signal)
- S&R: in the zone of the 4H 200 EMA (a very strong EMA)
- Trendline: none
Mental stop was placed at thick pink line.
I also placed a buy limit at the thick pink line as I really believed a bullish bounced would occur from this zone.
Finally hit a nice buy with market moving up 1000 pips from my entry.
Wanting to see a strong move up, I secured my position at entry and am trading risk free.
What could I have done differently:
I should have taken profit (closed a portion of my position at D.)
D. represents the 5th time market tried to break this zone and on seeing weakness on the 15min TF, I should have secured some profit.
Good luck if you are still trading!
TF = timeframe
TP = take profit
1H = 1 hour
4H = 4 hour
D = day
W = week
M = month
S&R = support and resistance
EMA = exponential moving average
US100 16396.9 +0.18 % MULTI TIME-FRAMES 🐮🐻Good Day Traders
Here's a bit of a dive into the NASDAQ Multi time-frames out look.
WEEKLY
* Saw a sweep of some external range liquidity.
* Strong Momentum Shift & a CHANGE IN STATE OF DELIVERY
DAILY
www.tradingview.com
* The overall still bullish NASDAQ MIGHT just see some retracement into discount areas before continuation.
* NASDAQ has a shift in the momentum towards bearish side in the form of Market structure shift on the daily time-frame.
* looking for a possible bullish Day into Internal range Liquidity before continuation with the bears.
* Retracement into internal liquidity would be great for possible shorts in coming weeks
4H
www.tradingview.com
* A bullish day highly favored today
* looking for mitigations of bearish PD ARRAYS / INTERNAL LQ ABOVE BEFORE continuation.
* Momentum post-ASIAN SESSION indicative as well
1H
www.tradingview.com
* Ext liquidity was taken WED NY-SESSION
* just respected bullish FVG ON the hr.
* A shift above the fractal High will indicate that we might close the week bullish
lets see how it goes.
IF THIS IDEA ASSISTS IN ANY OR IF YOU LIKE THIS ONE
SMASH THAT LIKE BUTTON & LEAVE A COMMENT.
ALWAYS APPRECIATED
____________________________________________________________________________________________________________________
9 AM ZAR TIME
ICT SILVER BULLET EXECUTION
Here is today's SILVER BULLET set-up which presented multiple entries.
1. Swept Asian highs and internal range liquidity
2. Aggressive momentum into the range.
3. 1st entry was an inversion FVG + BALANCE PRICE RANGE
4. 2ND entry classic ICT 2022 ENTRY MODEL
5. 3RD ENTRY REJECTION AT THE FVG
Target > 1hr +FVG
www.tradingview.com
* Kindly follow your entry rules on entries & stops. |* Some of The idea's may be predictive yet are not financial advice or signals. | *Trading plans can change at anytime reactive to the market. | * Many stars must align with the plan before executing the trade, kindly follow your rules & RISK MANAGEMENT.
_____________________________________________________________________________________________________________________
| * ENTRY & SL -KINDLY FOLLOW YOUR RULES | * RISK-MANAGEMENT | *PERIOD - I TAKE MY TRADES ON A INTRA DAY SESSIONS BASIS THIS IS NOT FINACIAL ADVICE TO EXCECUTE ❤
LOVELY TRADING WEEK TO YOU!

NASDAQNASDAQ TREND AND FIBO
S AND R LEVEL
The Nasdaq Composite is a stock market index that includes almost all stocks listed on the Nasdaq stock exchange. Along with the Dow Jones Industrial Average and S&P 500, it is one of the three most-followed stock market indices in the United States

Support zone: 16319.8-16579.4Hello traders!
If you "Follow" us, you can always get new information quickly.
Please also click “Boost”.
Have a good day.
-------------------------------------
(DXY chart)
DXY gapped above 102.089.
A rise in DXY may indicate stagnation or decline in the investment market, or a transition to a recession.
Accordingly, it is expected that the investment market will rise and become active only when it falls and remains below the 102.089-106.416 range.
If it rises above 105.873-106.416, caution is needed as there is a possibility that the investment market may turn into a recession.
---------------------------------------
(NAS100USD chart)
(1M charts)
In order to turn into a downtrend from a long-term perspective, it must fall below 15090.3.
(1W chart)
The HA-High indicator appears to be forming at the 16123.5 point.
Accordingly, the key is whether it can be maintained above 15978.3-16123.5.
(1D chart)
As it fell below the MS-Signal indicator, it turned into a short-term downtrend.
Accordingly, the key is whether it can receive support and rise in the 16319.8-16579.4 range.
If not, it is expected to touch the M-Signal indicator on the 1W chart or around 15978.3.
If the decline continues, the HA-Low indicator will rise.
At that time, it is important to be supported by the HA-Low indicator and whether it can rise.
If not, there is a possibility of a cascading decline that continues to renew lows.
Have a good time.
thank you
--------------------------------------------------
- The big picture
The full-fledged upward trend is expected to begin when the price rises above 29K.
This is the section expected to be touched in the next bull market, 81K-95K.
#BTCUSD 12M
1st: 44234.54
2nd: 61383.23
3rd: 89126.41
101875.70-106275.10 (when overshooting)
4th: 13401.28
151166.97-157451.83 (when overshooting)
5th: 178910.15
These are points that are likely to encounter resistance in the future.
We need to see if we can break through these points upward.
Since it is thought that a new trend can be created in the overshooting area, you should check the movement when this area is touched.
If the general upward trend continues until 2025, it is expected to rise to around 57014.33 and then create a pull back pattern.
1st: 43833.05
2nd: 32992.55
-------------------------------------------------- -------------------------------------------
** All explanations are for reference only and do not guarantee profit or loss in investment.
** Trading volume is displayed as a candle body based on 10EMA.
How to display (in order from darkest to darkest)
More than 3 times the trading volume of 10EMA > 2.5 times > 2.0 times > 1.25 times > Trading volume below 10EMA
** Even if you know other people’s know-how, it takes a considerable amount of time to make it your own.
** This chart was created using my know-how.
---------------------------------

Nasdaq Intraday Review – Wednesday 3 Jan 2024I trade Nasdaq intraday exclusively
Trading in GMT time zone
Sharing my post day review & analysis in case it can help you :)
Did my analysis at +- 5:20am GMT
Usually, I am looking exclusively for a buy because Nasdaq was bullish overall and trading with the trend is always a good idea.
But bears have totally dominated, with a push down of nearly 6000 pips.
This could be a total trend reversal i.e. we move into a bear market. Or it could be a big retracement on the D TF (from swing low at A. to swing high at B.)
Retracement levels marked with orange text.
I believe it will ultimately be a retracement.
A huge double top formed previously on the D TF (marked in pink). Market usually moves the same distance as the height of the pattern after the neckline is broken (marked by the pink vertical line). Yesterday we saw the D candle close below the neckline effectively breaking the neckline.
So far today, the D EMA and D 0.382 retracement level has not been enough to stop the bears, and judging by the pink vertical line, market could still fall some way.
I entered a small buy (10% of my usual position size) on a double bottom that formed on the 15min TM but closed soon after.
What could I have done differently:
It’s ridiculous of me to think that it's enough confirmation to enter a buy on a 15min TF (a very small TF).
A 6000 pip bearish move will not come to a screaming halt on a 15min double bottom. There will be a double bottom or other market pattern formed on a much larger TF.
Other than that, I just observed the market today. We are in a retracement zone….so not changing my bias to bearish until I can rule out a bull retracement.
Learnt a lot from these past few days. My biggest lesson was the power and strength of double tops forming on multiple timeframes at the same time - as we saw today again (double top on 1H and 4H).
If I had to enter a sell today, it would have been at C. (for an aggressive entry (0.618 sell fib level + respecting the 30 min EMA)) or at D. (break of the neckline of the double top).
Good luck if you are still trading!
TF = timeframe
TP = take profit
1H = 1 hour
4H = 4 hour
D = day
W = week
M = month
S&R = support and resistance
EMA = exponential moving average
Nasdaq Intraday Review – Tuesday 2 Jan 2024I trade Nasdaq intraday exclusively
Trading in GMT time zone
Sharing my post day review & analysis in case it can help you :)
Did my analysis at +- 5:20am GMT
Usually, I am looking exclusively for a buy because Nasdaq was bullish overall and trading with the trend is always a good idea.
But I was considering just observing the market today as there is a fully formed Double top on a high TF (4H) + two red D candle closes + Nasdaq all-time highs.
Bears have just been waiting for the sell at all-time highs, but bulls have proven to be very strong over the last two months.
As the morning progressed, two double tops were forming on the 1H and 30min TF.
However, when a double bottom formed, I entered a small buy at A. – Confirmations:
- Market Pattern: Double bottom on the 1H TF. I entered my buy on the break of the neckline on the 30min TF
- Trend line: Break of the temporary down trend line (marked in blue)
- Fib: Double bottom formed at D 0.382 retracement level
- Candle sticks: Long wick candles on the 4H TF
Entered a position which is 20% of my usual position size, as I knew this was a risky entry (all EMA's + pivot point above my buy pushing down).
Set a tight mental stop loss, marked by the thick pink line. If candles started closing below this point then neckline of the 1H double bottom was broken and market would sell.
Bears pushed down and I took a 250 pips loss.
Entered a buy at B. – Confirmations:
S&R: Strong D level support and resistance
S&R: D 20 EMA was at this level
Fib: Bigger picture 0.382 D fib level
I knew there should at least be a bounce at this level and I entered a small buy.
I secured at entry after the market was +-250 pips up from my position, so I was trading risk free. Ultimately, market moved 850pips up from my position.
I was expecting a bigger move up to at least the 30min EMA but market turned around quite unexpectedly (for me at least) and I was out at entry. This is also the time of day that I am not in front of my trading screens and I was monitoring periodically on my phone.
What could I have done differently:
I could have jumped on the sell train, but generally I don’t like to flip flop between biases. I have lost a lot of money in doing that and trading with the overall trend has become part of my trading rules. This massive bearish move may be a bigger TF retracement or it may be a trend reversal.
Let’s see what the market has in store for us today.
Hope you caught the sell!
TF = timeframe
TP = take profit
1H = 1 hour
4H = 4 hour
D = day
W = week
M = month
S&R = support and resistance
EMA = exponential moving average

✨ NAS100USD: ITF CURVE ANALYSIS (10H) ✨(DOWNTREND)
SLO2 @ 16850
SLO1 @ 16555
TP1 @ 16000
TP2 @ 15530
TP3 @ 15185
TP4 @ 14650
BLO1 @ 14520 ⏳
BLO2 @ 14210 ⏳
ADDITIONAL INFO:
📉 Based on the Curve Analysis of the 10H chart, I'm anticipating a DT
🔑
BLO = BUY LIMIT ORDER
ITF = INTERMEDIATE TIME FRAME
SLO = SELL LIMIT ORDER
TP = TAKE PROFIT
Intermediate time frames (4 hours to 6 days):
— Offer a clearer picture of the underlying trend compared to short-term frames.
— Provide more opportunities for confirmation signals and technical analysis.
— Allow for more flexible trading schedules, trades can be held overnight.
— Suitable for swing traders and some positional traders.

Nas100 Bearish correctionStrong intraday Volume
Retest of previous high
Consolidation at the high
Strong Bearish price action

NASDAQ 2024 DAY ONE NASDAQ
- Bullish above 16,750; potential run towards the downside 16,500 & below.
- Range: 16,750 - 16,500.

Nasdaq Intraday Review – Friday 29 Dec 2023I trade Nasdaq intraday exclusively
Trading in GMT time zone
Sharing my post day review & analysis in case it can help you :)
Did my analysis at +- 5:20am GMT
Looking exclusively for a buy, as Nasdaq is bullish overall – “The trend is your friend”
Even though we are at all-time highs, I keep my bias bullish.
So had my buy position C. open from yesterday.
Market moved up 380 pips from my position and I secured my trade once price was +-250 pips from my entry (this means I placed an actual stop loss at entry). As market moved down from 4. - I was out at entry.
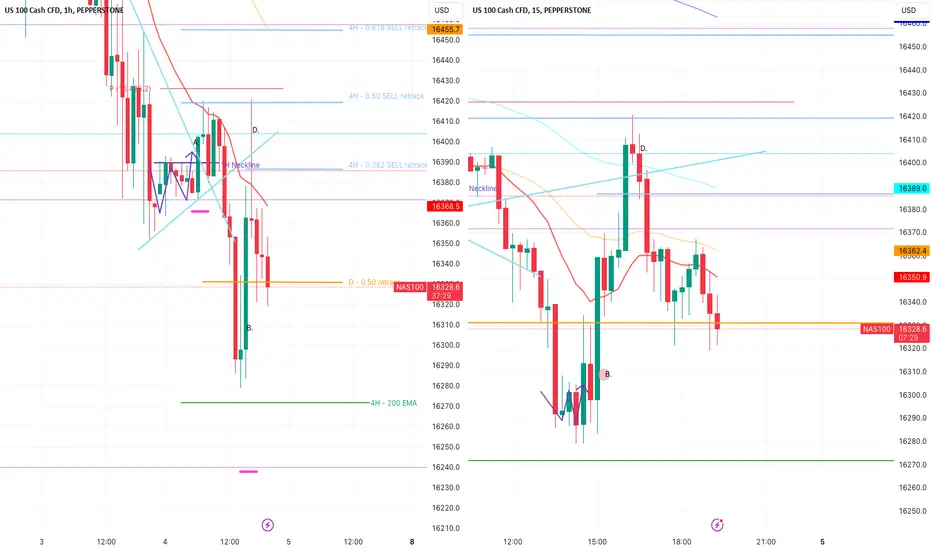
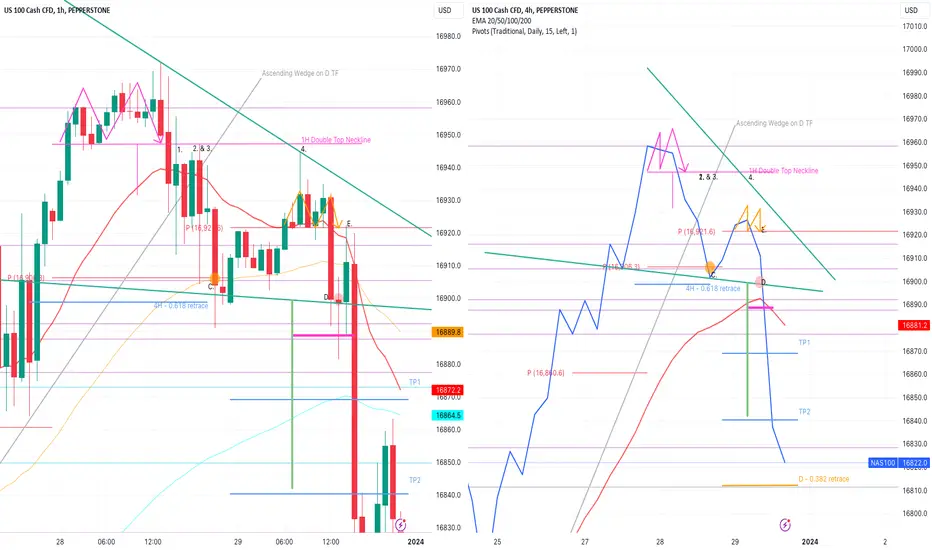
Bulls were unable to break the 1H double top (pink) neckline at 4. (yesterday there were 3 attempts) and today’s fourth and final failed attempt led to the bears stepping in resulting in a market drop.
Although I wasn’t looking for a sell, the sell at E. makes sense because (confirmations for this sell):
Market pattern:
Double Top market in pink lines with a neckline tested 4 times
Double top (marked in orange lines) formed just above the pivot point on the 1H TF. Market broke the neckline and re-tested the neckline (pivot point) at E. and on failing to break, bears dominated.
Ascending wedge (marked by grey trend lines) formed on the D TF and broken bearish (at 2.&3.). Once officially broken, price usually moves the same distance as the height of the pattern. The market coming up to test the neckline of the 1H double top for the fourth time can also be seen as a retest of the ascending wedge.
Falling wedge (marked with green lines) + head and shoulders (easily seen on the 4H line chart) - as the day progressed a strong head and shoulders formed on the 4H TF. The neckline was sloping down, which makes it a more bearish market pattern.
Candle sticks: yesterday closed with a red D candle, warning of a possible retracement on a bigger timeframe.
I entered a buy at D - confirmations:
Market Pattern: This was the very limit, the tipping point, of a buy. If bulls were going to step in it would be to prevent the neckline of the 4H head and shoulders from breaking bearish. There was also going to be the re-test of the neckline of the orange Double top and I like being part of the re-test in the same direction as the overall trend, bullish in this case.
S&R: 4H EMA providing some dynamic support
Fib: This level represented yesterday’s 0.618 fib level – a strong fib level
Candlesticks: A doji formed on the 1H TF
This was a risky setup so I set a super tight mental stop loss, marked with the thick pink line. If candles broke this level Nasdaq would sell with momentum.
Bears dominated and I took a 200 pip loss.
I’m not sad about this, it was a calculated risk.
Ultimately market dropped like a stone, crushing my hopes of a Santa Rally and taking out my other position that I tried to swing till 3 Jan 2024.
I hope you caught the sell! It was a stunning ~2000 pip move and you would’ve ended the year with some nice profit.
What could I have done differently:
I’m happy with my risk management and how disciplined I was at securing my trades at entry. I would never have taken a sell because my bias was bullish, but we will see what happens in 2024!
All the best for the new year!
Hope all your (and my) trading dreams come true!
TF = timeframe
TP = take profit
1H = 1 hour
4H = 4 hour
D = day
W = week
M = month
S&R = support and resistance
EMA = exponential moving average
NASDQ100 short biasShort / Bearish Bias on NASDQ100.
Technical Analysis Explained:
Highest normalized price reversal point exceeded (this is the highest red “resistance” zone)
Price greater than all time high (22/11/2021)
Z score and Price bearish divergence (week as z score has remained neutral rather than print a lower low)
Price trading at approximately second standard deviation (20 day fixed rolling window forecast)
Here is a closer look at current price action.
