NASDAQ has incredible place for sell we saw how strong was nasdaq last weeks, i think NASDAQ will touch that zone and its strong place for sell with care and low risk. see you soon and happy new year
US NAS 100


Nasdaq Intraday Review – Tuesday 26 Dec 2023I trade Nasdaq intraday exclusively
Trading in GMT time zone
Sharing my post day review & analysis in case it can help you :)
Back from Holidays and time to TRADE!
Did my analysis at +- 5:20am GMT
Looking exclusively for a buy, as Nasdaq is bullish overall – “The trend is your friend”
Even though we are at all-time highs, I keep my bias bullish. A true trend reversal will come with a double top market pattern on a high TF (i.e once a double top forms on the D TF, then I will consider a bearish bias). Plus we are at the bottom of an ascending triangle on the D TF marked with grey trend lines.
At time of analysis, I noted the following:
A doji candle on the D chart had formed from previous day.
Gap up on the day chart at market open this morning – indicating bullish presence.
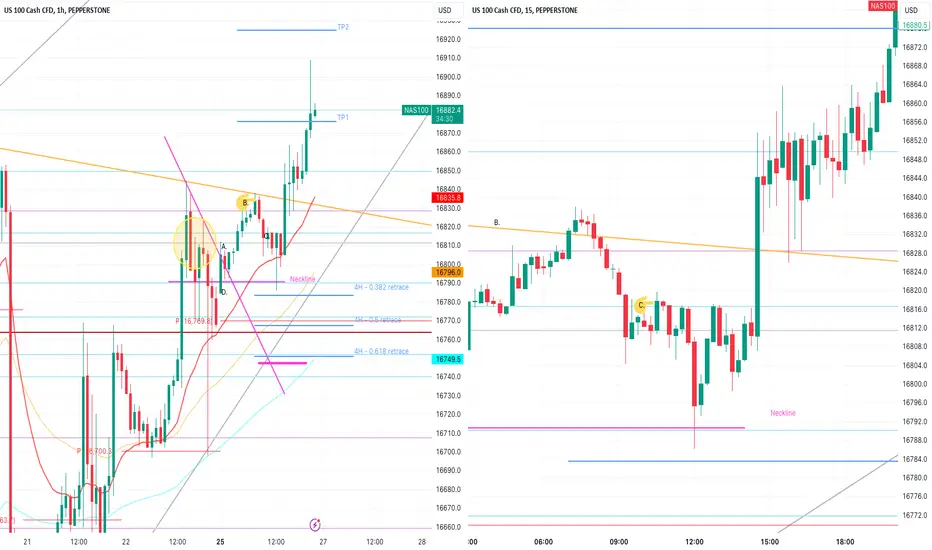
A double top had previously formed on the 1H TF (yellow circle) and broken the neckline bearish.
On the retest of the neckline (in the same direction as the overall trend i.e. bullish) the bulls broke the neckline as well as the pink temporary downtrend line + gap up.
There was a retest of the pink downtrend line + neckline at A. with a red candle and bulls pushed back up.
I entered a buy at B. because on my smaller TF’s it looked as if the candles had broken the strong resistance + temporary orange downtrend line.
Turned out to be a glitch on TradingView (seemed the trendline was incorrectly positioned on the lower time frames even though correct on the bigger TFs?) and as you can see at B. the orange trend line was not broken. I was convinced that if the resistance + orange trendline the uptrend would continue.
I also admit to being additionally biased due to the apparently impending “Santa Claud Rally” and a slight case of FOMO.
Market however turned down.
I recognized my weakness in entering this buy (emotional trading) and immediately set a take profit at entry so that if market moved up it would close this position. Even if market continued to move up and past this position, I didn’t deserve the profit from this buy because it was not executed professionally (in my opinion) and I don’t want profit from being lucky.
I entered a more reasonable buy at C. – Confirmations:
- Market Pattern: Double bottom formed on the 15min TF and entered at the break of the neckline at C.
- S&R: Market was rejecting a D S&R line (marked in grey) + 1H EMA was acting as dynamic support
- Candles and Fib: The red candle on the 1H TF before the C was a longwick candle rejecting the 0.618 fib level of a short-term Fib drawn on the 1H TF from swing low at D. to swing high B.
Mental stop was placed at thick pink line, below 4H 0.618 retracement level, where trendline and 4H EMA converged. Meaning that if candles started closing below this point, then my buy would have been invalidated.
I would also have added another position if the market went down this far.
Endured a draw down of 315 pips, but ultimately bulls pushed up at market open and at time of writing this, market moved a max of 915 pips up from my position.
Take profit plan:
Want to test this “Santa Clause Rally” theory. It is define as a bullish rally in the last 5 trading days of the year and the first 2 trading days of the new year.
So I will keep this position running and close +- 3 Jan 2024.
I am secured at entry (actual stop loss placed at entry), so I am trading risk free and will see how far market will rally.
What could I have done differently:
No let emotions and FOMO come into my trading as evidenced in my first buy. I got lucky and the position was closed at entry as market moved up and my mistake did not lead to a loss.
Good luck if you are still trading! :)
TF = timeframe
TP = take profit
1H = 1 hour
4H = 4 hour
D = day
W = week
M = month
S&R = support and resistance
EMA = exponential moving average
NAS100USD Will Go Up! Long!
Here is our detailed technical review for NAS100USD.
Time Frame: 4h
Current Trend: Bullish
Sentiment: Oversold (based on 7-period RSI)
Forecast: Bullish
The price is testing a key support 16012.0.
Current market trend & oversold RSI makes me think that buyers will push the price. I will anticipate a bullish movement at least to 16278.2 level.
P.S
The term oversold refers to a condition where an asset has traded lower in price and has the potential for a price bounce.
Overbought refers to market scenarios where the instrument is traded considerably higher than its fair value. Overvaluation is caused by market sentiments when there is positive news.
Like and subscribe and comment my ideas if you enjoy them!

Nasdaq (US100) The latest analysis of Nasdaq in 2023
Hi guys
The latest analysis of Nasdaq in 2023 (keep in mind)
We do not have an analysis next week, the analysis will start again from the second week of 2024
I hope the analysis helped you and you can get great profit from the market
And kick up a storm in 2024

ABNB PRICE ACTION-23rd DEC 2023This is my price action for ABNB. If you have any questions, feel free to post it in the comments.
I have explained SLs, Targets and entries as well. SL is the most important part of trading, and we should accept it and move on.
NOTE:ABNB LOOKS BULLISH

Nasdaq Intraday Review – Wednesday 20 Dec 2023I trade Nasdaq intraday exclusively
Trading in GMT time zone
Sharing my post day review & analysis in case it can help you :)
Did my analysis at +- 5:20am GMT
Looking exclusively for a buy, as Nasdaq is bullish overall – “The trend is your friend”
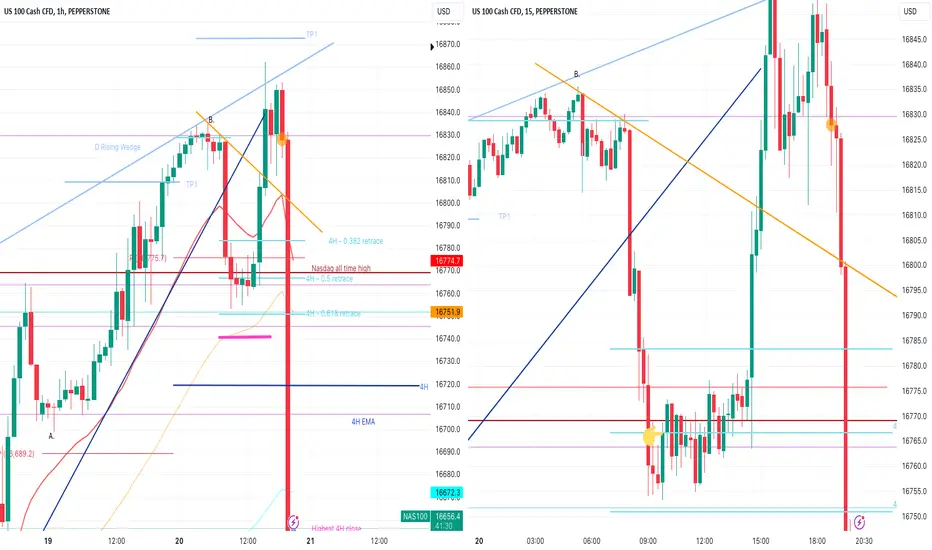
Navy blue trend line indicating just how steep and bullish the current trend is.
Interesting to see the 1H EMA matching the navy trend line almost perfectly.
The early morning market had pushed up since TP1 yesterday. A small double top had formed on the 1H TF and a red candle closed at 7am GMT on the 4H TF – this led me to believe a retracement might be in the works for today.
Decided I should enter my buy carefully with good confirmations (at least a break of the neckline of a double bottom market pattern), because at all-time highs the sellers are just waiting to jump in with a short.
Market came down strongly and started consolidating between the 50 and 61.8 Fib levels (fib drawn from swing low at A. and swing high at B. on the 4H TF).
I entered my buy at the break of the neckline of the double bottom that had formed on the 5min TF (indicated by the hand on the 15 min TF) – confirmations:
- Market pattern – break of the neckline of double bottom on 5min TF
- Fib – market hovering between the 0.5 and 0.618 fib level
- Trend line – not specifically respecting a trend line but buy in same direction as overall trend
- Candles - candles rejecting the 0.618 fib level with long wick candles on the 1H
- S&R – market consolidation near the brown line representing a resistance turned support level. Nasdaq re-testing this zone.
Mental stop loss placed at thick pink line. This was just below a strong 4H S&R zone and also the 0.618 fib level. So if candles started closing past this point then a sell would be in play and my buy would be invalidated.
Had multiple drawdowns and wondered if a 5min time frame to enter a buy was too small a TF. But stuck with my buy as my stop loss was not too far down and my loss would not be too big if stop loss hit.
Market open at 2:30pm GMT, introduced a strong bullish push and market rocketed up.
Secured my position at entry after market moved up +-250pips from my position. Then was trading risk free for the rest of the day.
The plan --> Wait for TP 1 to close half my position (if candles suggest weakness in this zone) and watch price action closely before closing the other half, hoping that market will rally.
The reality --> The 4H candle close at 7pm GMT failed to make a higher high from this morning. For me this was a bad sign and looked like it could be the peak of a second top on a double top market pattern on a very high TF (4H). So decided to close half my position at the orange dot.
Left the other half to run, but bears dominated with a massive push down, so I was out at entry.
Market moved about 950 pips from my buy and I took profit at about 600 pips.
What would I have done differently:
Feel like my trading was on point today, even though it wasn't the biggest pip profit, I am happy with my decisions and analysis.
Good luck if you are still trading! :)
TF = timeframe
TP = take profit
1H = 1 hour
4H = 4 hour
D = day
W = week
M = month
S&R = support and resistance
EMA = exponential moving average
NAS100USD Will Go Up! Long!
Here is our detailed technical review for NAS100USD.
Time Frame: 30m
Current Trend: Bullish
Sentiment: Oversold (based on 7-period RSI)
Forecast: Bullish
The market is trading around a solid horizontal structure 16756.9.
The above observations make me that the market will inevitably achieve 16799.0 level.
P.S
The term oversold refers to a condition where an asset has traded lower in price and has the potential for a price bounce.
Overbought refers to market scenarios where the instrument is traded considerably higher than its fair value. Overvaluation is caused by market sentiments when there is positive news.
Like and subscribe and comment my ideas if you enjoy them!

Nasdaq Intraday Review – Tuesday 19 Dec 2023I trade Nasdaq intraday exclusively
Trading in GMT time zone
Sharing my post day review & analysis in case it can help you :)
Did my analysis at +- 5:20am GMT
Looking exclusively for a buy, as Nasdaq is bullish overall – “The trend is your friend”.
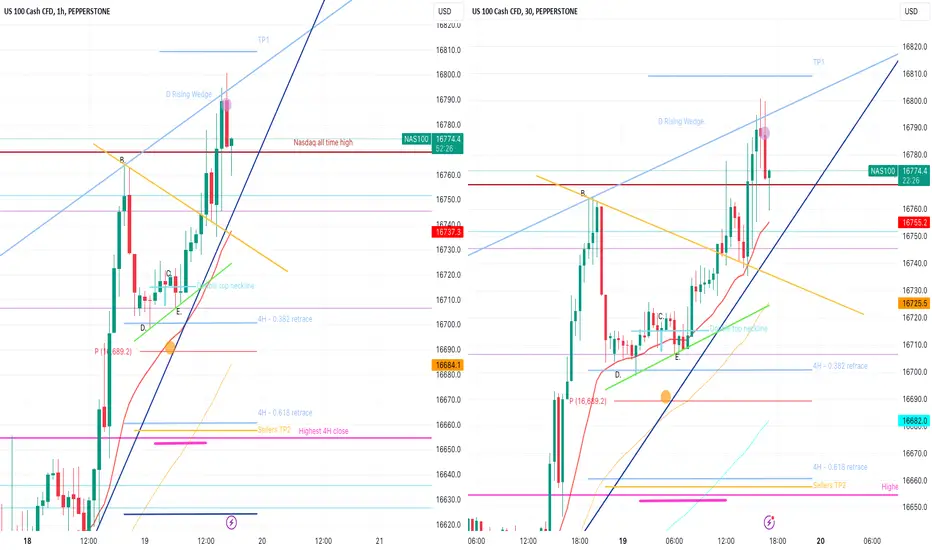
Navy blue trend line indicating just how steep and bullish the current trend is. Even though we are at all-time highs, I keep my bias as a buy because up until now Nasdaq is giving all the confirmations for a buy.
At the time of my analysis, I noted the following:
The early morning market had already closed a 4H candle in green at D. on the 4H TF. – meaning buyers were already resisting a bearish push down from Nasdaq all-time high.
1H EMA and pivot point were below candles, giving bullish push up.
30min EMA had been acting as dynamic support (as seen on the 30min chart). Nasdaq respects 30min EMA when the market is very bullish.
Long wick candle had already touched the 4H 0.382 fib retracement level (also at D.) and market had moved up from there.
Entered a buy at C. – Confirmations:
Market Pattern – break of the neckline of the double bottom
Fib – shallow retracement (0.382) on high time frame reached i.e. 4H TF with swing low at A. and swing high at B.
Candlesticks – long wick candle rejecting 0.382 area
S&R – 30min EMA providing dynamic support
Mental stop placed below the thick pink line – this area represents a 4H 0.618 retracement, the seller’s TP2 and a previously very strong resistance level, now turned support. So if candles start closing below this point then the buy is invalidated.
Entering a buy at C. was poor form and represented lack of concentration on my part. In my opinion, this does not represent a double bottom and there was no break of the neckline at C. If you change the 1H chart to a line chart you will not see a clear double bottom. Clearly, I had not had my morning coffee before executing this buy.
The correct place to execute a buy would have been at E. This is where a double top had formed on the 1H TF and the market had moved down the same distance as the height of the market pattern. At E. there was strong support + a re-test of the neckline of the double top in the same direction as the overall trend. So, I was 150 pips from where I wanted to be. Not a big issue but still…irritating.
Market moved up, tested the very temporary down trend (marked in yellow) with a 1H red candle and market open saw a 1H and 4H candle close just a above the Nasdaq all-time high. Unbelievable.
Decided to take partial profit (30% of my total position size) at the purple dot because the blue trend line represents the top of a rising wedge chart pattern on the D chart. So +- 650 pips profit.
Leaving the rest to run and will judge take profit on the price action.
But plan is to take 20% more partial profit at TP1 and let the rest run. Otherwise I will be out at entry.
I would have entered 2 more positions at the orange dot because of the 1H EMA + Pivot + 0.382 fib level and I would have held to a draw down till the 4H 0.618 because it was only +- 320 pips down, so not far to go.
Good luck if you are still trading – hope you caught the buy! :)
TF = timeframe
TP = take profit
1H = 1 hour
4H = 4 hour
D = day
W = week
M = month
S&R = support and resistance
EMA = exponential moving average
Nasdaq Intraday Review – Monday 18 Dec 2023I trade Nasdaq intraday exclusively
Trading in GMT time zone
Sharing my post day review & analysis in case it can help you :)
Did my analysis at +- 5:20am GMT
Looking exclusively for a buy, as Nasdaq is bullish overall – “The trend is your friend”
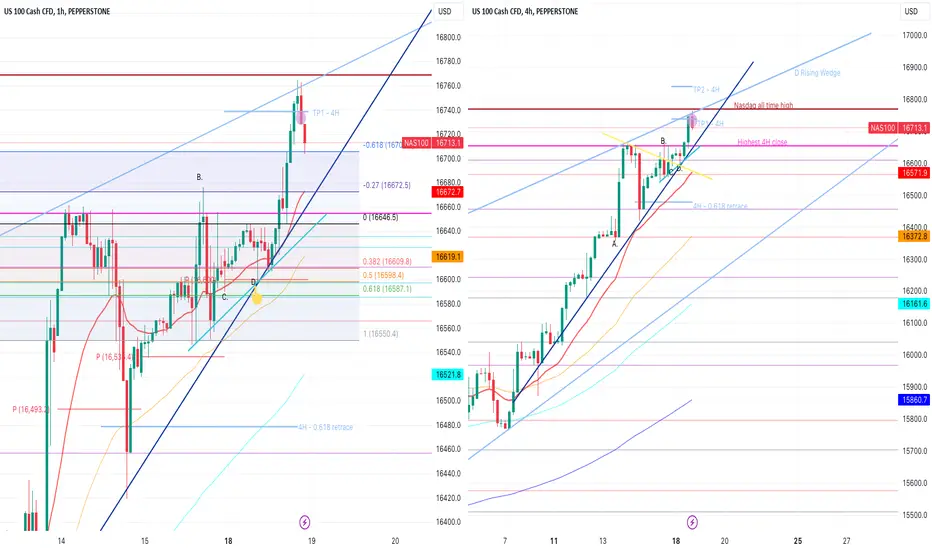
Navy blue trend line indicating just how steep and bullish the current trend is.
At the time of my analysis, noted the following:
In the early morning hours, the market had tested the pivot point and the 1H EMA at C. resulting in a long wick candle – showing buyers rejecting this area.
From there, market moved up steadily towards the pink resistance line.
This pink line has been rejected on multiple occasions on the 4H TF. This resistance represents the highest ever 4H candle close in Nasdaq history, so it’s a significant resistance zone.
Even though we had a deep retracement at A. previously, the market (bullish trend) + pivot points + EMA's are moving closer and closer to this line, even after multiple rejections. So bulls keep pushing up to this area.
The early morning bulls had broken the yellow temporary trend line, by the green 4H candle close at C.
So for me, with pivots and EMA’s below the candles and the temporary yellow down trend broken, market was ready to test the pink resistance line again today. It seemed that the fib drawn previously (the other day) from swing low at A. to swing high at B, was still in play. I was ready for a buy.
Bears pushed down heavily at +- 8:30am GMT, pushed through the 1H EMA, down to the pivot.
I entered a buy at the bottom of the wick at D. (the stars aligned, and it was a perfect buy) – Confirmations:
- S&R: Pivot point
- Trend line: Navy blue trend line
- Fib level: 0.50 fib level on the short term Fib on 1H (drawn in)
Super aggressive entry, where candles could easily have fallen through. But I have seen with Nasdaq that sometimes the market will push to the very tipping point and then move significantly from there. Sometimes that tipping point is not clear. But today it was clear (to me at least) that if Nasdaq closes down past the pivot point (which was below the 1H EMA) that a big retracement would take place.
Entering at this very tipping point between buy and sell can sometimes be a good strategy (and one that I must test more) because your stop loss is so close to your entry, that you don’t stand to lose much. If the candles start closing below the pivot point and the bulls are not strong enough to even bounce from this zone, then the buy is invalid and you cut your small losses quickly. But often, at this tipping point, you get a big reaction, and this is what happened today.
Once the market moved up +-250 pips, I put stop loss at entry and I was trading risk free for the day.
Ultimately, New York market open was strong enough to close a 4H candle above the pink resistance line (the highest ever 4H candle close).
With bulls strong enough to achieve this, I knew Nasdaq was in new territory and was willing to go big or go home with nothing (i.e I would not take profit until market rallied - I would rather be taken out at entry). Market retested the pink line with a red candle on the 1H and moved up from there.
In terms of taking profit, I wanted to see how far bulls could rally and waited for the first red candle to close on the 1H TF before closing for the day (at purple dot).
Market ran +- 1650 pips from my entry and I closed at +- 1300 pips profit for the day (at purple dot).
What would I have done differently:
Enter a bigger position at my entry today. So easy to say in hindsight, isn't it! :) But I need to do some serious back testing on my "tipping point" theory - so that's my take away for today.
We are now close to Nasdaq all time high – exciting times! :)
Good luck if you are still trading – hope you caught the buy! :)
TF = timeframe
TP = take profit
1H = 1 hour
4H = 4 hour
D = day
W = week
M = month
S&R = support and resistance
EMA = exponential moving average
Nasdaq (us100)Hello
Let's have Nasdaq analysis for this week. Stay tuned. We have weekly analysis every week
Let's see what scenario we can have
I hope you have a good and profitable week

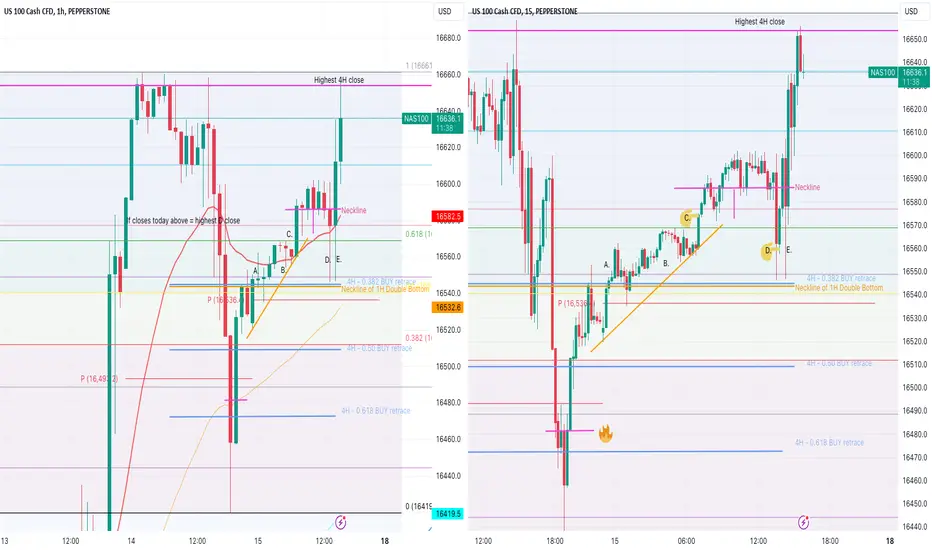
Nasdaq Intraday Review – Friday 15 Dec 2023I trade Nasdaq intraday exclusively
Trading in GMT time zone
Sharing my post day review & analysis in case it can help you :)
Did my analysis at +- 5:20am GMT
Looking exclusively for a buy, as Nasdaq is bullish overall – “The trend is your friend”
At the time of my analysis, noted the following:
Fireball:
A beautiful double bottom formed on the 15min TF (as indicated by the fireball). What a perfect buy – confirmations here would have been:
- Market pattern: Break of the neckline of double bottom on the 15min TF
- FIB level: Double bottom formed in a 0.618 fib level (this is a strong level) on a fib that was drawn on a high TF (4H TF)
- S&R: Dynamic support by the 1H 50 EMA
- S&R: Rough dynamic support of the 4H EMA at the bottom of the long wick candle
- Candles: Long wick candle forming in strong fib level and 4H EMA level
But unfortunately, I was sleeping – Hope you caught this gem!
So had to look for my imperfect entry.
Noted that a big double bottom had formed on the 1H TF and had broken the neckline at A.
At B. there was a small re-test of the neckline supported by the 1H EMA plus the 30min EMA.
I was very cautious of a sell retracement because yesterday’s D candle closed in the red and in a doji formation, indicating that a bigger retracement might be in the works. This could be a real possibility, because we are at all time highs so the market might retrace on the bigger TF and then gather enough bulls to push through and create new all time highs.
Sell retracement draw in.
Entered a buy at C. – Confirmations:
- S&R: dynamic support by both the 1H and 30min EMA
- Candles: Long wick candle at B on 1H TF
- FIB: Yesterday the market moved down to 0.618 level and is now moving up in a good trend line (marked by temporary orange trend line). Market may be heading for the TP1 of yesterday's 4H buy fib.
- Entered at C. where the 15min candle closed past the 0.618 SELL fib level (to be extra safe, because the candles were rejecting from this level just prior)
Mental stop was placed just below pivot point and neck line of the 1H double bottom.
Market moved up and I set stop loss at entry after +- 250 pips.
Market took me out after a double top formed on the 1H TF and I entered again at D. - Confirmations:
- Market Pattern: Retest of double bottom on 1H TF
- Candles: 5min showed consolidation at this level
- Market pattern: Market had travelled down more than the height of the double top and was bound to re-test the neckline. I like being part of a re-test that is in the same direction as the overall trend (bullish in this case).
- This was an aggressive entry.
Market moved up and I secured at entry.
In the minutes before New York market open, the bears pushed down and I was out at entry at E. and happy to be out because the neckline of the double top seemed to hold the bears down at that moment in time.
Market was too choppy for me and market open was in a few seconds so I decided to stay out for the day.
It’s a good trading day when you make profit (obviously :) ), make a small loss (shows risk management + good trade management) or you stay out (and protect your capital in a choppy market).
It turned out to be an unfortunate spike down for me because the bulls accelerated up after market open and I lost out on about 1000 pips at the time of writing this. But it could’ve gone the other way as well!
What could I have done better:
I’m happy with my decisions today – could have maybe been more aggressive and waited for the 5 min candle to close at E, but it was too risky for me as it was just before market open and I took a loss yesterday so had to be conservative.
Good luck if you are still trading – hope you caught the buy! :)
TF = timeframe
TP = take profit
1H = 1 hour
4H = 4 hour
D = day
W = week
M = month
S&R = support and resistance
EMA = exponential moving average
NAS100 US100 Technical Analysis London Open / NY OpenThis video provides a detailed analysis of the NASDAQ. Presently, it has reached a robust resistance level on the weekly timeframe. The market appears quite stretched, presenting a potential counter-trend trading opportunity around the London Open. If missed, there might be another chance around the New York Open later today. Throughout the video, we delve into essential technical aspects such as price action, market structure, and the prevailing trend. It's crucial to note that this content is purely educational and should not be interpreted as financial advice.

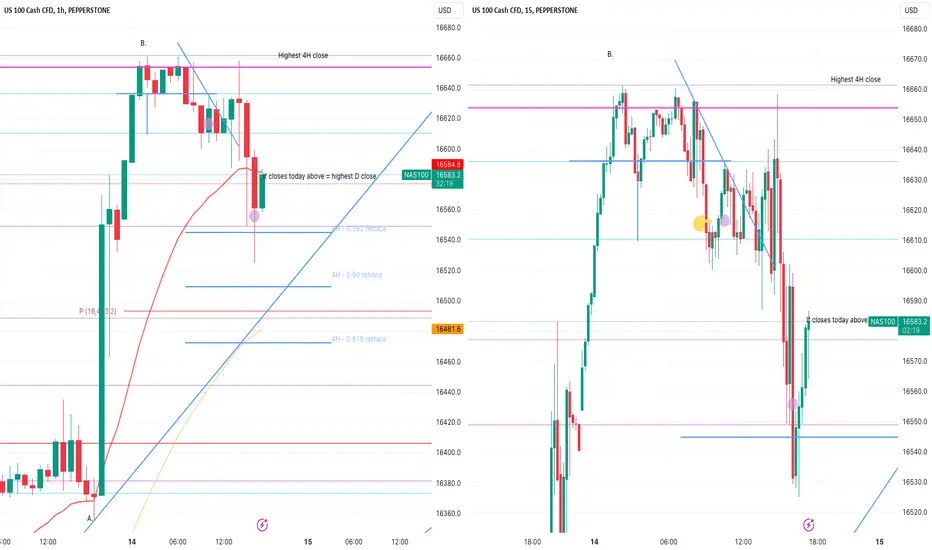
Nasdaq Intraday Review – Thursday 14 Dec 2023I trade Nasdaq intraday exclusively
Trading in GMT time zone
Sharing my post day review & analysis in case it can help you :)
Did my analysis at +- 5:20am GMT
Looking exclusively for a buy, as Nasdaq is bullish overall – “The trend is your friend”
Noted that Nasdaq rallied +- 1000 pips since market open on 14 Dec. Basically the continuation move from FOMC last night.
At the time of my analysis, a nice double top had formed on the 1H TF.
The bears broke the neckline of the double top and the market moved down +- the same distance as the height of the pattern.
Here the market found support 16610 level on the 1H. 30min EMA provided dynamic support in this area as well.
A double bottom formed on the 15min TF and I entered a buy on the break of the neckline (as indicated by the hand).
Confirmations:
- Market pattern: Double top profit target reached on 1H TF (ie the market moved +- the same distance as the height of the pattern)
- Market pattern: break of neckline of double bottom on 15min TF
- S&R: dynamic support by 30min EMA
- Previous day positive sentiment regarding FOMC
This was an aggressive move because if the market was going to retrace, the 4H fib level were FAR down (0.382 fib level is 730 pips down - thats a big draw down).
Watched price action carefully ad up until market open, I could see buyers preset in the market.
On market open bears testes down and bulls tested the highest 4H candle close and this session ended in a red doji candle.
I had a bad feeling when momentum of market open was not able to break the pink resistance line. If you watched the candles at 3pm GMT, you would have noted the market pushing a bit over the pink resistance line and then in the last seconds of the sessions bears dominated.
At this point I should have trusted my gut / bad feeling and put stop loss at entry, but alas. The green doji on the 4H threw me off.
Wanted to see how market would react to 1H EMA and the first red candle after the doji on the 1H closed above the 1H EMA, which gave me hope that the 1H EMA would hold as dynamic support.
But as it came down a second time and closed below the 1H EMA, I decided to close.
Took an 800 pips loss for the day.
What could I have done differently:
Trusted my gut on the formation of the 1H red doji and gotten out because my buy was aggressive in the first place.
Also the doji indicated that the market came to re-test the neckline of the double top on the 1H and failed (even with the momentum of market open) to break through, so a strong sell was in play.
Also a buy at all time highs is agressive.
Not getting back in today as the 4H EMA is so far down. I rather live to trade another day!
At least I still have my (partial position) buys open from the other day which is 3'500 pips up.
Hope you did better than me! :)
- Ultimately 1000 pips LOSS for the day.
- Got the market totally wrong and I am out for the rest of the day!
- No revenge or overtrading for me.
- Good luck if you are still trading!
TF = timeframe
TP = take profit
S&R = Support and resistance
1H = 1 hour
4H = 4 hour
D = day
W = week
M = month
NAS100/NASDAQ UPDATESIm updating this idea, FOr valid and invalid zone, if price keep pushing higher or break this high, then probably this idea is invalid.
If price start declining then Im expecting price goes 15600-15500 zone for grab demand. before we can take off to higher 16300$ zone.
This is only my view, This is not a financial advice.
Follow for more.
I will update this if price has momentum on the upside, my bias is still short. before we can take off. Use that highs as your stoploss no matter what.
Trade at your own risk.

NAS100/USCASH100 CFDBased idea wait for a retracement maybe a lower of 15500 zone.
before we could get the 2021 highs 16700 zone.
I will update this weekly if price reach the zone on lows and highs.
This is only my view.
This is not a financial advice or signals.
For more daily or weekly updates Follow for more.
COme and check me out for daily scalping
trades.
KEEP UPDATED on Weekly.
Not posting Daily if price not meet my criteria.
Lets call it a swing trades.
If youre old on my followers focus on One pair.
its kind of boring trades but its worth it to wait.
Advice 101:
Trading in the financial markets can be a profitable endeavor, but it also carries certain risks.

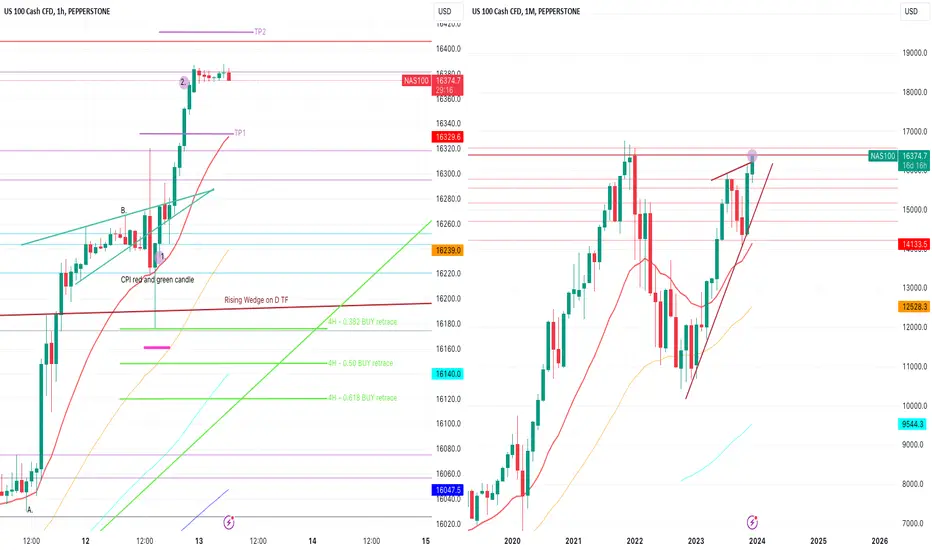
Nasdaq Intraday Review – Tuesday 13 Dec 2023I trade Nasdaq intraday exclusively
Trading in GMT time zone
Sharing my post day review & analysis in case it can help you :)
Did my analysis at +- 5:20am GMT.
Looking exclusively for a buy because Nasdaq is bullish at the moment - "The trend is your friend".
As always in a trending market, the market could retrace before continuing the current trend.
So I drew my Fib from swing low at A. to swing high at B. on the 4H TF - the higher the TF the stronger the fib levels "could" be.
Noted that the market had broken out of the rising wedge which had been forming on the D TF (visible also on the M TF here).
There was no proper re-test of the dark brown line which gave me the feeling that the market still needed to retest this chart pattern.
Yesterday was also CPI news, so I knew it would be a volatile day. I didn't want to get into the market early (before CPI) because this could cause spikes down back into the rising wedge, which if the sellers jumped in, could cause the candles to get sucked deep back into the rising wedge chart pattern.
I also noted that the 4H 20 EMA was far down below and it was a 1300 pip drop to the 0.618 fib level from where the candles were consolidating when I did my analysis. That's a very big draw down that I didn't want to take a chance on.
So I decided to wait for CPI to be released at 13:30pm GMT.
As the morning progressed, noted the formation of a rising wedge (roughly marked with green lines).
CPI caused two long wick candles, one red candle with a long wick up and one green candle with a long wick down - forming a doji on the 4H TF.
I entered a buy at 1. with only one position - confirmations:
1. The CPI green candle reached down to the 0.382 fib retracement level and closed green, above the 1H 20 EMA - indicating that even with news, the dynamic support offered by the 20 EMA was holding strong. So confirmations = Fib level + dynamic support + long wick candlestick formation.
2. Having watched the candles / price action the whole morning, I felt buyers where strong because even the 30min EMA was acting as support until CPI.
Stop loss was a mental stop placed below the 0.382 level at the pivot point. If the candles started closing below this level there would be the serious possibility of the market falling back down into the rising wedge formation.
The market moved up from here and I placed an actual stop loss at entry when the market was +- 250pips from my position.
Watched the candles closely at TP1 to determine if I had to take partial profit but bulls pushed through easily and I held my full position.
Eventually just before my bedtime, I closed 70% of my position at 2. at +- 21:55pm GMT.
So that's +- 1400pips profit for the day.
Leaving the rest to run today.
Today we have FOMC, plus we get to watch what the market does as it approaches the all time high on the M TF.
All the best for your trading! :)
TF = timeframe
TP = take profit
1H = 1 hour
4H = 4 hour
D = day
W = week
M = month
Nasdaq Intraday Review – Monday 11 Dec 2023I trade Nasdaq intraday exclusively
Trading in GMT time zone
Sharing my post day review & analysis in case it can help you :)
Did my analysis +- 5:20am GMT
Looking exclusively for a buy as Nasdaq is overall bullish - "The trend is your friend"
Noted at A. that the market retested the blue downtrend line that it had been respecting - candle closed above trendline and moved up from there. A clear break and retest of the downtrend line.
At time of analysis, the market was consolidating at 1.
Drew my buy fib from swing low at A. to swing high at B.
Noted that 0.383 Fib retracement level aligned with pivot point at 2.
Noted that all EMA's + pivot point were below candles - indicating dynamic support for a push up.
Noted the formation of a double bottom, indicated by the hand and supported by the 1H 20 EMA.
Entered a buy at 1. at the break of the neckline - Confirmations:
- Market pattern - break of neckline of double bottom on 1H TF
- Dynamic support of the 1H 20 EMA
- Close to (230 pips) the shallow retracement level (0.382 fib level) + pivot point - so draw down would be minimal
- Trendline - downtrend broken & retested already
Entered at about 6am GMT
Was planning to enter another position if the market reached 2.
But this was not the case, as from there the market moved up nicely and market open went in my favour.
I took partial profit twice (closed a portion of my position twice), close to TP1 (marked by the purple dots) as I noted some weakness in the candles. This was a strong sell area as Buyer's TP1 had been reached (indicating the buy was possibly over) + the upper line of the Rising Wedge formation on the D TF.
I left a runner (a portion of my position) open with a time stop i.e. I leave it open until the end of the day as Nasdaq can often rally for the whole day.
This turned out to be the case TP2 was reached.
- Ultimately 1000 pips profit at TP1 and +- 2000 pips profit at TP2 for my runner.
- Will leave my runner open for 12 Dec trading and see how that goes.
What could I have done better:
I should have entered my second position after the formation of the green hangman candle (seven candles after 1.). Market pushed below the neckline (long wick down) and closed green above the neckline and EMA. This indicated buyers strength in the market.
Good luck if you are still trading! :)
TF = timeframe
TP = take profit
1H = 1 hour
4H = 4 hour
D = day
W = week

Nasdaq (US100)
Hello
Let's have Nasdaq analysis for this week. Stay tuned. We have weekly analysis every week
Let's see what scenario we can have
I hope you have a good and profitable week

NAS100USD Will Grow! Long!
Please, check our technical outlook for NAS100USD.
Time Frame: 1D
Current Trend: Bullish
Sentiment: Oversold (based on 7-period RSI)
Forecast: Bullish
The market is approaching a significant support area 15902.5.
The underlined horizontal cluster clearly indicates a highly probable bullish movement with target 16566.1 level.
P.S
Please, note that an oversold/overbought condition can last for a long time, and therefore being oversold/overbought doesn't mean a price rally will come soon, or at all.
Like and subscribe and comment my ideas if you enjoy them!

NAS100 TECHNICAL ANALYSIS Today is NFP and anything can happen, but according to my analytics that am using, which is universal to everyone, PRICE , PRICE MOVEMENTS , I would like to see a pullback to a Fib level 61.8 which perfectly fit with the previous resistance which is about to turn into Support if the level Holds.
If not then I will be buying at the support level, why? Because the Index have 2 weeks in range, no clear move, and will apply the simple approach or rule of thumb which say's "BUY LOW & SELL HIGH", in this in case, according to my understanding when the price is at support, with the right tools one always have a chance to buy.

NAS100USD Will Go Higher! Buy!
Here is our detailed technical review for NAS100USD.
Time Frame: 8h
Current Trend: Bullish
Sentiment: Oversold (based on 7-period RSI)
Forecast: Bullish
The market is trading around a solid horizontal structure 15778.8.
The above observations make me that the market will inevitably achieve 16052.7 level.
P.S
Overbought describes a period of time where there has been a significant and consistent upward move in price over a period of time without much pullback.
Like and subscribe and comment my ideas if you enjoy them!

US100 NASDAQ Technical Analysis And Trade Idea NAS100Lately, the NAS100 has displayed a strong bullish trend. This video extensively explores the trend, meticulously analyzing price movements and identifying possible trading prospects by thoroughly assessing both the weekly and daily timeframes. Anticipate a detailed assessment of price behaviors, market patterns, trend assessments, and key technical analysis components. It's crucial to emphasize that the content provided is purely for educational purposes and should not be interpreted as financial advice.
