NAS100/USTECH100 UPDATESHere is my View this week. Nas100 could test 15500 zone before it falls?
This is not a financial advice. This is only my view.
Stoploss below the previous low.
Trade at your own risk.
Im happy to be back. Sorry for no updates folks.
More Data and market analysis to be posted today.
US NAS 100

Is Nas bullish?4Hr time frame shows us price left a previous imbalance open for price to fill at a point in time. There is clear buy side liquidity testing below the imbalance as well..
It is possible that we can see bullish momentum this week.. I’m bullish this week

Nasdaq Trading IdeaBased on Simple Technical Analysis ( Trendline + Support & Resistance )
Risk Disclaimer:
Please be advised that I am not telling anyone how to spend or invest their money. Take all of my analysis as my own opinion, as entertainment, and at your own risk. I assume no responsibility or liability for any errors or omissions in the content of this page, and they are for educational purposes only. Any action you take on the information in these analysis is strictly at your own risk. There is a very high degree of risk involved in trading. Past results are not indicative of future returns. Good luck :-)

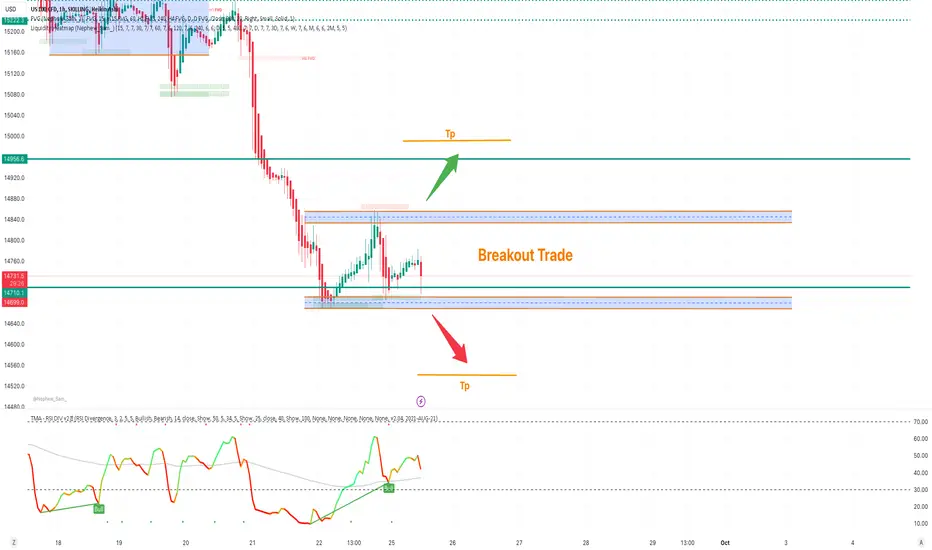
NASDAQ Range BoundNAS100 moving in range, wait for the breakout to get trade or place your buy and sell stop with given Tp's.
Mange your risk according to account size!
NAS100 US100 Technical Analysis and Trade Idea NASDAQTaking a look at the NAS100 currency pair, a significant development comes to light: it has reached a pivotal support level following a substantial bearish trend. At this juncture, it becomes increasingly evident that the NAS100's price has over extended, potentially indicating an imminent retracement.
As is customary, the accompanying video in this description provides an examination of critical factors, encompassing aspects such as price action, market structure, and various essential elements of technical analysis. It is essential to underscore that the information conveyed in this content is exclusively intended for educational purposes. Under no circumstances should it be interpreted as financial advice. Consequently, it remains of utmost importance to implement rigorous risk management strategies when engaging in trading endeavors.

DXY: 105.664-106.416 Important boundary zoneHello?
Hello traders!
If you "Follow" us, you can always get new information quickly.
Please also click “Boost”.
Have a good day.
-------------------------------------
(DXY chart)
The key is whether it can meet resistance around 105.664-106.416 and fall.
If not, the investment market is likely to enter a recession.
----------------------------------------
(SPX500USD chart)
On each chart, the HA-High indicator was touched and fell.
Accordingly, the likelihood of touching the HA-Low indicator on each chart is increasing.
(1D chart)
Currently, only the 1D chart is touching the HA-Low indicator and is falling.
If you touch the HA-High indicator and then move down to touch the HA-Low indicator, you can say that you are in a trend reversal zone.
Therefore, at this time, there is a high possibility that the trend will be determined depending on whether it is supported or resisted by the HA-Low indicator.
You can see that the trend has turned to the downside as it currently falls below the HA-Low indicator.
This is likely to lead to a cascading decline.
In order to stop the cascading decline, the price must rise above the HA-Low indicator to show support.
If the decline continues around 4247.8, the HA-Low indicator is expected to decline and be created.
At this time, it is important to receive support from the HA-Low indicator.
-------------------------------------------------- ----
(NAS100USD chart)
The difference between the NAS100 chart and the SPX500 chart is that it has not yet touched the HA-Low indicator on the 1D chart.
(1D chart)
However, if it falls further, a new HA-Low indicator is expected to be created, so the key is whether or not there is support near the HA-Low indicator.
-------------------------------------------------- -------------------------------------------
** All explanations are for reference only and do not guarantee profit or loss in investment.
** Trading volume is displayed as a candle body based on 10EMA.
How to display (in order from darkest to darkest)
More than 3 times the trading volume of 10EMA > 2.5 times > 2.0 times > 1.25 times > Trading volume below 10EMA
** Even if you know other people’s know-how, it takes a considerable amount of time to make it your own.
** This chart was created using my know-how.
---------------------------------

NAS100NAS100 is at very critical level. After the recent massive sell off the buyers are being reluctant to buy.
But the price is also reached at inclining trendline, which is also the BC length of harmonics.
It seems like harmonic may attempt to complete its final length CD.
If CD length completes the realistic target for bulls could be 15600.
What you guys think of this idea ?

Attempting a trend reversal in DXY and SPX500Hello?
Hello traders!
If you "Follow" us, you can always get new information quickly.
Please also click “Boost”.
Have a good day.
-------------------------------------
(DXY chart)
It has not yet risen to the vicinity of the arrows shown on the 1M chart and 1W chart.
However, there is a trend reversal movement in the 1D chart.
Therefore, if it holds at 104.789, it is highly likely that DXY will eventually switch to an upward trend.
If the 105.664 point on the 1M chart and the 106.416 point on the 1W chart rise above the 105.664-106.416 range formed by these two points, there is a possibility that the investment market will enter a recession.
Accordingly, caution is required when investing.
------------------------------------------------
(SPX500USD chart)
Looking at the 1M chart, it shows support around the 4419.8 point.
Therefore, if it remains around 4419.8, it is expected to show a further upward trend.
(1W chart)
The 1W chart appears likely to lead to a further decline as the HA-High indicator shows a decline.
However, since the HA-Low indicator is still located around 2755.8, I think it should be interpreted that it is still maintaining an upward trend from a mid-term perspective.
It is necessary to check whether support is received around the above support and resistance points of 3903.4, 4116.0, and 4403.3.
(1D chart)
On the 1D chart, you can see that it is located in a trend reversal zone.
Accordingly, it is judged that the upward trend can be maintained only if it remains above the 4420.0 point.
-------------------------------------------------- -
(NAS100USD chart)
The NAS100USD chart looks slightly different from the SPX500USD chart.
(1D chart)
Therefore, if the HA-Low indicator on the 1D chart is not generated by rising, I think there is still a chance for it to rise.
(1M charts)
Therefore, the key is whether it stays above the 15090.3 point on the 1M chart.
The maximum support area is around 14710.6.
-------------------------------------------------- -------------------------------------------
** All explanations are for reference only and do not guarantee profit or loss in investment.
** Trading volume is displayed as a candle body based on 10EMA.
How to display (in order from darkest to darkest)
More than 3 times the trading volume of 10EMA > 2.5 times > 2.0 times > 1.25 times > Trading volume below 10EMA
** Even if you know other people’s know-how, it takes a considerable amount of time to make it your own.
** This chart was created using my know-how.
---------------------------------

NAS100USD Will Go Lower From Resistance! Sell!
Please, check our technical outlook for NAS100USD.
Time Frame: 12h
Current Trend: Bearish
Sentiment: Overbought (based on 7-period RSI)
Forecast: Bearish
The market is approaching a key horizontal level 15187.9.
Considering the today's price action, probabilities will be high to see a movement to 14986.4.
P.S
We determine oversold/overbought condition with RSI indicator.
When it drops below 30 - the market is considered to be oversold.
When it bounces above 70 - the market is considered to be overbought.
Like and subscribe and comment my ideas if you enjoy them!

Nasdaq Push before fall? Just looking at Price ActionBased on a higher timeframe I speculate that Nasdaq could push up higher towards 15360.5 as this price range falls into equilibrium based on the High to the Low left on the 4hr timeframe from last weeks price action.
I can also clearly see that price swept previous lows on a 1hr & 4hr timeframes.
with this information I jumped to a 5 minute timeframe, and can clearly see Friday of last week price left a beautiful displacement high, and a Fair Value Gap where Sunday price went to trade down towards 15203.4 testing the FVG once more.. giving me confirmation of price wanting to push higher.
So my full idea is that ill wait for price to go towards 15360.5 area to look for a short position.
Remember this is all just my personal conclusion..

NAS100 outlookOutlook for next week Bearish bias,
Confluences:
Daily LH formed + a lot of buyers exhaustion on Daily time frame
4H bos + LH that was formed at the 78,6%
4H bearish engulfing pattern
Market is moving under the MA
TP'S -27% / -61.8%
( bias can change during the week price action is 1)

NAS100 BUY As long as the price is above the red line support, there is a high probability that the price will hit the green resistance

NAS100 Double BottomNASDAQ forming a double bottom on 15min time frame with bullish divergence.
Manage your Risk!

Trend reversal zone: 103.484-104.064Hello?
Hello traders!
If you "Follow" us, you can always get new information quickly.
Please also click “Boost”.
Have a good day.
-------------------------------------
(DXY chart)
If this rise rises above 105.664 on the 1M chart, a new trend is expected to be formed.
This new trend is expected to show its exact direction when it rises above 106.416 on the 1W chart.
If you look at the location of the high point where the finger on the 1D chart is pointing, you can see that it is in a downward trend.
In order to turn this downward trend into an upward trend, support must be found around 103.484-104.064.
If that happens, DXY is likely to turn to the upside.
---------------------------
(SPX500USD chart)
The possibility of renewing the new high (ATH) is increasing while maintaining the price above the HA-High indicator (4419.8) on the 1M chart and the HA-High indicator (4478.4) on the 1W chart.
Accordingly, the key is whether the price can rise above the HA-High indicator (4563.2) on the 1D chart.
To do this, we need to check whether we can receive support around 4514.3.
-------------------------------------------------
(NAS100USD chart)
If it rises above 15624.6, it is expected to renew the new high (ATH).
Accordingly, the key is whether it can receive support and rise around 15090.3-15379.1.
-------------------------------------------------- -------------------------------------------
** All explanations are for reference only and do not guarantee profit or loss in investment.
** Trading volume is displayed as a candle body based on 10EMA.
How to display (in order from darkest to darkest)
More than 3 times the trading volume of 10EMA > 2.5 times > 2.0 times > 1.25 times > Trading volume below 10EMA
** Even if you know other people’s know-how, it takes a considerable amount of time to make it your own.
** This chart was created using my know-how.
---------------------------------

Nasdaq -> What's Happening Here?Hello Traders and Investors ,
my name is Philip and today I will provide a free and educational multi-timeframe technical analysis of the Nasdaq 💪
Looking at the macro view on the monthly timframe you can see that at the moment the Nasdaq is retesting massive resistance of the 10+ years rising channel formation so I do expect a monthly push lower.
Just two weeks ago the Nasdaq perfectly retested the 0.382 fibonacci retracement level and created a quite strong rejection towards the upside.
Looking at the daily timeframe you can see that Nas100 is currently retesting the neckline of the double top of July of 2023 and if Nas100 actually breaks above this structure zone, I do expect new highs going into 2024.
Keep in mind: Don't get caught up in short term moves and always look at the long term picture; building wealth is a marathon and not a quick sprint📈
Thank you for watching and I will see you tomorrow!
My previous analysis of this asset:

nasdaq buy overviewnasdaq looking for buy as nasdaq took their sell side liquidity and shifted its structure ..as i mentioned on retracement it can go for buy

NASDAQ Short Term Sell IdeaH4 - Bearish trend pattern followed by a potential double wave correction.
No opposite signs.
I expect the price to move lower further in the short term until the two strong resistance zones hold.

NQ Outlook and Trade Ideas for the WeekNQ Outlook and Trade Ideas for the Week
Everything presented in the chart.
I don't want to overcomplicate it.

XAUUSD Top-down analysis Hello traders, this is a complete multiple timeframe analysis of this pair. We see could find significant trading opportunities as per analysis upon price action confirmation we may take this trade. Smash the like button if you find value in this analysis and drop a comment if you have any questions or let me know which pair to cover in my next analysis.

NQ1! NAS100USD NASDAQ 2023 AUG 28 NQ1! NAS100USD NASDAQ 2023 AUG 28
Hope you had taken Scenario 2 test of breakdown
area 15138-15511 short.
Possible scenario:
1) Continued short per possible bear flag
2) If market hits longer term support channel (black dash),
>> support = long
>> breakdown + test and reject = short
Price Reaction Levels
Short on Test and reject | Long on Test and Accept
16042 15511 14635 13960
*Longer term: 13350 support must hold for long trend to be intact.
Price/Volume/Trend Analysis:
Weekly: Higher ave vol up bar close at lower half of bar (S>D)
Daily: Ave vol up bar close toward high (D>S)
*NTC = Non-Trend Changing | PTC: Potential Trend Changing
Like and follow if you find this useful | *For education purpose only.
Have a profitable trading week.

NAS100USD Will Go Lower! Sell!
Take a look at our analysis for NAS100USD.
Time Frame: 12h
Current Trend: Bearish
Sentiment: Overbought (based on 7-period RSI)
Forecast: Bearish
The market is trading around a solid horizontal structure 14924.8.
The above observations make me that the market will inevitably achieve 14435.2 level.
P.S
We determine oversold/overbought condition with RSI indicator.
When it drops below 30 - the market is considered to be oversold.
When it bounces above 70 - the market is considered to be overbought.
Like and subscribe and comment my ideas if you enjoy them!

NASDAQ 23-08 MovePair : US100 - NASDAQ
Description :
Support Level
Completed " 1234 " Impulsive Wave
Bearish Channel in STF as an Corrective Pattern
Break of Structure
Divergence - RSI

NASDAQ RiskyRisk 0.5%
TP1 = 1:1 RR
Disclaimer:
The contents in this Idea are intended for information purpose only and do not constitute investment recommendation or advice. Nor are they used to promote any specific products or services. They serve as an integral part of a case study to demonstrate fundamental concepts in risk management under given market scenarios. A full version of the disclaimer is available in our profile description.
