DXY 103.881-105.664: Section where resistance is requiredHello?
Traders, welcome.
If you "Follow", you can always get new information quickly.
Please also click "Boost".
Have a good day.
-------------------------------------
(DXY chart)
With the DXY rising above 103.025, the investment market appears to be slowing down.
On the 1W chart, the 103.881 point corresponds to the resistance section, and on the 1M chart, the 105.664 point corresponds to the resistance section.
Therefore, the key is whether it can fall with resistance in the 103.881-105.664 area.
------------------------------------------
(SPX500USD chart)
It shows a decline below the 4419.18, the HA-High indicator point on the 1M chart.
Accordingly, the key is whether it can rise with support around 4371.6.
If not, you need to make sure it is supported around 4255.2.
-----------------------------------------------
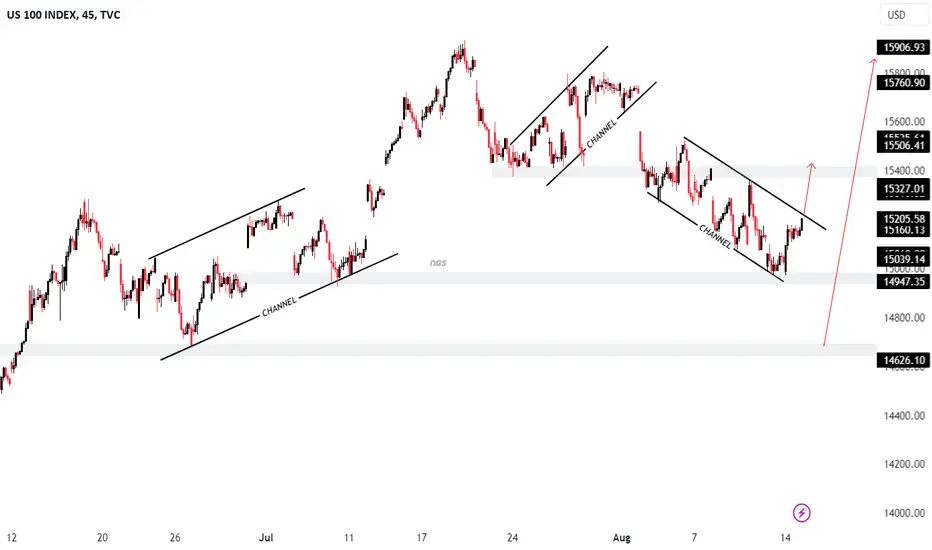
(NAS100USD chart)
The key is whether you can rise with support around 14710.6-15090.3.
If not, you need to make sure it is supported around 13418.8.
-------------------------------------------------- -------------------------------------------
** All descriptions are for reference only and do not guarantee profit or loss in investment.
** The trading volume indicator is displayed as a candle body based on 10EMA.
Display method (in order of boldest)
More than 3x 10EMA trading volume > 2.5x > 2.0x > 1.25x > trading volume below 10EMA
** Even if you know other people's know-how, it takes a considerable period of time to make it your own.
** This is a chart created with my know-how.
---------------------------------
US NAS 100

NAS100 DEMAND UPDATES
Previous idea on CPI last week its on spot.
PRice goes on, then drop like a fallen water..
Now im doubting this idea, could the market rebuy this zone or we will wait to our main/original idea before..
This is not a financial advice. Follow for more.
Give a boost if you win a trade last week until today.
Thank you.I will update this if price consolidate and has a good volume.

Nasdaq 100/US TECH Trade IdeaI think the Nas100 will descend until around 14687.2 to liquidate that area and then go long. The Idea is also supported by the trendline as it has a 3rd touch.
Note that this is not any financial advice nor am I a pro-financial adviser. Just sharing my view.

Nasdaq to continue crashing???Nasdaq had hit our first two short targets posted a week ago.
Now it is breaking what was old resistance and was holding yesterday as support.
1. If this old support once again becomes resistance then we will open an additional position as the one shown on the right.
2. If the PA is unclear we will let the current position go until it reaches our original tp and collect it's gains or it reaches our sl and we take a minor loss.

NASDAQ US100 15-08 MovePair : NASDAQ - US100
Description :
Bearish Channel in Short Time Frame as an Corrective Pattern
Break of Structure
RSI - Divergence
Demand Zone
Completed " 1234 " Impulsive Wave
Nasdaq US100 UStech NDQ100 76%w 4hr SHORT4hr Strategy 76%w 9:1 RR NDQ100 EIGHTCAP
TP 15432 1.64 avg all
TP 15349 2.19 win
Possible resistance at 15500
If 15432 is closed below at end of day, DAILY DOWN TREND CONFIRMED, NEW SHORT OPPORTUNITY

Nas100 M30Prices has tested my rb-trade zone
Looking for price to reject targeting 150points on the US-Open
BUY LIMIT -15000
TP 15150 🔥

The key is whether DXY can find resistance around 102.034Hello?
Traders, welcome.
If you "Follow", you can always get new information quickly.
Please also click "Boost".
Have a good day.
-------------------------------------
(DXY chart)
The key is whether it can get resistance around 102.034 and drop.
----------------------------------------
(SPX500USD chart)
The HA-High indicator on the 1W chart is about to form at point 4478.4.
Therefore, it is important to be able to ascend with support near this point.
If not, you need to make sure you get support around 4419.8.
-------------------------------------------
(NAS100USD chart)
The HA-High indicator on the 1W chart is about to form at 15379.1.
Unlike the SPX500USD chart, NAS100USD is located below the HA-High indicator point of the 1W chart, which is about to be created, so it seems to fall more than expected.
So, the question is whether it can rise above 15379.1.
If not, you should check for support around 14710.6.
-------------------------------------------------- -------------------------------------------
** All descriptions are for reference only and do not guarantee profit or loss in investment.
** Even if you know other people's know-how, it takes a considerable period of time to make it your own.
** This is a chart created with my know-how.
---------------------------------

Nasdaq -> -20% Massive Drop Ahead!Hello Traders and Investors ,
my name is Philip and today I will provide a free and educational multi-timeframe technical analysis of Nas100 💪
Looking at the macro view on the monthly timframe you can see that at the moment the Nasdaq is retesting massive resistance of the 10+ years rising channel formation so I do expect a monthly push lower.
With the recent strong rally on the Nasdaq it is quite likely that we will see at least a retest of the 0.382 weekly fibonacci retracement level which is then maybe acting as a first strong support area.
My last analysis on the Nasdaq perfectly played out with the Nasdaq breaking below the daily bullish trendline and creating a double top in the process - therefore everything is currently looking quite bearish and I do expect more daily downside.
Keep in mind: Don't get caught up in short term moves and always look at the long term picture; building wealth is a marathon and not a quick sprint📈
Thank you for watching and I will see you tomorrow!
My previous analysis of this asset:

NAS sell on US session?PEPPERSTONE:NAS100
Hey, today with something special
This idea will be ICC based so lets get into it
How u can see trade from yesterday on nas was 0 drawdown so hope today will be same
For valid trade price cant go over last high whats around 15230.
Then we want to see break of last low and close candle under it
SL can be on last high. For TP1 we will be reaching last low (15100) candle close (15080) wick
Around this zone we can close partials or watch what price do, if we break under we can hold until new low will be made
Just wait for US Session
I took 2 trades like this on nas with high reward so i hope nas make the same move even when i share it with you.
Shoutout to SCI

Short to Medium Term Key Levels for NAS100 (PMLs)These are my short to medium term key PMLs (Price Magnet Levels) for NAS100

NAS100/NASDAQ HIGHER TIMEFRAME CONTEXTThe CPI is hotter than your girlfriend today, so keep me driving this idea, wether it goes higher first.
But whatever the prints on CPI, im expecting light rally @15370 zone before it ripped down below.
And if the 15080 zone would break again, Im expecting the previous support could break too.
14950 can still have a light rally but still bearish until the 14600 zone before it goes backup. to the break trendlines.
SO basically my view is wait below for a buy atleast at 14600 zone.
FOr swing traders wait for a CPI print or follow the line base on resistance zone 15380-15400
that would be my watch zone ..
Thank you for the support follow for more.
This is not a financial advice.
Swing traders only......

US NAS 100OANDA:NAS100USD has been trending upside.
The take profit could be 16563.9
After this 16563.9 is reached. I suspect that it will start to
enter the BEARISH Markets.
It could go as far as 10505.33

NAS100USD Is Very Bullish! Long!
Please, check our technical outlook for NAS100USD.
Time Frame: 1D
Current Trend: Bullish
Sentiment: Oversold (based on 7-period RSI)
Forecast: Bullish
The market is testing a major horizontal structure 15355.0.
Taking into consideration the structure & trend analysis, I believe that the market will reach 15932.6 level soon.
P.S
Please, note that an oversold/overbought condition can last for a long time, and therefore being oversold/overbought doesn't mean a price rally will come soon, or at all.
Like and subscribe and comment my ideas if you enjoy them!

NQ1! NAS100USD NASDAQ 2023 AUG 07
NQ1! NAS100USD NASDAQ 2023 AUG 07
Last week, Short from 15904 resistance was good.
On weekly TF, market has closed below trend line.
Watch market's reaction to the trendline.
Possible Scenarios:
1) Short on retracement / rejection of 15511 level
2) Market does a spring and returns into rotation (grey box area), and target
can be 50% of rotation range, or trial to upper boundary of rotation
Price Reaction Levels
Short on Test and reject | Long on Test and Accept
16029 - 15904 15511 15118
*Longer term: 13350 needs to be supported for long trend to be intact.
Price/Volume/Trend Analysis:
Weekly: NTC Ave vol down bar, and bar also closed below weekly trendline
Daily: NTC ave vol down bar | Lower High
*NTC = Non-Trend Changing | PTC: Potential Trend Changing
Like and follow if you find this useful | *For education purpose only.
Have a profitable trading week.

The key is whether DXY can fall below 102.034Hello?
Traders, welcome.
If you "Follow", you can always get new information quickly.
Please also click "Boost".
Have a good day.
-------------------------------------
(DXY chart)
It rose above 102.034 over the volatility period.
So, on the big picture, we need to see which way it deviated from the 102.034-105.873 range.
As a small picture, we need to see which way it deviates from the 102.034-103.494 interval.
For the investment market to be active, it needs to move sideways below 102.034.
(SPX500USD chart)
If it holds above 4419.8, it is expected to renew the new high (ATH).
The next volatility period is around August 15-22.
(NAS100USD chart)
If it holds above 15090.3, it is expected to renew the new high (ATH).
The next period of volatility is around August 17th.
-------------------------------------------------- -------------------------------------------
** All descriptions are for reference only and do not guarantee profit or loss in investment.
** Even if you know other people's know-how, it takes a considerable period of time to make it your own.
** This is a chart created with my know-how.
---------------------------------

NAS100 UPDATES
aLMOST stopout ..
Patience is the key to success.
Trading without patience is like giving free money to your brokers.
now im expecting the previous high drops could breaks, I called it stophunt zone.
This is not a financial advice, use stoploss for better trading.
Follow for more.

Trade idea NQ Nasdaq100 Future on 55mThis is the result of my analysis about the 55m chart possible price action develepement. Just an idea, nothing seriouse. Worth to monitor ;) Pls leave a like when it worked out
Das ist das Ergebnis meiner Analyse über den 55m Chart mögliche Preisentwicklung. Nur eine idee, nichts gravierendes. Wert, im Auge zu behalten ;) Bitte liken wenn es gefällt


Nasdaq -> Please Look At The Odds!Hello Traders and Investors ,
my name is Philip and today I will provide a free and educational multi-timeframe technical analysis of Nas100 💪
After the Nasdaq perfectly retested the monthly 0.618 fibonacci retracement, previous monthly support and also broke above a clear bearish trendline, we had a solid rally of roughly 20%.
With the Nasdaq now retesting the next weekly resistance at the $15570 level I do expect a short term rejection again away from the resistance but then eventually the creation of new all time highs on the technology index.
Looking at the obvious rising channel on the daily timeframe you can see that on Friday the Nasdaq once again rejected support and there is in my opinion currently a 50% chance that we will still see a major correction but objectively looking at the index there is no sign of weakness yet.
Keep in mind: Don't get caught up in short term moves and always look at the long term picture; building wealth is a marathon and not a quick sprint📈
Thank you for watching and I will see you tomorrow!
My previous analysis of this asset:

NAS100A reference only, This is not a financial advice.
You can trade it with proper stoploss.
Trade base on your own decissions.

NAS100/NASDAQHello Traders and followers.
This idea are approaching on demand zone. before we goes up. but my advice is look on confirmation of volume or higher timeframe buy setup.
This is not afinancial advice you can follow for more.
we might see 16300 nasdaq price soon,

NDX (Nasdaq 100) Index Analysis 05/01/2021Fundamental Analysis:
As we can see the Index has shown a very strong come back after the Covid-19 pandemic of March 2021 which caused the market to fall and create a panic to the world.
Since then there are lots of changes to the world and the way companies are operating, such as releasing of their premises and offices as they should have discharge lots of their employees and the work from home schemes was the main reason to cut the expenditure of these companies drastically down.
From the other hand, the market administration and governments including Banks has injected lots of funds and so called Rescue Packages and the market stimulant's packages to protect the Market from its Hard and Drastically fall to the lower levels and prevent a gigantic Global Markets Crises.
These funding and injection of the cash to these companies along side of cost and expenditure reduction due to their risk measurement policies, forced these companies to invest the receiving funds in to the companies assets to protect themselves from the Pandemic Crises and hedged their exposed risks instead of investing these funds to the new Projects or renovations which could Couse their Share prices to appreciate intrinsically but instead these investments in the assets made an inflation to the prices of the assets and created a bobble in their share value and Prices without having any inheritance or intrinsic values.
so we can easily have a decision derived from the current situation that there has to be an other market fall and crises soon so the Price and its relevant intrinsic values get converged and market comes to its correct values.
we can observe the same situation in many different centralized markets such as US500 and even other Stock Exchanges around the world like London and rest European market places to be in the same inflated status.
there exist a huge chance of an other Global Market Crises coming soon which has the domino effect and Couse the entire markets to fall for some times .
This fall of the market shall remove off the liquidity from the equity and debt market and streamflow them to some green heaven Asset classes including Gold and silver or even newly invented Technologies such as decentralized markets and Cryptocurrencies and DeFi.
if we have a look at the Current crypto's Total Crypto Market Capitalization we can see it has a very good chances of Rally Continuation to some very high levels such as 5 to 6 Trillion dollars or even much higher.
Total Market Cap of All Cryptocurrencies:
Gold even can see higher Prices such as 2500 USD per ounce which is currently ranging at 1800 USD.
we even can some how speculate a 3 world War to be the initiator of this Market fall which is even not so far from the reality as the situation in middle east is not very stable due to the Iran and Israel disputes and new anti-covid's restriction social movements in Europe and America continent.
we can see the same situation in US500:
DJI:
we shall analyze few other markets and indices and ultimately Propose some Assets which are at their low Points Currently and can be counted as under values at present times.
Technical Analysis:
we have used the Fibonacci trend base extension from the low to the Highest point even before the Covid pandemic to have a better vision of the Higher expansion levels for the post retracement's rallies and identify the Potential Price levels and resistance zones. where the market can show some stagnation and starts its retracement and price correction to the lower levels.
the Fibonacci trend base extension clearly shows that the price has touched the 261.8% which is a very critical point for the price to find its intrinsic values and correct its self by retracing to the lower levels which can be the parallels leg areas of the same Fibonacci extension levels, before its rally to the higher targets.
There exist a Bearish Divergence of Price and MACD where Price has made higher high levels but MACD made lower Highs which is the most significant and strong Bullish Trend Reversal and start of Market fall and Price retracement and Value corrections.
there are total of 2 Targets defined which have a very strong Support tendencies which can be interpreted as the maximum retracements points.
there are few support level are also defined to have a better vision of the bullish trend reversal to bearish retracements which eventually can be counted as the bearish Trend reversal points and new cycle initialization.
