QQQ: Looking Out for a 20-40% Pull BackThe NASDAQ100 is currently sitting at the 0.886 and 1.618 PCZs of big Bearish Shark and Bearish Butterfly patterns as the indicators hover around the overbought zones; we don't exactly have much confirmation yet that these PCZs will hold, but it seems like it wouldn't be a bad idea to position against the QQQ early on via some SQQQ monthly calls and perhaps getting Bearish on some of the top stocks within the index such as NVDA, TSLA, and MSFT.
Being conservative, I will only be looking for it to come back to the common Fibonacci Retracement zones below, but it's also possible that this ends up being a macro top; for the time being, that doesn't really matter because as of right now, it looks quite Bearish.
On a side note, the VIX also looks like it's been preparing to spike up for a few months now and the targets for such a spike are pretty massive, as seen here:
US NAS 100

Sniper Trading System EXPLAINEDIf you do not have a system that's calibrated to the code that's generated on the 1 sec time frame you will always find yourself guessing and never really KNOWING.
My System is calibrated down to the 1 second time frame where the money aka code is generated. What I discovered is: if you can find the KEY to the Daily bias you have a considerable EDGE in the market.
I found that key and it is found in the 12AM Candle. This candle lets a Sniper Know where the raid will go before the main move aka Trend of the day.
In this trade on NAS 100 ( my system works on everything) the 12 AM told me that the raid would be Bullish after 1AM. So we anticipate the short during one of our Clearing House Times - when the algorithm seeks Liquidity aka Raids your Stops.
Today we got the drop at 8:30am EST. 1st TP SMACKED. 2nd TP KISSED as of now and headed to target.
The VIX is due for a rebound so NAS100 may continue to fall this week.

NASDAQI Also Want To See The Nasdaq Trading Lower This Week, They Can Trade Up To Take That H4 Liquidity Above That High.
Or They Can Run Out Today's Lunch Hour Highs Then Sell Off
Do Remember To Use The S&P500 And The Dow Jones Index For SMT Divergence.

NAS100USD Technical Analysis! SELL!
My dear subscribers ,
Please, find my technical outlook for NAS100USD below:
The instrument tests an important psychological level 15625.5
Bias - Bearish
Technical Indicators: Pivot Points High anticipates a potential price reversal.
Super trend shows a clear sell, giving a perfect indicators' convergence.
Target - 15412.4
Recommended Stop Loss - 15747.3
About Used Indicators:
Pivot points are a great way to identify areas of support and resistance, but they work best when combined with other kinds of technical analysis
———————————
WISH YOU ALL LUCK

NAS100USD Is Bearish! Sell!
Please, check our technical outlook for NAS100USD.
Time Frame: 6h
Current Trend: Bearish
Sentiment: Overbought (based on 7-period RSI)
Forecast: Bearish
The market is on a crucial zone of supply 15562.6.
The above-mentioned technicals clearly indicate the dominance of sellers on the market. I recommend shorting the instrument, aiming at 15291.4 level.
P.S
Overbought describes a period of time where there has been a significant and consistent upward move in price over a period of time without much pullback.
Like and subscribe and comment my ideas if you enjoy them!

Nasdaq -> New All Time Highs Before 2024Hello Traders and Investors ,
my name is Philip and today I will provide a free and educational multi-timeframe technical analysis of Nas100 💪
After the Nasdaq perfectly retested the monthly 0.618 fibonacci retracement, previous monthly support and also broke above a clear bearish trendline, we had a solid rally of roughly 20%.
With the Nasdaq now retesting the next weekly resistance at the $15570 level I do expect a short term rejection again away from the resistance and considering the overextended weekly timeframe, this scenario becomes even more likely.
The daily timeframe however is still super bullish - the Nasdaq just broke out of an ascending triangle formation so I will definitely need some shift back to a bearish market before I then do expect a short term daily drop.
Keep in mind: Don't get caught up in short term moves and always look at the long term picture; building wealth is a marathon and not a quick sprint 📈
Thank you for watching and I will see you tomorrow!
My previous analysis of this asset:

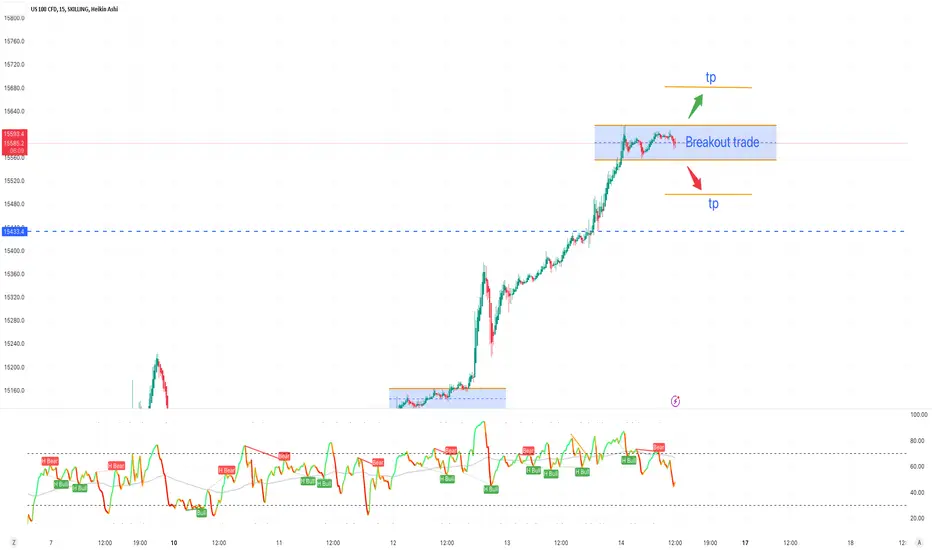
NASDAQ Breakout Trade PlanNASDAQ moving in range now wait for breakout to trade or place your buy stop and sell stop.
Manage risk according to your account size.
Nasdaq Index (US100): More Growth is Ahead
NASDAQ Index broke and closed above a neckline of a cup and handle pattern
on a daily, following the yesterday's CPI report.
Taking into consideration, that the index is trading in a strong bullish trend,
that violation will most likely trigger a strong bullish wave.
I will expect growth to 15600.
For entries, consider an occasional retest of a broken neckline.
❤️Please, support my work with like, thank you!❤️

Nasdaq's Rebalancing of Fabulous 7 Tech Stock so CautionRecent news concerns Nasdaq's decision to rebalance its equal weighting for the Fabulous 7 tech stocks. While this may seem like a routine adjustment, I urge you to exercise caution and remain skeptical about future stock returns and performance.
It is no secret that the Fabulous 7 tech stock has been the talk of the town lately, capturing the attention of investors worldwide. Its remarkable growth and seemingly unstoppable momentum have undoubtedly piqued the interest of many. However, as seasoned traders, we must be aware of the hype and excitement surrounding these stocks.
Nasdaq's decision to rebalance the equal weighting of the Fabulous Seven tech stock raises concerns and warrants a closer examination of the situation. Why would such a move be necessary if everything was going swimmingly? It is essential to question the motives behind this adjustment and consider its potential implications on the stock's performance.
While rebalancing can be a regular part of market operations, it often signifies a shift in the underlying dynamics of a stock. It is crucial to remember that past performance does not guarantee future success. The Fabulous Seven tech stock's meteoric rise may have been impressive, but more is needed to ensure continued growth or prosperity.
As traders, we must remain vigilant and not mindlessly follow the crowd. While the Fabulous Seven tech stock has undoubtedly provided lucrative opportunities in the past, it is crucial to approach future investments with a healthy dose of skepticism. We must carefully analyze the potential risks and rewards, considering the rebalancing decision and its impact on the stock.
In conclusion, please proceed cautiously regarding the Fabulous Seven tech stock and any future investments. Nasdaq's rebalancing decision serves as a reminder that the market can be unpredictable and subject to sudden changes. Let us remember the importance of conducting thorough research, diversifying our portfolios, and making informed decisions based on careful analysis.

NASDAQNASDAQ PM SESSION TRADE SETUP, This Is Basically What I Think May Happen But Price Can Still do Otherwise As It Is Currently Bullish, This down move would a retracement if it isn't yet complete which I think it isn't.

The possibility of creating a new trend is increasing(long-term)Hello?
Traders, welcome.
If you "Follow", you can always get new information quickly.
Please also click "Boost".
Have a good day.
-------------------------------------
(DXY chart)
The question is whether DXY can move sideways below 102.034.
This is because if DXY falls below 102.034 and moves sideways, the investment market is expected to pick up.
Therefore, it is necessary to check whether it is sideways in the 97.401-102.034 section.
---------------------------------------
(SPX500USD chart)
The next period of volatility is around July 24th.
Therefore, it is necessary to see which direction the 4419.8-4447.7 section will be heading through this period of volatility.
If it rises above 4447.7, it is expected to rise around 4588.6-4654.0.
A decline below 4419.8 would expect a decline around 4310.8-4351.1.
(1M chart)
It rose above the HA-High indicator on the 1M chart as it rose along the upward trend line at the bottom.
A rise from support on the HA-High indicator increases the likelihood of a break from the previous high.
So, the question is whether it can rise above 4588.6.
If you do not receive support at the HA-High indicator, there is a high possibility that it will fall to the vicinity of the HA-Low indicator, so you need to think about countermeasures.
Currently, the HA-Low indicator on the 1M chart is located at 909.3.
Therefore, as the SPX500 Index falls, the HA-Low indicator on the 1M chart is expected to rise and be created.
When the HA-Low indicator is touched, it is expected to create a new trend.
(1W chart)
It rose above the HA-High indicator on the 1W chart, showing a rise above the first previous peak.
We need to see if we can break the 2 previous highs in the future.
So, the question is whether it can rise above 4447.7.
If it doesn't and falls below 4351.1, you should check for support near 4116.0-4169.6.
Since a sharp rise channel has been formed, I think the important point to watch is whether it can rise along this channel or break out.
In that sense, the 4351.1-4447.7 section is an important support and resistance section.
-------------------------------------------------- ------
(NAS100USD chart)
(1M chart)
Unlike the SPX500USD chart, the NAS100USD chart is formed with the HA-Low indicator of the 1M chart rising.
Therefore, it is important to be supported and able to rise near the HA-High indicator on the 1M chart.
If not and it is resisted by the HA-High indicator, it is expected to create a new wave.
Therefore, the point to watch is whether it is rising or falling based on the 14710.6 point.
This is because the current HA-Low and HA-High indicators are for the beginning of a downward wave.
(1W chart)
As it rose above the HA-High indicator on the 1W chart, it is showing a sideways trend near the second previous peak.
Therefore, the key is whether it can show a rise above 15448.6.
Since the StochRSI indicator is trending lower, the possibility of entering the oversold zone is increasing.
If it enters and exits the oversold zone and shows support around 14328.9-14743.2, it is expected to rise above 15448.6.
(1D chart)
It is showing a steady upward trend while raising the HA-High indicator on the 1D chart.
It is currently moving sideways around the 15090.3 point of the HA-High indicator on the 1M chart.
The next period of volatility passes around July 26th and we need to see if it can rise above 15448.8 or if it falls around 14710.6.
--------------------------------------------------
as a result,
1. It is important that the DXY chart stays below 102.034.
The DXY Dollar Index chart shows the correlation between the US dollar and six other currencies (EUR, JPY, GBP, CAD, SEK, CHF), so if it moves sideways in the appropriate range (97.401-102.034), the international investment market will Because it's expected to be lively.
2. If you look at the SPX500USD and NAS100USD charts, they are located in an important section (HA-High on the 1M chart).
I think the possibility of renewing a new declared price (ATH) is increasing.
However, if there is no support in this critical area, the possibility of a new downtrend is also increasing, so careful and quick judgment is needed in trading.
Therefore, it is important to check whether there is support or resistance at the point or section mentioned in the chart description of SPX500USD and NAS100USD.
-------------------------------------------------- -------------------------------------------
** All descriptions are for reference only and do not guarantee profit or loss in investment.
** Even if you know other people's know-how, it takes a considerable period of time to make it your own.
** This is a chart created with my know-how.
---------------------------------

NAS100 and US30 Top-down analysis Hello traders, this is a complete multiple timeframe analysis of this pair. We see could find significant trading opportunities as per analysis upon price action confirmation we may take this trade. Smash the like button if you find value in this analysis and drop a comment if you have any questions or let me know which pair to cover in my next analysis.

NAS100 Potential DOWNSIDEHi TRADERS , Nas100 gave us a couple of confluences, first by forming an "M" Double Top to Forming Head & Shoulders. Now lets wait for the final confirmation a break on the support, Please use proper RM

This is the week where new changes in the 1W chart beginHello?
Traders, welcome.
If you "Follow", you can always get new information quickly.
Please also click "Boost".
Have a good day.
-------------------------------------
(DXY chart)
The 102.034-105.873 section is a boundary section, and a trend is expected to form only when it breaks away from this section.
-----------------------------------------
(SPX500USD chart)
After passing through the volatility period around June 26th, it continues to rise.
It is necessary to confirm what changes will appear as the volatility period around July 11th passes.
Point 4419.8 is the point of the HA-High indicator on the 1M chart, so if support is confirmed near this point, it is expected to rise to around 4588.6.
If it finds resistance below 4419.8, it should check for support near 4255.2-4310.8.
-----------------------------------------------
(NAS100USD chart)
With support near 15090.3, I expect it to rise around 15978.3.
Accordingly, the 14710.6-15090.3 section is an important support and resistance section.
Yesterday, I talked about how to interpret the CCI index.
In that sense, the 1W chart shows that the CCI indicator has entered the overbought zone.
Accordingly, it can be interpreted that whether it is supported or resisted around 15090.3 has an important meaning.
The next period of volatility is around July 26th.
The StochRSI indicator on all charts has entered the overbought zone, indicating strong uptrend.
In this sense, it can be seen that the section 14710.6-15090.3 is an important section.
-------------------------------------------------- -------------------------------------------
** All descriptions are for reference only and do not guarantee profit or loss in investment.
** Even if you know other people's know-how, it takes a considerable period of time to make it your own.
** This is a chart created with my know-how.
---------------------------------

NFP NASif 15100 holds we can see a nice move to the down side tapping into that 4hr order block and buy side liquidity around 14900
now if 15100 doesn't hold we can see a move up to clear the remaining sell side liquidity around 15160 -15220
im short side biased at the moment a break of 15050 should open the door for a nice move down to those both of those green lines if no break i wouldnt enter waiting on confirmation but keep a eye on this trade safely its NFP

Short the NasdaqWas charting TQQQ so will just use this chart. I am -2% on a small SQQQ position but adding here. Arguably a double top. If it gets out of that channel possible violent drop I dont want to have to catch. 50% position, will add if we go up. Stops at acceptable loss. Not advise.

Nasdaq -> Plain And SimpleHello Traders and Investors ,
my name is Philip and today I will provide a free and educational multi-timeframe technical analysis of Nas100 💪
After the Nasdaq perfectly retested the monthly 0.618 fibonacci retracement level and also broke above a clear bearish trendline, we had a solid rally of roughly 20%.
Weekly market structure on Nas100 is pretty clear with the Nasdaq retesting previous weekly resistance which is now acting as resistance once again and with the Nasdaq being overextended there is a higher chance that we will see a short term correction.
The Nasdaq is also currently once again retesting daily resistance from which we already broke structure towards the downside so I simply do expect another bearish wave from here.
Keep in mind: Don't get caught up in short term moves and always look at the long term picture; building wealth is a marathon and not a quick sprint 📈
Thank you for watching and I will see you tomorrow!
My previous analysis of this asset:

NAS100USD LongOANDA:NAS100USD
The trendline is broken and the pullback is completed. I expect the price to grow up to the specified areas. what's your opinion?

Nasdaq -> Preparing The Bearish WaveHello Traders,
welcome to this free and educational multi-timeframe technical analysis.
On the weekly timeframe you can see that Nas100 just retested and already started to reject the major previous weekly structure zone at the psychological $15.000 level.
You can also see that Nas100 retested the resistance of the very bullish rising channel, the next support would be the 38.2% fibonacci retracement level at the $14.000 zone so I am just waiting for more bearish pressure and then I do expect more upside potential.
On the daily timeframe you can see that Nas100 finally broke structure towards the downside with Monday's candle so this is a sign that Nas100 is actually slowing down - I do expect another push lower to retest daily support at the $14.300 level and then I do expect a first bullish rejection.
Thank you for watching and I will see you tomorrow!
You can also check out my previous analysis of this asset:

NAS100 14800 Bullish BounceLook for NAS100 buy limits around 14800 area. Take profit should be around 200-1,000. However, looking for NAS100 to touch 15800 from 14800 area possibly.

AI boost US mega caps - Nasdaq, Russell 2000 Left in the ColdTech Surge: AI Stocks in the Limelight
The performance of US stocks in the AI sector has been nothing short of remarkable, with over $3 trillion added to its market cap since the final quarter of 2022. The upward trend suggests further potential growth despite a broadly stable or mildly declining US stock market outside the US Megatech sector. The enduring climb of these stocks underscores the market's conviction in AI as a lasting, transformative force rather than a transient phenomenon. The US tech landscape had undergone a significant shift from a bleak outlook six to twelve months ago when technology was deemed insignificant, as currently, AI dominates the scene.
The Tech Surge vs. Small Businesses: The Gap Widens
The current market showcases a divide between big tech and smaller enterprises, with capital flows favoring the former. Coupled with potential deflation, this rift could intensify the struggles of smaller businesses. The thriving AI sector doesn't necessarily imply a positive outlook for smaller companies unrelated to AI in the upcoming 6-12 months. Acknowledging AI's transformative potential across industries like robotics, 3D printing, and crypto is vital. Even though a short-term crisis and job loss are on the horizon, the looming recession could present opportunities for buying cheap assets. In this unique period, reminiscent more of the 1940s and 1990s than the 2000s or the 1970s, a broader perspective, adaptability, and a positive mindset are necessary.
Price action: Is the top near?
Based on the Nasdaq 100 vs. Russell 2000 ratio, it's doubtful that the top is in. As you can see on the main chart, it's possible that a short-term top could be in, as NDX just filled a gap while sweeping several highs in the 14200-14300 area. However, this isn't the 2000s; this tech is more transformative. The world is ready to adopt it, and that's why ChatGPT was the fastest-adopted technology ever. Now the top 10 us tech companies have the best workforce, hardware, data, and customer base for AI; that's why they are leading the way, and they are unlikely to go down any time soon. That's confirmed by the ratio between NDX and RUT, which seems to have formed a massive cup and handle pattern that's about to break out. Maybe the current rally slows down a bit, but it's not impossible to see it accelerate rather than decelerate.
The S&P 500 seems to be at least 1% higher until it hits the next resistance, but my key target has been 4350 for a long time.
Once it hits it, a more substantial correction could come, even though I think it would take the SPX to 4000 at best. As for Russell 2000 looks very weak, and I think it will sweep its double bottom and fill the critical gap lower.
Sentiment remains bearish
For many months, on Tradingview and Twitter, I've been talking about how bearish people are, how inflation is coming down, liquidity is trending higher, and so on... yet nobody wants to hear about it. Everyone wants to talk about the ongoing or upcoming recession, and they consider AI a fad. Even after this move higher, sentiment hasn't changed, and it's getting more bearish, with people trying to short the rally, as they are angry for missing the boat. We can see that in CoT data, we can see on Twitter polls, and I can see it based on what people say on social media.
Potential strategies
In my opinion, it is either best to ride the trend with a small position and a wide-stop loss or wait for the market to hit key resistance, and either potentially short there if sentiment flips bullish or wait for the pullback and then go long.
Although the long Nasdaq short Russell trade could have some juice left in the short term (very bullish long term), I wouldn't rush to put that trade on, as the Russell could play catch up (in the short term), as we see traders/investors diversify as they take profits from their tech stocks. These stocks are cheap and seem more 'hated' than those US mega caps.
Higher interest rates and shrinking liquidity significantly affect small caps, and their situation could deteriorate. It's clear we are either in a recession or about to enter one, and these stocks have the most to lose. Therefore, once these stocks rally, especially if they outperform NDX, consider entering a long Nasdaq - short Russell trade. This trade might not work only if many large countries start banning those companies and their products or if the US starts attacking them for being too large. Until then, the ratio has higher to go.

Global DOW, SPY, NAS Support CorrelationThe 24 hour US stock indices have a solid correlation and showing you where buy support is.
The top chart is the US30USD.
The middle is the SPX500USD.
The bottom is the NAS100USD.
Since these charts trade 24 hours a day 5 days a week there never is a gap to deal with messing your oscillators.
There is a term I like to use called "No Man's Land". It includes all areas of a Moving Average Oscillator that don't connect to some form of support trend line or resistance trend line.
Don't trade in those areas. Look for support and resistance and set alerts so you can trade at those key points. We are hunters not killers. Hunters still fail, but hunting at key points allows you to set tight stop loss and move on to the next hunt. If you get stuck in "No Man's Land" then you have to decide to wait and hope support or resistance gets tested and works in your favor. That is not fun to feel and makes you emotional. Things can always reverse due to unexpected fundamentals. If that happens, be patient and start hunting the possible next support trend line or resistance trend line. And slowing down your lookbacks is vital to learning the bigger picture of things. Just because the preset value for RSI is 14 lookback. Doesn't mean you can't use other numbers. Fib numbers open up doors you've never seen. Good luck hunting

NAS100 Resistance ConfirmationPrice confirmed our resistance zone and formed double top as a reaction. Price then broke the neckline and also bullish trendline. We can see retest of a neckline and bearish continuation. Currently, price is testing previous high and I advise you to wait for a reaction.
