2025.05.16 nasdaq analysis
This is the briefing result for Nasdaq as of yesterday.
The briefing began during the yellow box phase.
At that time, I clearly mentioned that the market had entered a short-term correction phase and emphasized the importance of the 21187 support level marked by the red box.
As seen in the chart, the 21187 level was not broken to the downside and instead held as support, followed by a rebound.
This reaffirms the significance of the 21187 level.
Afterward, the trend continued upward.
Looking at the 15-minute chart, there have been consistent lower wicks breaking below support,
which decreases the reliability of a short opportunity simply from a trendline break.
At this point, the trust in a sell-off purely based on trendline breakdown is weakening.
This chart outlines a short-term sell strategy.
As previously mentioned, while the short-term uptrend line has become less reliable,
if we see a break of the trendline and a drop below 21376,
we could expect a pullback toward the blue box area around 21320~21300.
Thus, a short-term short strategy may be valid in this scenario.
From a daily chart perspective, Nasdaq closed with a green candle again,
but the shape of the candle resembles a doji with similar upper and lower wicks.
What we need to focus on here is that Nasdaq has re-entered a high-volume price area (supply zone),
but since no clear direction has formed, many positions seem to be closed off whenever the price pushes higher.
On the downside, since the 21187 support level has held,
this remains the most critical level.
If 21187 is broken downward, it could mark the beginning of a daily-level correction phase.
Conclusion:
No clear direction yet.
While the direction was upward until yesterday, the doji close suggests caution.
For further bullish movement, a confirmed close above the current supply zone is essential.
If the market corrects downward, watch for a break below 21187.
The current price action is forming a channel pattern with higher lows and higher highs.
If traded correctly within this range, good opportunities may arise.
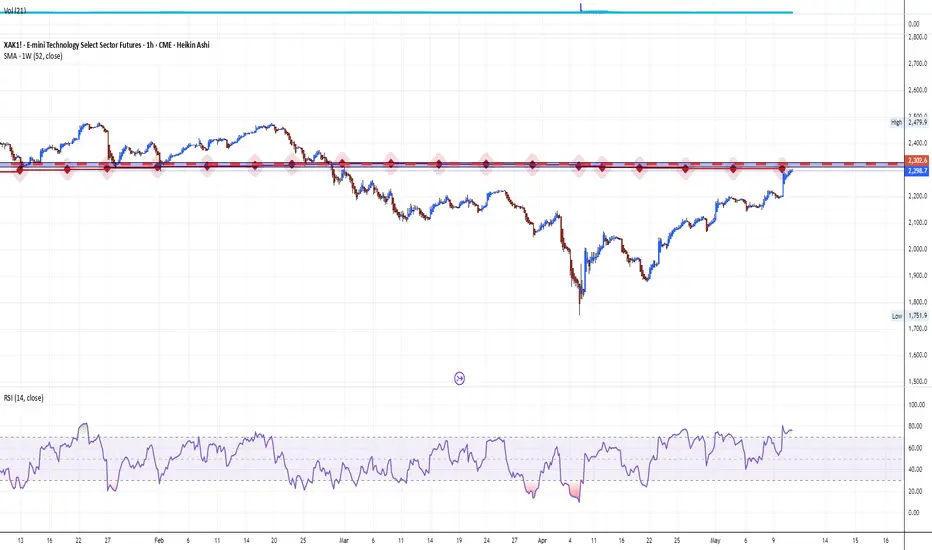
US NAS 100

US Technology Stock Sector. The Underpressured PathThe recent reduction of tariffs under former President Trump's administration, while intended to ease trade tensions, has had several negative impacts on the U.S. technology sector, particularly in 2025.
Increased Costs and Supply Chain Disruptions
Despite some tariff reductions, the overall tariff environment remains highly volatile and complex. Many tariffs on tech products, especially those involving China, remain elevated-up on Chinese-made smartphones and other electronics. This has significantly increased manufacturing costs for U.S. tech companies reliant on global supply chains, particularly those sourcing components or assembling products in China, Vietnam, and other Asian countries.
The tariffs have disrupted supply chains, forcing companies to reconsider production locations and logistics. Many firms are shifting production away from China to countries like India or Vietnam to mitigate tariff impacts, but this transition is costly and slow. Reshoring semiconductor manufacturing to the U.S. is challenging due to high labor costs and lack of skilled workforce, which means higher prices for end products like AI-enabled PCs and servers are expected.
Suppressed Consumer Demand and Market Uncertainty
Higher tariffs translate to increased retail prices for consumer electronics, reducing demand. For example, smartphone prices have risen, leading to weaker consumer sentiment and slower sales growth. This is particularly harmful in a sector where rapid innovation and high sales volume are critical for profitability and investment in new technologies.
The uncertainty caused by fluctuating tariff policies has also led to delayed purchasing decisions by enterprises and consumers. Companies are hesitant to invest in new hardware or AI infrastructure due to unclear future costs and potential further tariff changes. This delay threatens technology roadmaps and weakens the U.S. tech sector's competitiveness globally.
Impact on Innovation and Investment
Tariffs have broader implications beyond immediate cost increases. By fragmenting markets and increasing operational costs, they reduce incentives for innovation. Companies face pressure to duplicate investments or abandon certain markets, which slows technological progress and reduces the U.S.'s ability to maintain leadership in emerging fields like AI and advanced semiconductors.
The increased costs and uncertainty have also dampened investment in U.S. tech infrastructure. Although some companies like TSMC and Apple have announced U.S. manufacturing investments to offset tariff impacts, these efforts are insufficient to counterbalance the negative effects fully. The long lead times and capital intensity of building semiconductor fabs mean that reshoring will not provide a quick fix.
Economic and Strategic Risks
The tariffs contribute to broader economic risks, including potential recession, inflation, and job losses in the tech sector and related industries. CEOs across sectors have expressed concerns about the tariffs leading to economic downturns, higher prices, and layoffs. The tech sector, being highly globalized and interconnected, is particularly vulnerable to these macroeconomic shocks.
Moreover, the tariffs strain U.S.-China relations, a critical factor in global tech supply chains and innovation ecosystems. Retaliatory tariffs from China and other countries further complicate market access for U.S. tech firms, reducing their export opportunities and competitiveness.
Conclusion
In summary, the recent tariff reductions under Trump's policy have not fully alleviated the negative impacts on the U.S. technology sector. Elevated tariffs continue to raise manufacturing costs, disrupt supply chains, and suppress consumer demand. The resulting uncertainty delays investments and innovation, while economic risks and strained international relations further threaten the sector's growth and global standing. These factors collectively undermine the competitiveness and future prospects of the U.S. tech industry.
Technical challenge
The main technical graph for US Technology Sector Futures CME_MINI:XAK1! (cost-adjusted modification) still remains under key resistance of 52-week SMA, which indicates on further possible bearish pressure.
--
Best wishes
@PandorraResearch Team
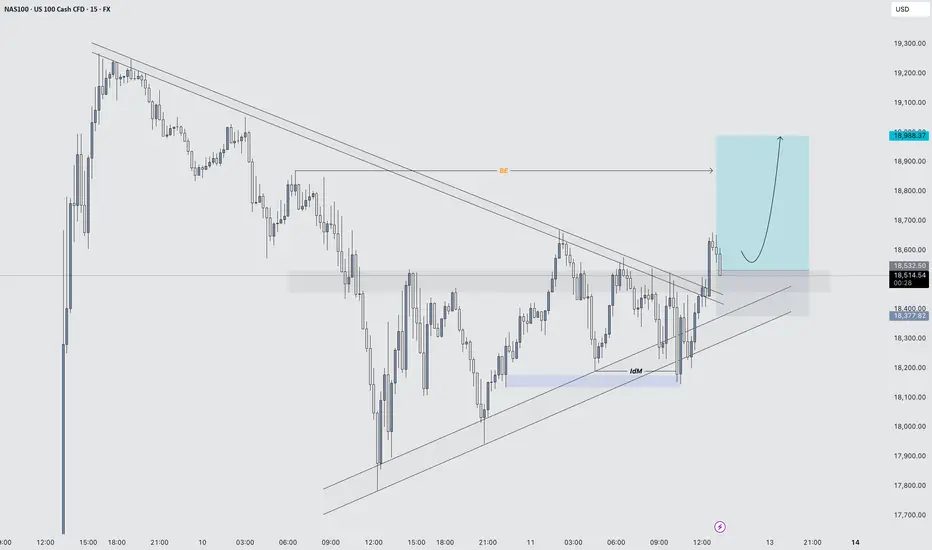
Stock Markets Rise Amid US–China Trade Deal ProgressStock Markets Rise Amid US–China Trade Deal Progress
As the chart shows, the Nasdaq 100 index (US Tech 100 mini on FXOpen) formed a bullish gap at Monday’s market open and, as of this morning, is trading at its highest level since early March.
This is driven by the announcement from the Trump administration of progress in securing a trade deal with China, following weekend negotiations held in Switzerland. Treasury Secretary Scott Bessent described the two-day talks with Chinese officials in Geneva as “productive”, adding that more detailed information would be shared on Monday.
As a reminder, the US imposed tariffs of 145% on Chinese goods, to which Beijing responded with a 125% levy on American imports.
Technical Analysis of the E-mini Nasdaq 100 Chart
The chart is showing bullish signals:
→ The downward trendline (shown in orange) was broken around the 19,666 level, which has since acted as support (indicated by the blue arrow).
→ Today, the Nasdaq 100 has moved above last week’s resistance near the 20,175 level.
→ Market fluctuations are forming an upward channel (shown in blue) from the April lows, with the price currently sitting in the upper half of the channel—typically a sign of strong buying pressure.
Further updates on the US–China trade deal may reveal key details, potentially reinforcing the current bullish sentiment in the equity markets.
This article represents the opinion of the Companies operating under the FXOpen brand only. It is not to be construed as an offer, solicitation, or recommendation with respect to products and services provided by the Companies operating under the FXOpen brand, nor is it to be considered financial advice.

Nasdaq analysis: 30-APRIL-2025Good morning. Welcome to today's Nasdaq market analysis and educational insights for price action traders.

Nasdaq market analysis: 28-APRIL-2025Good morning. Welcome to today's Nasdaq market analysis and educational insights for price action traders.

NASDAQ MEGA BOUNCE ZONEI want to see a super bounce from this demand zone tomorrow due to the recent reactions around this price level. Lots of interest being shown here. I am sized in pretty heftily on MNQ futures. In a $0 or HERO position. WIll be closing my laptop now...

Nasdaq 100 Prepares for Launch — Reclaiming Critical GroundNAS100 8H TECHNICAL ANALYSIS 💻🧠
OVERALL TREND
📈 UPTREND — Structure is shifting bullish. Recent higher lows and strong rebounds from April lows confirm the current upward momentum. This is supported by 12/13 Moving Averages flashing BUY , including critical 50- and 200-period EMAs/SMA clusters. MACD and Momentum indicators also favor continued upside.
🔴 RESISTANCE ZONES
22,248.00 — 🔴 SELL STOPLOSS | Final Pivot High
21,955.77 — 🔴 SELL ORDER 2
21,364.19 — 🔴 SELL ORDER 1
🎯 TARGETS & BUY ORDERS
21,065.42 — 🎯 TP4 | EXIT THE RALLY
19,989.54 — 🎯 TP3 | Momentum confirmation
19,291.55 — 🎯 TP2 | Mid Pivot Zone
18,286.55 — 🎯 TP1 | Initial Profit Target
17,258.99 — ✅ BUY ORDER 1
16,630.74 — ✅ BUY ORDER 2
16,335.10 — ✅ BUY STOPLOSS | Pivot Low
🟢 SUPPORT STRUCTURE
PIVOT LOW @ 18,286 — Support holding for now
PIVOT LOW @ 17,258 — Strong confluence with previous structure
BUY ORDER zones between 16,330 – 17,258 — Demand cluster for reversals
🤓 STRUCTURAL NOTES
MACD shows bullish divergence with a rising histogram and crossover confirmation Momentum (+694) and RSI (66.69) suggest strength, though nearing overbought territory Price has reclaimed 10, 20, 50, 100, and 200 MA levels — rare alignment of major trend confirmation
Only outlier: Hull MA (9) signaling short-term overextension — may suggest brief consolidation before continuation
🌍 GLOBAL TECHNICAL SUMMARY
📊 12 of 13 Major Moving Averages = BUY
📈 MACD & Momentum Oscillators = BUY
🧭 Majority of Oscillators = Neutral — supporting a “calm before breakout” thesis ⚖️ CCI shows slight overbought = caution near resistance zones
📉 No major bearish divergence detected — trend remains intact
TRADE OUTLOOK 🔎
📈 Bullish Bias above 18,286.55 (TP1) targeting 19,291.55 (TP2) and beyond
📉 Bearish rejection likely near 21,065+ if volume fades — monitor RSI/MACD
👀 Watch for volume confirmation as we approach 19,989.55
🧪 STRATEGY RECOMMENDATION
CONSERVATIVE BREAKOUT ENTRY:
— Entry: 18,286.55
— TP Levels: 19,291.55 / 19,989.55 / 21,065.42
— SL: Below 17,258.99
RISK-ON DIP BUY STRATEGY:
— Buy Zone: 16,630 – 17,258
— TP: 18,286.55 / 19,291.55
— SL: Below 16,335.10
“Discipline | Consistency | PAY-tience”

Nasdaq analysis: 17-APRIL-2025Good morning, traders! Today's Nasdaq analysis will help you achieve your trading goals. Let's work together towards success.

Nasdaq insights: 16-APRIL-2025Good morning, traders! As a seasoned price action trader, I'll share my Nasdaq insights to help you improve your trading skills.

Why the current section is important
Hello, traders.
If you "Follow", you can always get new information quickly.
Please click "Boost" as well.
Have a nice day today.
-------------------------------------
It is not easy to explain everything with just chart analysis.
Therefore, it is true that interpretation of various issues is necessary.
However, I am only explaining the chart.
The reason is that interpretation of various issues other than the chart is not easy for individual investors.
-
(NAS100USD 1W chart)
In order to continue the uptrend, the price must be maintained above the M-Signal indicator of the 1M chart.
If not, there is a high possibility of continuing the downtrend.
Therefore, if the price is maintained above 18693.7, I think it is highly likely that the uptrend will continue.
However, this is a medium- to long-term perspective.
-
(1D chart)
In the short term, the price should be maintained above the M-Signal indicator on the 1D chart.
In that sense, we can see that the current price position is an important section.
However, in order to continue the short-term upward trend, it should rise above the M-Signal indicator on the 1W chart.
In that sense, the support around 19848.3 is an important key point.
-
Currently, the StochRSI indicator has entered the overbought section.
Therefore, even if it continues to rise further, it is expected to show a downward trend in the end.
Therefore, if it is not supported near 19848.3, I think you should prepare for a decline.
At this time, you should check whether it can be supported near 18428.8 and rise.
The reason is that the HA-Low indicator of the 1D chart is formed.
-
The HA-Low and HA-High indicators are indicators created for trading on the Heikin Ashi chart.
The fact that the HA-Low indicator was created means that it rose from the low point section.
Therefore, if it is supported near the HA-Low indicator, then that is the time to buy.
If it falls without being supported by the HA-Low indicator, there is a possibility of a stepwise decline, so you should think about a countermeasure for this.
However, there is a difference between a downward trend following the HA-Low indicator and a simple downward trend.
A stepwise decline following the HA-Low indicator is likely to eventually form a bottom section.
The next volatility period is expected to be around April 29th.
-
Thank you for reading to the end.
I hope you have a successful trading.
--------------------------------------------------

Nasdaq market analysis: 14-APRIL-2025Good morning! Happy New Week! Here's your daily Nasdaq market analysis. Learn, grow, and trade wisely.

NAS100 (15min) – Bullish Entry Activated1. Symmetrical Triangle Formation
Price was compressing inside a symmetrical triangle, with a series of lower highs and higher lows, indicating indecision and buildup of pressure.
2. Downside Fake-out (False Breakout)
Price briefly broke below the lower trendline, suggesting a potential bearish breakout.
However, there was no strong follow-through; instead, price quickly reclaimed the trendline and pushed back inside the structure.
This is a classic fake-out, often trapping late sellers and providing liquidity for buyers.
The rejection from the lows resulted in a long wick, signalling strong buying interest and failure to break down.
3. Aggressive Bullish Reaction
After reclaiming the triangle support, price moved rapidly back to the top of the triangle.
The next key move was a strong breakout above the upper trendline, confirming bullish intent.
4. Break and Retest
Price action followed through with a clean breakout above resistance, followed by a minor pullback and retest of the broken trendline, which held as support.
This retest offered a textbook entry point based on price action principles.
5. Bullish Structure Confirmation
Post breakout, price formed a higher low and continued to make a higher high, confirming a trend shift.
This structural change strengthens the bullish outlook.
"NAS100/US100" Index Market Money Heist Plan (Day / Scalping)🌟Hi! Hola! Ola! Bonjour! Hallo! Marhaba!🌟
Dear Money Makers & Robbers, 🤑💰✈️
Based on 🔥Thief Trading style technical and fundamental analysis🔥, here is our master plan to heist the "NAS100/US100" Index CFD Market. Please adhere to the strategy I've outlined in the chart, which emphasizes short entry. Our aim is the high-risk Green MA Zone. Risky level, oversold market, consolidation, trend reversal, trap at the level where traders and bullish robbers are stronger. 🏆💸"Take profit and treat yourself, traders. You deserve it!💪🏆🎉
Entry 📈 : "The heist is on! Wait for the MA breakout then make your move at (16400) - Bearish profits await!"
however I advise to Place sell stop orders above the Moving average (or) after the Support level Place sell limit orders within a 15 or 30 minute timeframe most NEAREST (or) SWING low or high level.
📌I strongly advise you to set an "alert (Alarm)" on your chart so you can see when the breakout entry occurs.
Stop Loss 🛑: "🔊 Yo, listen up! 🗣️ If you're lookin' to get in on a sell stop order, don't even think about settin' that stop loss till after the breakout 🚀. You feel me? Now, if you're smart, you'll place that stop loss where I told you to 📍, but if you're a rebel, you can put it wherever you like 🤪 - just don't say I didn't warn you ⚠️. You're playin' with fire 🔥, and it's your risk, not mine 👊."
📌Thief SL placed at the nearest/swing High or Low level Using the 4H timeframe (17300) Day/Scalping trade basis.
📌SL is based on your risk of the trade, lot size and how many multiple orders you have to take.
Target 🎯: 15300 (or) Escape Before the Target
"NAS100/US100" Index CFD Market Heist Plan (Scalping / Day Trade) is currently experiencing a Bearish trend.., driven by several key factors.👇👇👇
📰🗞️Get & Read the Fundamental, Macro, COT Report, Geopolitical and News Analysis, Sentimental Outlook, Intermarket Analysis, Index-Specific Analysis, Positioning and future trend targets... go ahead to check 👉👉👉🔗🔗
Detailed Explanation 📝
Fundamentals: Growth stalls 📉, valuations adjust—bearish shift 🐻.
Macro: Cooling economy 🌍, sticky inflation 🔥—downward pressure.
COT: Speculators flee 📉, hedgers dig in—bearish signal 🐻.
Index: Correction deepens 📉, support tests near—technical bear 🐻.
Intermarket: Yields/USD crush risk assets 💪—bearish tide.
Geopolitical: Trade wars ⚔️, regulation 🔍—negative catalysts pile up.
Sentiment: Fear takes hold 😟—bearish consensus builds.
Trends: Near/medium-term declines 📉, long-term hinges on recovery ⚖️.
Outlook: Moderately bearish 🌩️—tough sledding ahead.
⚠️Trading Alert : News Releases and Position Management 📰 🗞️ 🚫🚏
As a reminder, news releases can have a significant impact on market prices and volatility. To minimize potential losses and protect your running positions,
we recommend the following:
Avoid taking new trades during news releases
Use trailing stop-loss orders to protect your running positions and lock in profits
💖Supporting our robbery plan 💥Hit the Boost Button💥 will enable us to effortlessly make and steal money 💰💵. Boost the strength of our robbery team. Every day in this market make money with ease by using the Thief Trading Style.🏆💪🤝❤️🎉🚀
I'll see you soon with another heist plan, so stay tuned 🤑🐱👤🤗🤩

Actionable Nasdaq insights: 11-APRIL-2025Rise and shine, traders! Start your day with actionable Nasdaq insights. Let's grow your skills together, one chart at a time.

Nasdaq insights: 10-APRIL-2025Rise and shine, traders! Start your day with actionable Nasdaq insights. Let's grow your skills together, one chart at a time.

Nasdaq market analysis: 09-APRIL-2025Good morning, traders! Welcome to today's Nasdaq market analysis. Compare my price action insights with your own charts and enhance your trading skills.

Nasdaq trading insights: 08-APRIL-2025Nasdaq trading insights: Not signals, but informative zones to aid your decision-making. Please note: These zones are not trading advice. Use them as a starting point for your own analysis.

NASDAQ, S&P 500 and CoinMarketCap movements, Bitcoin chart
Hello, traders.
If you "Follow", you can always get new information quickly.
Please click "Boost" as well.
Have a nice day today.
-------------------------------------
We need to check the movement after a new candle is created.
USDT, USDC should gap up to know that funds have flowed into the coin market.
On the other hand, if there is a gap down, I think funds have flowed out of the coin market.
Therefore, I think USDT or USDC are showing the size and flow of funds in the coin market.
-
(BTC.D 1M chart)
If BTC dominance is maintained above 62.47 or continues to rise, altcoins are likely to show a large decline.
Therefore, in order for an altcoin bull market to begin, it must fall below 55.01 and remain there or continue to decline.
-
(USDT.D 1M chart)
USDT is a fund that has a large influence on the coin market.
Therefore, if USDT dominance rises, it means that the coin market is likely to show an overall decline.
On the other hand, if it falls, it can be interpreted that the coin market is likely to show an overall rise.
In order for the coin market to start an upward trend, it must fall below 4.97 and remain there or continue to decline.
In particular, if the Fibonacci ratio rises above 0.618, the coin market is likely to plummet.
If it remains above the Fibonacci ratio of 0.618, it is likely to rise to around 7.14.
-------------------------------------------
(NAS100USD 12M chart)
It has currently entered the most important support and resistance zone.
-
(1W chart)
Therefore, the maximum decline point is expected to be around 14922.2.
In order to continue the uptrend, the price must be maintained above the M-Signal indicator on the 1M chart.
Therefore, the key is whether it can receive support near the most important support and resistance zone and rise above the M-Signal indicator on the 1M chart.
---------------------------------------------
(SPX500USD 1W chart)
The key is whether it can be supported around 4773.4-4846.1 and rise above the M-Signal indicator on the 1M chart.
If not, the maximum decline is expected to be around 3875.1-4116.0.
---------------------------------------------
(BTCUSDT 1M chart)
As I mentioned before, since the dotted trend line (1) is not acting as a clear trend line, there is a high possibility of volatility.
Therefore, when the StochRSI indicator creates a peak in the oversold zone and rises this time, there is a possibility that a trend will be formed as a trend line between lows is created.
However, the high-point trend line and the low-point trend line must be formed in the same direction.
In other words, since the current high-point trend line is creating an upward trend line, the low-point trend line that will be created this time must also create an upward trend line.
In that sense, the 69000-73199.86 section can be seen as an important support and resistance section.
If it falls below 69000, it is likely to touch the Fibonacci ratio section of 0.886 (56227.18) ~ 1 (61338.93), which was the previous high point section.
-
(1D chart)
On the last day of this volatility period, it fell below the upward trend line (2), showing a large decline.
Since it fell below the downward trend line, there is a possibility that it will continue to fall further.
At this time, the key is whether it can rise with support near 73499.86.
The next volatility period is around April 25 (April 24-26).
The point of interest is whether the price is maintained near 73499.86 or 89294.25 after the next volatility period.
-
The 73499.86 point is the HA-High indicator point on the 1M chart.
The M-Signal indicator on the 1M chart is rising to around 73499.86.
Therefore, if support is confirmed near the M-Signal indicator on the 1M chart, I think it is an aggressive buying period.
If it falls below the M-Signal indicator on the 1M chart, it is a buying period until it rises again and supports near the M-Signal indicator on the 1M chart.
The next time to buy is when it shows support near the Fibonacci ratio range of 0.886 (56227.18) ~ 1 (61338.93) that I mentioned in the 1M chart explanation.
-
Thank you for reading to the end.
I hope you have a successful trade.
--------------------------------------------------
- This is an explanation of the big picture.
I used TradingView's INDEX chart to check the entire range of BTC.
I rewrote the previous chart to update it while touching the Fibonacci ratio range of 1.902 (101875.70) ~ 2 (106275.10).
(Previous BTCUSD 12M chart)
Looking at the big picture, it seems to have been maintaining an upward trend following a pattern since 2015.
That is, it is a pattern that maintains a 3-year uptrend and faces a 1-year downtrend.
Accordingly, the uptrend is expected to continue until 2025.
-
(Current BTCUSD 12M chart)
Based on the currently written Fibonacci ratio, it is displayed up to 3.618 (178910.15).
It is expected that it will not fall again below the Fibonacci ratio of 0.618 (44234.54).
(BTCUSDT 12M chart)
Based on the BTCUSDT chart, I think it is around 42283.58.
-
I will explain it again with the BTCUSD chart.
The Fibonacci ratio ranges marked in the green boxes, 1.902 (101875.70) ~ 2 (106275.10) and 3 (151166.97) ~ 3.14 (157451.83), are expected to be important support and resistance ranges.
In other words, it seems likely that they will act as volume profile ranges.
Therefore, in order to break through these ranges upward, I think the point to watch is whether they can receive support and rise near the Fibonacci ratios of 1.618 (89126.41) and 2.618 (134018.28).
Therefore, the maximum rising range in 2025 is expected to be the 3 (151166.97) ~ 3.14 (157451.83) range.
In order to do that, we need to see if it is supported and rises near 2.618 (134018.28).
If it falls after the bull market in 2025, we don't know how far it will fall, but based on the previous decline, we expect it to fall by about -60% to -70%.
Therefore, if it starts to fall near the Fibonacci ratio 3.14 (157451.83), it seems likely that it will fall to around Fibonacci 0.618 (44234.54).
I will explain more details when the bear market starts.
------------------------------------------------------

"NAS100 / US100" Index CFD Market Heist Plan (Day or Swing)🌟Hi! Hola! Ola! Bonjour! Hallo! Marhaba!🌟
Dear Money Makers & Robbers, 🤑 💰💸✈️
Based on 🔥Thief Trading style technical and fundamental analysis🔥, here is our master plan to heist the "NAS100 / US100" Index CFD Market. Please adhere to the strategy I've outlined in the chart, which emphasizes long entry. Our aim is the high-risk Red Zone. Risky level, overbought market, consolidation, trend reversal, trap at the level where traders and bearish robbers are stronger. 🏆💸"Take profit and treat yourself, traders. You deserve it!💪🏆🎉
Entry 📈 : "The heist is on! Wait for the MA breakout (20000) then make your move - Bullish profits await!"
however I advise to Place Buy stop orders above the Moving average (or) Place buy limit orders within a 15 or 30 minute timeframe most recent or swing, low or high level.
📌I strongly advise you to set an alert on your chart so you can see when the breakout entry occurs.
Stop Loss 🛑:
Thief SL placed at the recent/swing low level Using the 1H timeframe (19400) swing trade basis.
SL is based on your risk of the trade, lot size and how many multiple orders you have to take.
🏴☠️Target 🎯: 20800 (or) Escape Before the Target
🧲Scalpers, take note 👀 : only scalp on the Long side. If you have a lot of money, you can go straight away; if not, you can join swing traders and carry out the robbery plan. Use trailing SL to safeguard your money 💰.
"NAS100 / US100" Index CFD Market Heist Plan (Swing/Day) is currently experiencing a bullishness,., driven by several key factors.
📰🗞️Get & Read the Fundamental, Macro, COT Report, Geopolitical and News Analysis, Sentimental Outlook, Intermarket Analysis, Index-Specific Analysis, Positioning and future trend targets.. go ahead to check 👉👉👉
📌Keep in mind that these factors can change rapidly, and it's essential to stay up-to-date with market developments and adjust your analysis accordingly.
⚠️Trading Alert : News Releases and Position Management 📰 🗞️ 🚫🚏
As a reminder, news releases can have a significant impact on market prices and volatility. To minimize potential losses and protect your running positions,
we recommend the following:
Avoid taking new trades during news releases
Use trailing stop-loss orders to protect your running positions and lock in profits
💖Supporting our robbery plan 💥Hit the Boost Button💥 will enable us to effortlessly make and steal money 💰💵. Boost the strength of our robbery team. Every day in this market make money with ease by using the Thief Trading Style.🏆💪🤝❤️🎉🚀
I'll see you soon with another heist plan, so stay tuned 🤑🐱👤🤗🤩

Nasdaq market analysis: 04-APRIL-2025Good morning. Welcome to today's Nasdaq market analysis and educational insights for price action traders.

NAS100 Testing Demand Zone – Major Reversal or More Drops? 📊 Market Overview:
The NASDAQ 100 (NAS100) just tested a strong demand zone (18,900 - 18,950) and is showing signs of a potential reversal. Can buyers push the price higher, or will bears take control?
🔹 Key Resistance Levels: 19,568 | 20,160
🔹 Current Price: 18,977
🔹 Key Support Levels: 18,896 (demand zone)
📉 Price Action Breakdown:
1️⃣ Sharp Drop into Demand Zone
Price recently fell from 19,568 after failing to break higher.
Buyers are now defending the 18,900 support zone, which has historically held strong.
2️⃣ Bullish Reversal Setup?
If the price holds above 18,900, we could see a bullish rally toward 19,568.
A breakout above 19,568 may open the way for 20,160+.
3️⃣ Bearish Breakdown Risk
If the price drops below 18,896, expect further downside towards 18,600 - 18,500.
Sellers would regain control, confirming a bearish continuation.
📊 Trading Plan:
📍 Bullish Case:
🔹 Look for bullish confirmation in the 18,900 - 18,950 zone.
🔹 A strong bounce could target 19,568, then 20,160.
📍 Bearish Case:
🔹 If price fails to hold 18,896, a short setup targeting 18,600 - 18,500 is possible.
🔹 Wait for a clean break & retest before shorting.
🔥 Will NAS100 bounce back from this demand zone, or will sellers dominate? Drop your thoughts in the comments! 👇
📊 Like & Follow for more trade insights! 🚀
#NASDAQ100 #TechStocks #Trading #StockMarket #SupplyAndDemand #Forex #PriceAction

Nasdaq market analysis: 03-APRIL-2025Good morning Dear Traders! Join me for Nasdaq market analysis for the today. Share your charts, ask questions, and let's discuss trading strategies.

Nasdaq trading zones: 02-APRIL-2025Discover today's Nasdaq trading zones and refine your market analysis skills.
