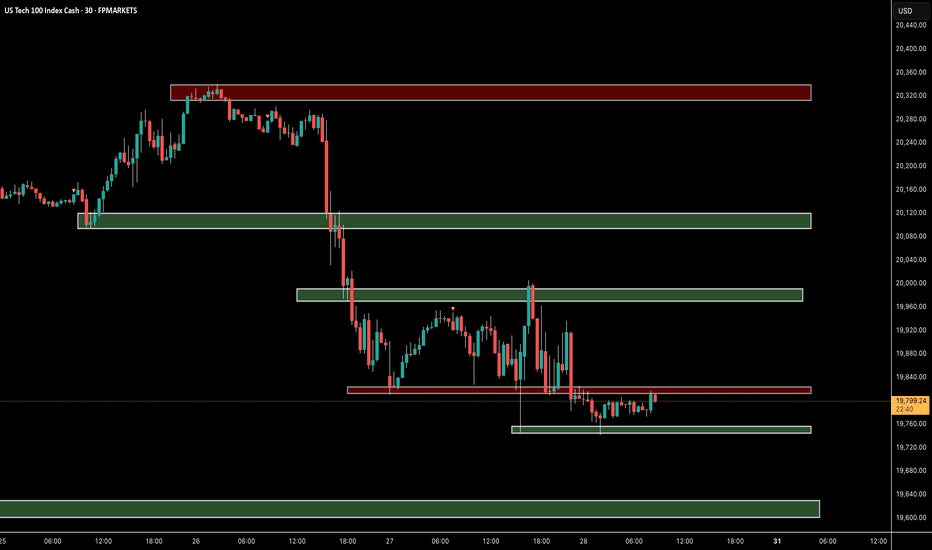
"NAS100/US100" Indices Market Heist Plan (Scalping / Day Trade)🌟Hi! Hola! Ola! Bonjour! Hallo! Marhaba!🌟
Dear Money Makers & Robbers, 🤑 💰💸✈️
Based on 🔥Thief Trading style technical and fundamental analysis🔥, here is our master plan to heist the "NAS100/US100" Indices Market. Please adhere to the strategy I've outlined in the chart, which emphasizes long entry. Our aim is the high-risk Red Zone. Risky level, overbought market, consolidation, trend reversal, trap at the level where traders and bearish robbers are stronger. 🏆💸"Take profit and treat yourself, traders. You deserve it!💪🏆🎉
Entry 📈 : "The vault is wide open! Swipe the Bullish loot at any price - the heist is on!
however I advise to Place buy limit orders within a 15 or 30 minute timeframe most recent or swing, low or high level. I Highly recommended you to put alert in your chart.
Stop Loss 🛑:
Thief SL placed at the recent/swing low level Using the 30m timeframe (19700) swing trade basis.
SL is based on your risk of the trade, lot size and how many multiple orders you have to take.
🏴☠️Target 🎯: 20350 (or) Escape Before the Target
🧲Scalpers, take note 👀 : only scalp on the Long side. If you have a lot of money, you can go straight away; if not, you can join swing traders and carry out the robbery plan. Use trailing SL to safeguard your money 💰.
"NAS100/US100" Indices Market Heist Plan (Scalping / Day Trade) is currently experiencing a bullishness,., driven by several key factors.
📰🗞️Get & Read the Fundamental, Macro, COT Report, Geopolitical and News Analysis, Sentimental Outlook, Intermarket Analysis, Index-Specific Analysis, Positioning and future trend targets.. go ahead to check 👉👉👉
📌Keep in mind that these factors can change rapidly, and it's essential to stay up-to-date with market developments and adjust your analysis accordingly.
⚠️Trading Alert : News Releases and Position Management 📰 🗞️ 🚫🚏
As a reminder, news releases can have a significant impact on market prices and volatility. To minimize potential losses and protect your running positions,
we recommend the following:
Avoid taking new trades during news releases
Use trailing stop-loss orders to protect your running positions and lock in profits
💖Supporting our robbery plan 💥Hit the Boost Button💥 will enable us to effortlessly make and steal money 💰💵. Boost the strength of our robbery team. Every day in this market make money with ease by using the Thief Trading Style.🏆💪🤝❤️🎉🚀
I'll see you soon with another heist plan, so stay tuned 🤑🐱👤🤗🤩
US NAS 100
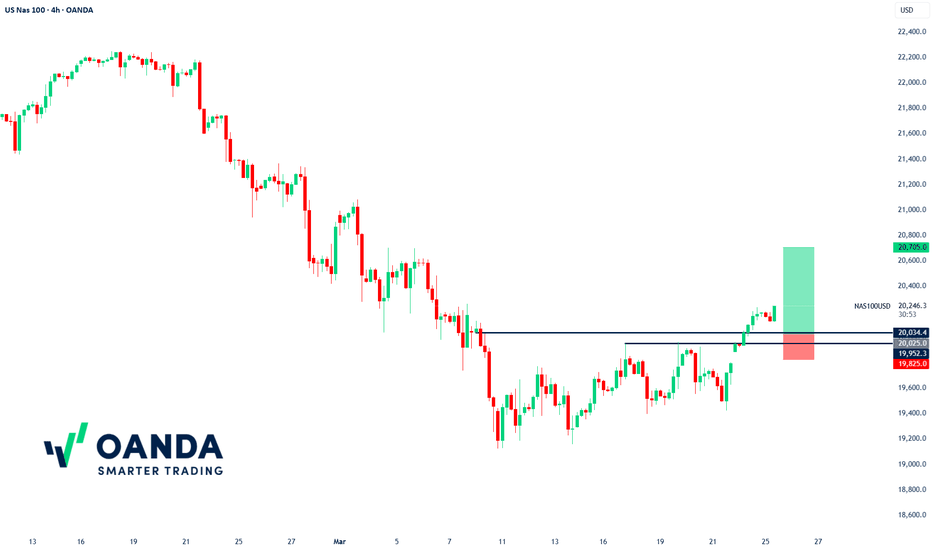
NAS100USD Buy Idea: Bullish Momentum Targets 20705🚀 OANDA:NAS100USD Buy Idea: Bullish Momentum Targets 20705 💹 - 24h expiry
OANDA:NAS100USD - We look to Buy at 20025
Stop Loss: 19825
Target 1: 20705
Target 2: 20730
Resistance: 20234, 20705, 20730
Support: 20025, 19423, 19125
Technical Setup:
📈 Continued upward momentum from 19424 resulted in the pair posting net daily gains yesterday .
⚠️ Overbought extremes indicate scope for mild selling at the open, but losses should remain limited .
🔑 Medium-term bias remains bullish .
🏁 Key resistance level at 20705 .
📰 News Sentiment
📊 Recent sessions show a bullish uptick in News Sentiment (Red Line), aligning with the price movement (Blue Line).
🌟 Positive sentiment (Red Line) is extending higher, suggesting further upside potential in the short term.
Risk Disclaimer
The trade ideas beyond this page are for informational purposes only and do not constitute investment advice or a solicitation to trade. This information is provided by Signal Centre, a third-party unaffiliated with OANDA, and is intended for general circulation only. OANDA does not guarantee the accuracy of this information and assumes no responsibilities for the information provided by the third party. The information does not take into account the specific investment objectives, financial situation, or particular needs of any particular person. You should take into account your specific investment objectives, financial situation, and particular needs before making a commitment to trade, including seeking advice from an independent financial adviser regarding the suitability of the investment, under a separate engagement, as you deem fit.
You accept that you assume all risks in independently viewing the contents and selecting a chosen strategy.
Where the research is distributed in Singapore to a person who is not an Accredited Investor, Expert Investor or an Institutional Investor, Oanda Asia Pacific Pte Ltd (“OAP“) accepts legal responsibility for the contents of the report to such persons only to the extent required by law. Singapore customers should contact OAP at 6579 8289 for matters arising from, or in connection with, the information/research distributed.
NAS100 Potential Intraday Shorts (Technical Analysis)Technical Outlook:
The price action since late February has been decisively bearish, characterized by a significant decline throughout March, indicating a clear mid-term distribution phase. We observed a recent rejection from a 4H and 1H supply zone (which fell within a pronounced drop-base-drop pattern). Notably, the most recent downward push failed to establish new lows. This follows a period of rapid decline with minimal bullish resistance. This suggests two possibilities:
Bulls are strategically allowing sellers to exhaust themselves before a potential countermove.
The prevailing bearish momentum is overpowering any attempts at bullish recovery.
Trading Considerations:
The daily candle has formed a bearish engulfing pattern, confirming strong selling pressure. My trading strategy involves waiting for a price retracement back into the identified supply zone. This pullback would serve to fill existing price imbalances and trigger resting orders above, providing an opportunity to enter short positions with improved risk-to-reward ratios on lower timeframes (LTFs). Currently, there are no indications of significant bullish manipulation. Therefore, I anticipate continued downward momentum this week. It's plausible that we might witness a final bearish surge coinciding with the FOMC announcement before a potential bullish reversal - a hypothetical scenario based on technical analysis.
Final Notes:
The previous instance of the price trading this far below the 200 EMA occurred in December 2022, marking the culmination of a year-long bearish trend. While we are currently only one month into this downward movement, it's crucial to remember that past performance is not indicative of future results. Although a bullish rally is possible, I will maintain a bearish bias and focus on short opportunities until a clear bullish reversal pattern emerges on the 4H and 1H timeframes. When such a reversal occurs, we will be ready to capitalize on the subsequent upward trend! ;)
NAS100 Buy Analysis: GTENAS100 Buy Analysis:
NAS100 has successfully crossed through the Inverse Fair Value Gap (IFVG) on the 1-hour timeframe, confirming bullish momentum. Price is currently holding above the recent support zone around 19,400, and as long as this level holds, the index is likely to continue its climb.
The short-term target is the top trendline near 19,700 - 19,800, aligning with the broader bullish structure ahead of tomorrow’s CPI news release. Expect increased volatility, but the bullish bias remains intact unless price breaks below the lower trendline around 19,300.
NAS100USD Will Move Lower! Short!
Please, check our technical outlook for NAS100USD.
Time Frame: 45m
Current Trend: Bearish
Sentiment: Overbought (based on 7-period RSI)
Forecast: Bearish
The price is testing a key resistance 19,535.5.
Taking into consideration the current market trend & overbought RSI, chances will be high to see a bearish movement to the downside at least to 19,253.5 level.
P.S
Overbought describes a period of time where there has been a significant and consistent upward move in price over a period of time without much pullback.
Like and subscribe and comment my ideas if you enjoy them!
NAS100USD Will Go Higher! Buy!
Take a look at our analysis for NAS100USD.
Time Frame: 1D
Current Trend: Bullish
Sentiment: Oversold (based on 7-period RSI)
Forecast: Bullish
The market is testing a major horizontal structure 20,175.5.
Taking into consideration the structure & trend analysis, I believe that the market will reach 21,410.0 level soon.
P.S
Overbought describes a period of time where there has been a significant and consistent upward move in price over a period of time without much pullback.
Like and subscribe and comment my ideas if you enjoy them!
NAS100USD Will Fall! Sell!
Here is our detailed technical review for NAS100USD.
Time Frame: 9h
Current Trend: Bearish
Sentiment: Overbought (based on 7-period RSI)
Forecast: Bearish
The market is approaching a significant resistance area 20,454.4.
Due to the fact that we see a positive bearish reaction from the underlined area, I strongly believe that sellers will manage to push the price all the way down to 19,860.0 level.
P.S
Please, note that an oversold/overbought condition can last for a long time, and therefore being oversold/overbought doesn't mean a price rally will come soon, or at all.
Like and subscribe and comment my ideas if you enjoy them!
NAS100USD Is Very Bearish! Sell!
Take a look at our analysis for NAS100USD.
Time Frame: 3h
Current Trend: Bearish
Sentiment: Overbought (based on 7-period RSI)
Forecast: Bearish
The market is on a crucial zone of supply 21,289.6.
The above-mentioned technicals clearly indicate the dominance of sellers on the market. I recommend shorting the instrument, aiming at 20,988.9 level.
P.S
The term oversold refers to a condition where an asset has traded lower in price and has the potential for a price bounce.
Overbought refers to market scenarios where the instrument is traded considerably higher than its fair value. Overvaluation is caused by market sentiments when there is positive news.
Like and subscribe and comment my ideas if you enjoy them!
NAS100USD Is Bullish! Buy!
Please, check our technical outlook for NAS100USD.
Time Frame: 9h
Current Trend: Bullish
Sentiment: Oversold (based on 7-period RSI)
Forecast: Bullish
The market is testing a major horizontal structure 21,661.7.
Taking into consideration the structure & trend analysis, I believe that the market will reach 21,981.2 level soon.
P.S
Overbought describes a period of time where there has been a significant and consistent upward move in price over a period of time without much pullback.
Like and subscribe and comment my ideas if you enjoy them!


