NAS100USD: Will Keep Falling! The Next Goal is:
Hey traders,
Here is our technical analysis on NAS100USD.
The level where the price is trading right now is major and the price will most likely retrace from that.
❤️ Please, support our work with like & comment! ❤️
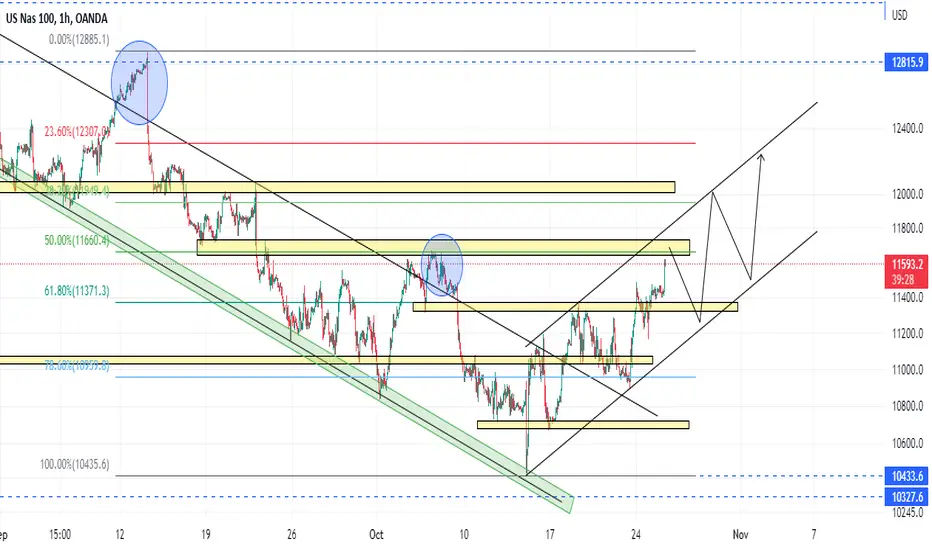
US NAS 100


NASDAQ Bullish Run Started!!I have a Bullish bias on Nasdaq!
Some key points:
-The descending channel has broken
-Printing HHs and HLs
-This time it does not look like a fakeout, as I have witnessed the fakeout behavior of NASDAQ twice in this descending channel.
-Also, at the same time, we need to keep our eyes on the DXY as well.
Bitcoin (BTC) - October 25Hello?
Welcome, traders.
By "following", you can always get new information quickly.
Please also click "Boost".
Have a good day.
-------------------------------------
(USDT.D 1D Chart)
When USDT dominance declines, the coin market is likely to show an upward trend.
So, the key is whether or not it can move down towards 7.27.
(NAS100USD 1D Chart)
If held above 11373.2, we expect it to move above 11942.9.
---------------------------------------
(BTCUSDTPERP 1D Chart)
In order to turn into an uptrend and rise, it must rise above the HA-Low indicator and be supported.
Therefore, the key is whether it can rise above 19355.6 and find support.
In addition, if it is supported by rising above the MS-Signal indicator and above 19424.9, it is expected to rise above 19607.9 and continue rising to the primary resistance section of 20122.5 ~ 0.5 (20313.0).
The next volatility period is around November 10th.
(1h chart)
In order to transition into an uptrend, it must rise above the 19355.6-19607.9 zone and find support.
In particular, if the price is maintained above 19411.7, it will be more likely to move higher.
We need to see if the 5EMA and 26EMA on the 1D chart can rise above the 26EMA so that they can convert into a positive alignment.
If it rises above section 1, 19458.6, it is expected to rise to section 5.
If it falls below the 19216.3 ~ 0.382 (19260.9) range, it is expected to decline to around 18895.1-18947.7.
Therefore, it is important to converse around the current location, 19355.6.
If it does not move above 19355.6, the main position is 'SHORT'.
However, since it is close to the 19355.6 point, the position should be determined based on the 19216.3 ~ 0.382 (19260.9) section and the 19411.7 ~ 0.5 (19458.6) section.
------------------------------
- big picture
I think you need to be supported in the 13K-15K section to gain the strength to rise.
So, whether it rises or falls from its current position, both require a short-term response.
A full-fledged uptrend is expected to begin when it rises above 29K.
------------------------------------------------------------ -------------------------------------------
** All descriptions are for reference only and do not guarantee a profit or loss in investment.
** If you share this chart, you can use the indicators normally.
** The MRHAB-T indicator contains indicators that indicate support and resistance points.
** SR_R_C indicators are displayed as StochRSI(line), RSI(columns), CCI(bgcolor).
** CCI indicator is expressed as overbought range (CCI > +100) and oversold range (CCI < -100).
(Short-term Stop Loss can be said to be a point where profit and loss can be preserved or additional entry can be made through split trading. It is a short-term investment perspective.)
---------------------------------

✅NAS100 BUYING OPPORTUNITY|LONG🚀
✅NAS100 broke the falling resistance
So after the pullback and retest
A move up is to be expected
To retest the level above
LONG🚀
✅Like and subscribe to never miss a new idea!✅

Buying NASDAQ stem dips.NASDAQ - 8h expiry - We look to Buy at 11062 (stop at 10814)
Trading within a Bullish Channel formation.
A weaker opening is expected to challenge bullish resolve.
Support is located at 11000 and should stem dips to this area.
Dip buying offers good risk/reward.
Further upside is expected.
Our profit targets will be 11655 and 11800
Weekly levels
Resistance: 11600 / 13720 / 15260
Support: 11000 / 9550 / 6900
Risk Disclaimer
The trade ideas beyond this page are for informational purposes only and do not constitute investment advice or a solicitation to trade. This information is provided by Signal Centre, a third-party unaffiliated with OANDA, and is intended for general circulation only. OANDA does not guarantee the accuracy of this information and assumes no responsibilities for the information provided by the third party. The information does not take into account the specific investment objectives, financial situation, or particular needs of any particular person. You should take into account your specific investment objectives, financial situation, and particular needs before making a commitment to trade, including seeking advice from an independent financial adviser regarding the suitability of the investment, under a separate engagement, as you deem fit.
You accept that you assume all risks in independently viewing the contents and selecting a chosen strategy.
Where the research is distributed in Singapore to a person who is not an Accredited Investor, Expert Investor or an Institutional Investor, Oanda Asia Pacific Pte Ltd (“OAP“) accepts legal responsibility for the contents of the report to such persons only to the extent required by law. Singapore customers should contact OAP at 6579 8289 for matters arising from, or in connection with, the information/research distributed.

Bitcoin (BTC) - October 24Hello?
Welcome, traders.
By "following", you can always get new information quickly.
Please also click "Boost".
Have a good day.
-------------------------------------
(BTC.D 1D Chart)
For the coin market to continue its upward trend, BTC price must rise first.
In order to do that, it must show that the funds are concentrated towards BTC.
If funds are concentrated towards BTC, BTC dominance will rise.
(USDT.D 1D Chart)
The key is whether USDT dominance declines when BTC dominance rises.
This is because a decline in USDT dominance is likely to lead to an uptrend in the coin market.
However, if BTC dominance rises sharply, altcoins may rather fall or go sideways, so be careful.
(NAS100USD 1D Chart)
If it stays above 11373.2 until around October 28, it is expected to move higher around 11942.9-12119.2.
If not, it is necessary to check if support is provided in the 1.13 (10689.2)-0.886 (11344.2) range, which is the right Fibonacci ratio range.
-----------------------------------------
(BTCUSDT 1W Chart)
The key is whether the price can be maintained above 20050.02 by moving along the uptrend line (2).
(1D chart)
In order to transition into an uptrend, the price must remain above the HA-Low indicator.
For that to happen, it needs to rise above 19695.87 for support.
October 22-24 is a period of volatility.
So, if it goes down, it is important to see support above the uptrend line (1), 19366.86.
In order to continue the upward trend, it must rise above the HA-High indicator.
To do that, you need to climb around 20798.16.
However, the 20798.16-21838.98 section is a resistance section, so it is expected that the upward trend will continue when it rises above this section.
We need to see if we can move higher than 20131.46 before moving towards 20798.16.
-----------------------------------------
A new indicator has been added to the volume indicator.
If you look at the 'Vol & Trend' indicator, the background color consists of a part corresponding to orange and a part corresponding to aqua color.
Orange indicates a high probability of an uptrend, while aqua indicates a high probability of a downtrend.
The shaded portions of this color indicate a strong trend, and the shaded portions of the color indicate a weak trend.
If we use this to explain the current trend of BTC price, we can interpret that it is maintaining a downtrend, but the downtrend is slowing down.
The coin market is a market structure with different prices and trading volumes across multiple exchanges.
Therefore, I think that analysis techniques using trend tracking are more suitable than the movement of trading volume in the coin market.
However, we hope that you use the indicator in the sense that you can predict the change in the price trend to some extent due to the change in the trend of the trading volume.
------------------------------
- big picture
I think you need to be supported in the 13K-15K section to gain the strength to rise.
So, whether it rises or falls from its current position, both require a short-term response.
A full-fledged uptrend is expected to begin when it rises above 29K.
------------------------------------------------------------ -------------------------------------------
** All descriptions are for reference only and do not guarantee a profit or loss in investment.
** If you share this chart, you can use the indicators normally.
** The MRHAB-T indicator contains indicators that indicate support and resistance points.
** HA SRRC indicators are expressed as StochRSI(line), RSI(columns), CCI(bgcolor).
** CCI indicator is expressed as overbought range (CCI > +100) and oversold range (CCI < -100).
(Short-term Stop Loss can be said to be a point where profit and loss can be preserved or additional entry can be made through split trading. It is a short-term investment perspective.)
---------------------------------


NAS100U BULLISH WITH HIGH PROBABILITY !!Hello ladies and gentlemen, according to my chart analysis of the NAS100U, there is a high probability of an increase towards 11560$ level in the next 15MIN !!!
An interesting opportunity to buy !

Bitcoin (BTC) - October 22Hello?
Welcome, traders.
By "following", you can always get new information quickly.
Please also click "Boost".
Have a good day.
-------------------------------------
(USDT 1D Chart)
(USDC 1D Chart)
The rise of the candles of stablecoins such as USDT and USDC means an increase in stablecoins generated by selling coins in the coin market.
In stablecoins, the inflow of new funds is expressed as a rise in the gap.
(NAS100USD 1D Chart)
The key is to find support and move higher in the 1.13 (10689.2)-0.886 (11344.2) range, which is the right-hand Fibonacci ratio range.
-----------------------------------------
(BTCUSDT 1D Chart)
In order to transition into an uptrend, the price must remain above the HA-Low indicator.
To do that, it should finally rise to around 19695.87.
If it doesn't, it will likely move down along a short-term bearish channel.
The key is to find support above 19176.93 to break out of the short-term bearish channel.
If it fails to move above 19176.93, it is expected to move towards the downtrend line (2), near 18353.11.
At this time, you need to check if it is supported near 17659.38-18353.11.
The next volatility period is around October 23 (October 22-24).
Therefore, it is necessary to check the movement of volatility that occurs at this time.
------------------------------
- big picture
I think you need to be supported in the 13K-15K section to gain the strength to rise.
So, whether it rises or falls from its current position, both require a short-term response.
A full-fledged uptrend is expected to begin when it rises above 29K.
------------------------------------------------------------ -------------------------------------------
** All descriptions are for reference only and do not guarantee a profit or loss in investment.
** If you share this chart, you can use the indicators normally.
** The MRHAB-T indicator contains indicators that indicate support and resistance points.
** HA SRRC indicators are expressed as StochRSI(line), RSI(columns), CCI(bgcolor).
** CCI indicator is expressed as overbought range (CCI > +100) and oversold range (CCI < -100).
(Short-term Stop Loss can be said to be a point where profit and loss can be preserved or additional entry can be made through split trading. It is a short-term investment perspective.)
---------------------------------


NAS100USD on a retracement move 🦐NASDAQ on the 4h chart is trading below an important weekly resistance.
The market in this premarket session is moving to the upside in a retracement move.
Yet we expect after the latest news and the upcoming news a progression of the bearish pressure on this asset.
How can i approach this scenario?
I will wait for the test of the resistance area and IF the price will provide us a sign of inversion i will set a nice short order according to the Plancton's strategy rules.
–––––
Follow the Shrimp 🦐
Keep in mind.
🟣 Purple structure -> Monthly structure.
🔴 Red structure -> Weekly structure.
🔵 Blue structure -> Daily structure.
🟡 Yellow structure -> 4h structure.
⚫️ Black structure -> <4h structure.
Here is the Plancton0618 technical analysis , please comment below if you have any question.
The ENTRY in the market will be taken only if the condition of the Plancton0618 strategy will trigger.

Bitcoin (BTC) - October 21Hello?
Welcome, traders.
By "following", you can always get new information quickly.
Please also click "Boost".
Have a good day.
-------------------------------------
(USDT 1D Chart)
(USDC 1D Chart)
You need to be careful when trading as there is an ongoing outflow of funds through USDC.
If the outflow of funds does not stop, the rise of the coin market is bound to be limited.
(NAS100USD 1D Chart)
The key issue is whether the 1.13 (10689.2)-11373.2 section can support and rise.
If not, you should touch the downtrend line and see if you can move up.
---------------------------------------
(BTCUSDTPERP 1D Chart)
To transition to an uptrend, it needs to rise above the HA-Low indicator and be supported.
Therefore, it should rise more than the 19355.6-19607.9 section.
However, if it rises above 19216.3 and finds support, it is expected to lead to an attempt to revert to an uptrend.
Otherwise, it is expected to decline to around 18374.1.
The next volatility period is around October 23 (October 22-24).
(1h chart)
The trend is expected to continue in the direction off of the 18895.1-0.786 (19076.8) interval.
The 120EMA (5EMA on the 1D chart) is passing near 19216.3, so holding the price above this point is expected to lead to an attempt to break through the #1 range.
So, when it starts moving above 0.786 (19076.8), the 19216.3 area is the first resistance zone.
As the downtrend is dominant on the 1D chart, if it falls below 18895.1, it is expected to decline to section 3.
However, if they continue to show support near the 18895.1 area, the chances of a reversal will increase.
Summarizing the above,
- If it rises near section 1 and is not supported, the 'SHORT' position will be forcibly liquidated and will fall.
------------------------------
- big picture
I think you need to be supported in the 13K-15K section to gain the strength to rise.
So, whether it rises or falls from its current position, both require a short-term response.
A full-fledged uptrend is expected to begin when it rises above 29K.
------------------------------------------------------------ -------------------------------------------
** All descriptions are for reference only and do not guarantee a profit or loss in investment.
** If you share this chart, you can use the indicators normally.
** The MRHAB-T indicator contains indicators that indicate support and resistance points.
** SR_R_C indicators are displayed as StochRSI(line), RSI(columns), CCI(bgcolor).
** CCI indicator is expressed as overbought range (CCI > +100) and oversold range (CCI < -100).
(Short-term Stop Loss can be said to be a point where profit and loss can be preserved or additional entry can be made through split trading. It is a short-term investment perspective.)
---------------------------------

Bitcoin (BTC) - October 20Hello?
Welcome, traders.
By "following", you can always get new information quickly.
Please also click "Boost".
Have a good day.
-------------------------------------
(USDT 1D Chart)
(USDC 1D Chart)
The rise of the candles of stablecoins such as USDT and USDC means an increase in stablecoins generated by selling coins in the coin market.
In stablecoins, the inflow of new funds is expressed as a rise in the gap.
(NAS100USD 1D Chart)
The key is to find support and move up in the 1.13-0.886 range, the right-hand Fibonacci ratio range.
-----------------------------------------
(BTCUSDT 1D Chart)
Bollinger Bands (60) are starting to converge.
Therefore, the key is whether the price can be sustained above the 60 SMA, the central line of the Bollinger Bands.
For that, it is important to be supported and rise in the section 19176.93-19530.09, which is the volume pfofile section that has been created recently.
If it rises, you should check to see if it is supported by rising above 20050.02-20131.46.
If it fails to do so, it is expected to decline to around 18535.11.
At this point, you need to be careful as it may touch the downtrend line (2) and move up.
In the HA SRRC indicator, the StochRSI indicator is showing a downward trend in the overbought zone.
Therefore, it is necessary to check where support and resistance are found when a decline occurs in the overbought zone.
Since the HA-Low and MS-Signal indicators are passing in the 19176.93-19530.09 section, if support is confirmed in this section, an aggressive buying is possible.
This aggressive buy
Primary resistance: 20050.02-20131.46
Secondary resistance: 20798.16-21838.98
It is expected to receive resistance in either of the two resistance intervals.
The next volatility period is around October 23 (October 22-24).
Therefore, it is necessary to check the movement of volatility that occurs at this time.
The Bollinger Bands (60) span 18353.11-21475.02, so if you don't deviate from that range, you're going to have a boring sidewalk anyway.
------------------------------
- big picture
I think you need to be supported in the 13K-15K section to gain the strength to rise.
So, whether it rises or falls from its current position, both require a short-term response.
A full-fledged uptrend is expected to begin when it rises above 29K.
------------------------------------------------------------ -------------------------------------------
** All descriptions are for reference only and do not guarantee a profit or loss in investment.
** If you share this chart, you can use the indicators normally.
** The MRHAB-T indicator contains indicators that indicate support and resistance points.
** HA SRRC indicators are expressed as StochRSI(line), RSI(columns), CCI(bgcolor).
** CCI indicator is expressed as overbought range (CCI > +100) and oversold range (CCI < -100).
(Short-term Stop Loss can be said to be a point where profit and loss can be preserved or additional entry can be made through split trading. It is a short-term investment perspective.)
---------------------------------

NAS100 and US30 top-down analysisHello traders, this is a complete multiple timeframe analysis of this pair. We see could find significant trading opportunities as per analysis upon price action confirmation we may take this trade. Smash the like button if you find value in this analysis and drop a comment if you have any questions or let me know which pair to cover in my next analysis.

NAS100USD REJECTED BY 10/20 days linesNAS100USD was rejected by 10 and 20 days lines, and was hit hard back under “red-dot” strong resistance line.

Bitcoin (BTC) - October 19Hello?
Welcome, traders.
By "following", you can always get new information quickly.
Please also click "Boost".
Have a good day.
-------------------------------------
(USDT 1D Chart)
(USDC 1D Chart)
You need to be careful when trading as there is an ongoing outflow of funds through USDC.
If the outflow of funds does not stop, the rise of the coin market is bound to be limited.
(NAS100USD 1D Chart)
The key is whether it can gain support from the MS-Signal indicator, rising above 0.886 on the right and 0.5 on the left.
---------------------------------------
(BTCUSDTPERP 1h Chart)
The key is whether you can climb to section 1 or not.
If it falls below 19216.3, it is expected to touch segment 2.
To transition into an uptrend, it needs to rise above 19607.9 and find support.
It previously moved higher near 19216.3, so if it finds support in this area, it is likely to move higher again.
At the time shown on the chart, it turned below the MS-Signal indicator and turned into a downtrend.
However, since this may have occurred because it did not exceed the 0.618 section, it should be interpreted by including support and resistance points in the analysis by the indicator.
Since a volume profile section is being formed in section 1, it is necessary to check whether it is supported in the vicinity of section 1.
If it falls below section 2, there is a high probability that it will fall into sections 3 and 4, so be careful.
The current state is not yet in a downtrend in the sense of reaffirming support.
Since the 120EMA (5EMA on the 1D chart) line is passing near 19355.6 and the 182EMA (26EMA on the 1D chart) line is passing near the 0.5 (19458.6) area, we believe there is still room for an uptrend beyond this section.
------------------------------
- big picture
I think you need to be supported in the 13K-15K section to gain the strength to rise.
So, whether it rises or falls from its current position, both require a short-term response.
A full-fledged uptrend is expected to begin when it rises above 29K.
------------------------------------------------------------ -------------------------------------------
** All descriptions are for reference only and do not guarantee a profit or loss in investment.
** If you share this chart, you can use the indicators normally.
** The MRHAB-T indicator contains indicators that indicate support and resistance points.
** SR_R_C indicators are displayed as StochRSI(line), RSI(columns), CCI(bgcolor).
** CCI indicator is expressed as overbought range (CCI > +100) and oversold range (CCI < -100).
(Short-term Stop Loss can be said to be a point where profit and loss can be preserved or additional entry can be made through split trading. It is a short-term investment perspective.)
---------------------------------

Nasdaq-100 Index (US100) Correction Time?!
Technical analysis on Nasdaq Index.
Price action & key levels.
Local bullish bias explained.
❤️Please, support this video with like and comment!❤️

nasdaq formed Bearish Gartlay Pattern on 1 Hour time frame..nasdaq formed Bearish Gartlay Pattern on 1 Hour time frame..
not a financial advice

Bitcoin (BTC) - October 18Hello?
Welcome, traders.
By "following", you can always get new information quickly.
Please also click "Boost".
Have a good day.
-------------------------------------
(USDT 1D Chart)
(USDC 1D Chart)
The rise of the candles of stablecoins such as USDT and USDC means an increase in stablecoins generated by selling coins in the coin market.
In stablecoins, the inflow of new funds is expressed as a rise in the gap.
The USDT stablecoin is a coin that has an active market on exchanges around the world.
Therefore, the market has a strong influence among stablecoins.
If USDT rises above 68.468B (a rise in the gap should continue), the coin market is expected to rise.
However, the outflow of funds through the USDC stablecoin must be stopped.
Otherwise, the uptrend is expected to be limited.
(NAS100USD 1D Chart)
The key is whether it can support and move higher in the 1.13-0.886 range, the right-hand Fibonacci ratio range.
(DXY 1M chart)
For the dollar to weaken, it is expected that it should fall below the 106.130-108.510 range.
So, the key is whether the 114.315-123.460 zone can find resistance and move down.
-----------------------------------------
(BTCUSDT 1W Chart)
The key is whether the uptrend can continue along the uptrend line (2).
Looking at the HA SRRC indicator, the RSI indicator is still in the oversold zone.
So, when you break out of the oversold zone, you should check to see if you find support near the 19695.87 level.
A volume profile section is being formed at the 20050.02 point.
Therefore, it is important to gain support by rising above 20050.20.
(1D chart)
As it rose above the 19530.09 point, it rose above the MS-Signal indicator.
Therefore, if the price holds above 19530.09, it is expected to turn into an uptrend.
However, in order to continue the uptrend, it must rise above the HA-High indicator, so you need to be careful when trading.
Even if it rose above the HA-High index, there is a resistance section of 20798.16-21838.98, so it is necessary to approach it from a short-term perspective.
The volume profile section is being formed by walking sideways for about 2 months in the current section (19K section).
Therefore, the coin market is expected to accelerate the uptrend if support continues in the current section and the inflow of funds occurs.
As mentioned above, it is not possible to say that the outflow of funds from the coin market has stopped, so even if it shows an upward trend now, it is expected that there will be restrictions on the extent of the increase.
The next volatility period is around October 23rd.
------------------------------
- big picture
I think you need to be supported in the 13K-15K section to gain the strength to rise.
So, whether it rises or falls from its current position, both require a short-term response.
A full-fledged uptrend is expected to begin when it rises above 29K.
------------------------------------------------------------ -------------------------------------------
** All descriptions are for reference only and do not guarantee a profit or loss in investment.
** If you share this chart, you can use the indicators normally.
** The MRHAB-T indicator contains indicators that indicate support and resistance points.
** HA SRRC indicators are expressed as StochRSI(line), RSI(columns), CCI(bgcolor).
** CCI indicator is expressed as overbought range (CCI > +100) and oversold range (CCI < -100).
(Short-term Stop Loss can be said to be a point where profit and loss can be preserved or additional entry can be made through split trading. It is a short-term investment perspective.)
---------------------------------

NAS100USD: Bullish Forecast & Outlook
Our analysis is based on current market fundamental sentiment.
NAS100USD is trading within a demand zone.
Based on our stand point the NAS100USD will rise.
❤️ Please, support our work with like & comment! ❤️

Bitcoin (BTC) - October 17Hello?
Welcome, traders.
By "following", you can always get new information quickly.
Please also click "Boost".
Have a good day.
-------------------------------------
(BTCUSDTPERP 1D Chart)
In order to turn into an uptrend, it must rise above the HA-Low indicator.
Therefore, the key is whether it can rise above 19355.6 and find support.
However, since the conversion of the Heikin Ashi body takes place around 19216.3, it is important whether it is supported around 19216.3.
If it goes down without support, you should see support near the 0.786 left Fibonacci ratio.
If not, there is a possibility that it will fall to around 18374.1.
The size of the wave is gradually decreasing.
That's why you should see price holding above the HA-Low and MS-Signal indicators.
To do this, it is necessary to check whether the price is maintaining above the HA-Low and MS-Signal indicators during the volatility period of October 23rd.
It is important whether this opportunity turns into an uptrend.
(1D chart)
The key is whether it can be supported in the vicinity of 19216.3.
This is because 120EMA, or 5EMA on the 1D chart, is passing near 19216.3.
If it fails to be supported, it is necessary to check whether it is supported in section 2.
If it falls below 18895.1, it is expected to touch segment 3.
------------------------------
- big picture
I think you need to be supported in the 13K-15K section to gain the strength to rise.
So, whether it rises or falls from its current position, both require a short-term response.
A full-fledged uptrend is expected to begin when it rises above 29K.
------------------------------------------------------------ -----------------------------------------------------
** All descriptions are for reference only and do not guarantee a profit or loss in investment.
** If you share this chart, you can use the indicators normally.
** The MRHAB-T indicator contains indicators that indicate support and resistance points.
** SR_R_C indicators are displayed as StochRSI(line), RSI(columns), CCI(bgcolor).
** CCI indicator is expressed as overbought range (CCI > +100) and oversold range (CCI < -100).
(Short-term Stop Loss can be said to be a point where profit and loss can be preserved or additional entry can be made through split trading. It is a short-term investment perspective.)
---------------------------------

Bitcoin (BTC) - October 15Hello?
Welcome, traders.
By "following", you can always get new information quickly.
Please also click "Boost".
Have a good day.
-------------------------------------
(USDT 1D Chart)
(USDC 1D Chart)
The rise of the candles of stablecoins such as USDT and USDC means an increase in stablecoins generated by selling coins in the coin market.
In stablecoins, the inflow of new funds is expressed as a rise in the gap.
(NAS100USD 1D Chart)
The week's candle closed near the 1.13-0.886 range, the right-hand Fibonacci ratio.
If it does not move out of the bearish channel, it is likely to move towards the 9281.8-9379.2 area. (Left Fibonacci ratio: 1.13-0.886 section)
(DXY 1M chart)
In order for the dollar's strength to ease, it is expected that it should fall below the 106.130-108.510 range.
So, the key is whether the 114.315-123.460 zone can find resistance and move down.
-----------------------------------------
(BTCUSDT 1W Chart)
The key is whether the uptrend can continue along the uptrend line (2).
Looking at the HA SRRC indicator, the RSI indicator is still in the oversold zone.
So, when you break out of the oversold zone, you need to check to see if it finds support near 19695.87.
(1D chart)
The upside channel (1), 19695.87 or higher is all that matters.
If it doesn't, it is likely to move towards the 18353.11 area.
Therefore, it is necessary to make sure that it can quickly rise above the rising channel (1), 19426.43.
Looking at the HA SRRC indicator, all indicators appear to be out of the oversold zone.
Therefore, it is important to find support or resistance near 19426.43.
The next volatility period is around October 23rd.
------------------------------
- big picture
I think you need to be supported in the 13K-15K section to gain the strength to rise.
So, whether it rises or falls from its current position, both require a short-term response.
A full-fledged uptrend is expected to begin when it rises above 29K.
------------------------------------------------------------ -------------------------------------------
** All descriptions are for reference only and do not guarantee a profit or loss in investment.
** If you share this chart, you can use the indicators normally.
** The MRHAB-T indicator contains indicators that indicate support and resistance points.
** HA SRRC indicators are expressed as StochRSI(line), RSI(columns), CCI(bgcolor).
** CCI indicator is expressed as overbought range (CCI > +100) and oversold range (CCI < -100).
(Short-term Stop Loss can be said to be a point where profit and loss can be preserved or additional entry can be made through split trading. It is a short-term investment perspective.)
---------------------------------
