BTC - Short Setup at 0.702 Fibonacci & Fair Value GapMarket Context
Bitcoin recently rejected from a major resistance area and has since been retracing downward, finding temporary support inside a bullish Fair Value Gap. The market is currently in a corrective phase, with buyers attempting to defend lower levels while sellers look for optimal positions to reload shorts. This environment shows a classic tug-of-war between these two forces as price moves between supply and demand zones.
Consolidation and Current Phase
Although the prior consolidation has been broken, the current price action can still be described as corrective, with intraday structure forming lower highs. The bullish Fair Value Gap beneath price has been respected so far, creating a temporary base. However, the path remains complex, as the market has unfilled imbalances both above and below.
Bearish Retest Scenario
One key scenario involves a retracement toward the bearish Fair Value Gap near 117K, which also aligns with the 0.702 Fibonacci retracement level. This confluence makes it a high-probability area for sellers to step in again. A rejection from that zone would likely resume the downtrend, with the next logical target being the deeper unfilled bullish Fair Value Gap around 110K. This zone acts as a magnet for price due to the inefficiency left behind during the last rally.
Bullish Defense Scenario
For bulls to regain control, the current Fair Value Gap at 114K must hold, followed by a strong move that invalidates the lower-high structure. Such a move would need to break above the 117K bearish FVG with conviction. Only then could momentum shift back to the upside, opening the door for another challenge of the higher resistance zones.
Final Words
Patience and precision are key when dealing with setups like this. Let the market come to your level — and react with intent.
If you found this breakdown helpful, a like is much appreciated! Let me know in the comments what you think or if you’re watching the same zones.
Nasdaq

I am bullish on GOOGLE stockI am bullish on GOOGLE stock
Following last week's pullback, I see a positive ride back to the all-time high (ATH) around $209 or beyond.
Trade with care.
I look forward to connecting with you.
Please share your thoughts in the comment section, share, like and follow

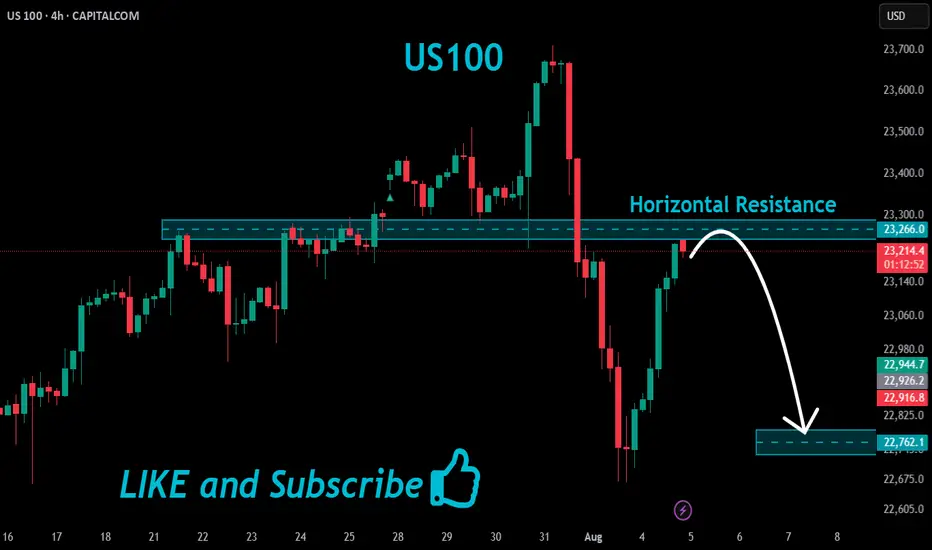
US100 Local Short!
HI,Traders !
#US100 made a retest
Of the horizontal resistance
Of 23266.0 and we are already
Seeing a bearish reaction and
We will be expecting a further
Bearish move down !
Comment and subscribe to help us grow !
Is the NASDAQ Vault Open for a Full Bullish Heist?🧠 NASDAQ Heist Masterplan: Thieves Eye on 24,500 🎯💰
🚨 Asset: NASDAQ100 / US100 / NDX
📊 Plan: Bullish | 🔁 Layering Strategy
🎯 Target: 24,500
🛑 Stop Loss: 22,600
📍 Entry: Any level – the vault’s wide open!
💼 Thief Trader's NASDAQ High-Stakes Robbery Is LIVE! 🤑📈
Welcome, money bandits & market looters! 💼💰
The time has come to launch a full-scale bullish raid on the NASDAQ fortress. We’re not just taking entries — we’re stacking them like a pro with our layered limit order strategy across swing zones. 🔫📉➡️📈
🔓 Entry:
Pick any price! We break in anytime, anywhere.
🔁 Stack your buy limits on 15m–30m swing lows.
🔔 Set your alerts – don’t let the opportunity slip.
🛑 Stop Loss:
Guard your loot at 22,600.
Risk management is the bulletproof vest in this raid. 🎯
Adjust your SL based on lot size and order volume. 📏🔐
🎯 Profit Target:
Thieves retreat at 24,500.
But hey – smart robbers use trailing SL to squeeze every last drop of gold! 🏆💸
💡 Scalpers & Swingers:
Stick to the long side only.
If your pockets are deep – full-send mode ON.
If not, tag along with swing entries. Patience pays big! 💎⏳
📢 Heads Up, Heist Crew:
News drops = landmines. Step carefully.
🚷 No new entries during major announcements.
🛡️ Use trailing SL to defend your profit bags.
🚨 Daily Reminder:
This market isn’t a playground. It’s a battlefield.
Use COT data, macro reports, sentiment scans, and index-specific triggers to fortify your robbery blueprint. Stay smart, stay updated! 📊🧠
💥 Boost Our Loot Crew 💥
Hit that LIKE ❤️ to support the Thief Army!
Stronger visibility = Bigger Loots = More Victory Runs.
See you at the next robbery – we move in silence, but the market hears us loud! 🐱👤💸🔥🚀

NAS100 Trade Idea: Liquidity Sweep & Bullish Reversal Potential📊 NASDAQ 100 (NAS100) Trade Outlook 📈
The NASDAQ 100 is holding a strong bullish trend on the higher timeframes 🟢. However, we’re currently seeing a notable pullback into a key support zone ⚠️ — price has dipped beneath previous lows, tapping into what appears to be an institutional accumulation range 🏦.
This move is likely targeting the liquidity resting below those lows 💧, where sell stops are positioned. Price is also reacting off a significant bullish order block 🧱 — a confluence area that could produce a strong reversal.
🎯 What to look for next:
Wait for a bullish break in market structure 🔁 to confirm a potential entry. If that occurs, consider a long setup with your stop loss below the swing low 🛑 and a 1:2 risk-to-reward target 🎯.
🚫 This is for educational purposes only and not financial advice.

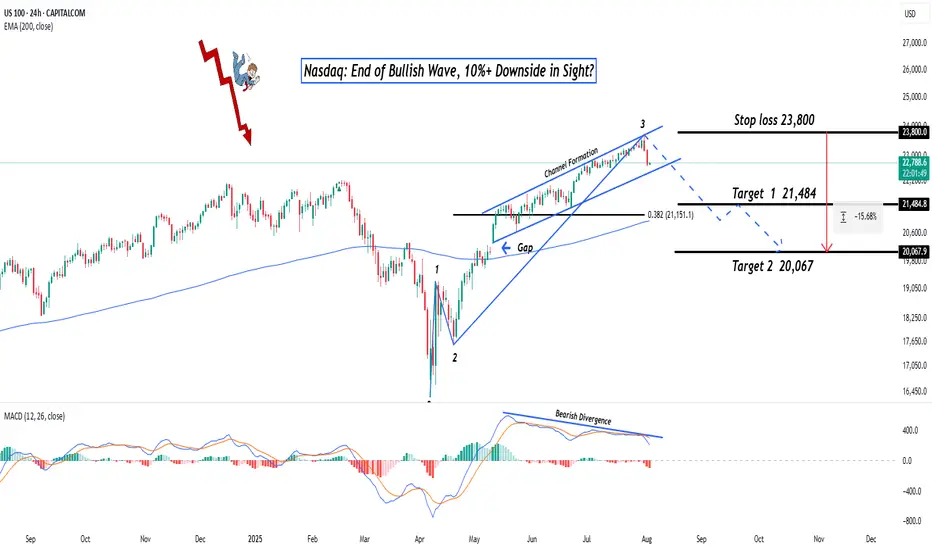
Nasdaq: End of Bullish Wave, 10%+ Downside in Sight?Hey Realistic Traders!
Has CAPITALCOM:US100 (Nasdaq) Finally Peaked? A Reversal Signal Just Flashed. Is This the Turning Point Toward a Deeper Pullback?
Let’s dive into the technicals to see what the chart is really telling us.
Technical Analysis
On the daily chart, the Nasdaq is starting to show signs of weakness. A bearish divergence has formed between the MACD and price movement , which is a classic signal that bullish momentum may be fading. This often indicates the potential for a trend reversal or a deeper correction.
A recent drop, confirmed by a strong bearish full-body candlestick, suggests that selling pressure is increasing. If this continues, we expect a breakdown from the current bullish channel.
In this scenario, the extended Wave 3 may have reached its peak. A correction could follow, with the first target at 21484, which lines up with the 0.382 Fibonacci retracement level. If the decline continues, the next downside target would be around 20067, where a previous gap may be filled.
This bearish outlook remains valid as long as the price stays below 23800 . A move above that level would invalidate the setup and return the outlook to neutral.
Support the channel by engaging with the content, using the rocket button, and sharing your opinions in the comments below.
Disclaimer: "Please note that this analysis is solely for educational purposes and should not be considered a recommendation to take a long or short position on Nasdaq.
NAS100 - Stock Market Heading Down?!The index is trading in its medium-term ascending channel on the four-hour timeframe between the EMA200 and EMA50. However, if the index corrects upward towards the specified supply zone, it is possible to sell Nasdaq with better risk-reward.
In recent days and weeks, the Nasdaq Composite Index once again approached its historic highs, even setting a new all-time record. However, following the latest jobs data and the Federal Reserve meeting, the index experienced a price correction.
Unlike many previous bullish phases that were driven largely by short-term momentum or emotional reactions, the current upward trend in the Nasdaq reflects structural maturity and market stabilization. Institutional capital inflows and strong corporate earnings have together painted a picture of a more stable and predictable future for this index.
According to recent financial data, U.S. equity funds received over $6.3 billion in net inflows during the final week of July—marking the first positive inflow after three consecutive weeks of outflows.
The key engine behind this growth continues to be the robust performance of tech companies. Firms such as Meta, Microsoft, and AI-oriented companies like Nvidia and Broadcom posted exceptionally strong earnings reports. These results not only exceeded analysts’ expectations but also fueled significant gains in their stock prices, contributing to the Nasdaq’s momentum. Despite some sector-specific concerns—for instance, regarding Qualcomm in the semiconductor space—the broader tech sector has sustained its upward trajectory and even extended that momentum to adjacent industries, especially those involved in cloud and AI supply chains.
Meanwhile, advisors to Donald Trump revealed that he plans sweeping reforms at the U.S. Bureau of Labor Statistics (BLS). This announcement followed the July jobs report, which showed only 73,000 new jobs and sharp downward revisions to prior months’ figures.
On Truth Social, Trump accused the current BLS Commissioner, Erica McEnturfer, of politically manipulating employment data and ordered her immediate removal. Secretary of Labor Lori Chavez-DeRemer subsequently announced that Deputy Commissioner William Witrofsky would serve as acting head. Trump emphasized that economic data must be accurate, impartial, and trustworthy—and not politically skewed.
Following this leadership change, a broader debate has emerged around how employment statistics are collected and reported. While statistical revisions have long been a routine, non-political process since 1979, there are now growing questions about whether a better system for gathering and publishing this critical data could be developed.
As a nonpartisan branch of the Department of Labor, the BLS publishes its monthly employment report at 8:30 AM Eastern on the first Friday of each month. The data is gathered from surveys of around 629,000 business establishments.
Analysts have cited several reasons for the frequent need for revisions:
• Late responses from firms
• Delays from large corporations that distort preliminary figures
• Recalculations due to seasonal adjustments (e.g., holidays or weather)
• Demographic shifts impacted by immigration or deportation
• Annual revisions based on finalized tax records
With a relatively light economic calendar in the U.S. this week, traders have turned their focus to the latest developments in trade negotiations—particularly talks with countries that have yet to finalize trade agreements with Washington.
Although the U.S. has reached deals with key partners including the UK, EU, Japan, and South Korea, no formal agreement has yet been made with China to extend the current trade truce, which is set to expire on August 12.
The new U.S. tariff plan proposes a baseline 10% rate for most countries, but some—like India and Switzerland—face much higher rates of 25% and 39%, respectively. However, since implementation of the tariffs has been postponed until August 7, there’s still time for further negotiations and possible rate reductions. Sources close to the White House suggest the administration is eager to continue talks.
What’s now becoming clear is the sheer magnitude of the proposed tariff shifts—far beyond pre-trade-war averages. These changes could have more severe consequences than previously estimated, potentially pushing up U.S. inflation while simultaneously threatening global growth. As such, markets may be entering a fresh wave of volatility.
Compounding these concerns is the U.S. Treasury’s upcoming bond issuance schedule, which could add to market instability.
Also on the radar is the ISM Services PMI for July, due Tuesday. Its results will be closely watched for signs on the U.S. dollar’s direction and the Fed’s potential actions at its September meeting.
Notably, as of July 18, 2025, the widely-followed Buffett Indicator—measuring the ratio of market capitalization to GDP—was 2.3 standard deviations above its historical average. This level surpasses even the dot-com bubble era of the early 2000s. The indicator is now firmly in the “overvalued” zone, which often precedes market corrections or even crashes. For context, during the 2008 financial crisis, it was roughly 1.5 standard deviations below the historical norm.

NASDAQ: Bears In Control! Sell it!Welcome back to the Weekly Forex Forecast for the week of Aug 4 - 8th.
In this video, we will analyze the following FX market:
NASDAQ (NQ1!) NAS100
The NAS 100 was weakened by bad job numbers, mixed earnings reports, and tariff wars. In the short term, it is bearish. Sell it down to the Weekly/daily +FVG for high probability buys from those levels.
Buying at current levels is not advised. Wait for a valid market structure shift to the upside before going long.
Enjoy!
May profits be upon you.
Leave any questions or comments in the comment section.
I appreciate any feedback from my viewers!
Like and/or subscribe if you want more accurate analysis.
Thank you so much!
Disclaimer:
I do not provide personal investment advice and I am not a qualified licensed investment advisor.
All information found here, including any ideas, opinions, views, predictions, forecasts, commentaries, suggestions, expressed or implied herein, are for informational, entertainment or educational purposes only and should not be construed as personal investment advice. While the information provided is believed to be accurate, it may include errors or inaccuracies.
I will not and cannot be held liable for any actions you take as a result of anything you read here.
Conduct your own due diligence, or consult a licensed financial advisor or broker before making any and all investment decisions. Any investments, trades, speculations, or decisions made on the basis of any information found on this channel, expressed or implied herein, are committed at your own risk, financial or otherwise.

Important Resistance Ahead!VAL (Valaris Limited)
Closed at 45.28 (01-08-2025)
a Very Strong Resistance lies around 48 - 50.
Crossing this level with Good Volumes may
lead it towards 55 - 56 & then towards 62 - 65.
However, if 27 is broken, we may witness more
Selling Pressure.

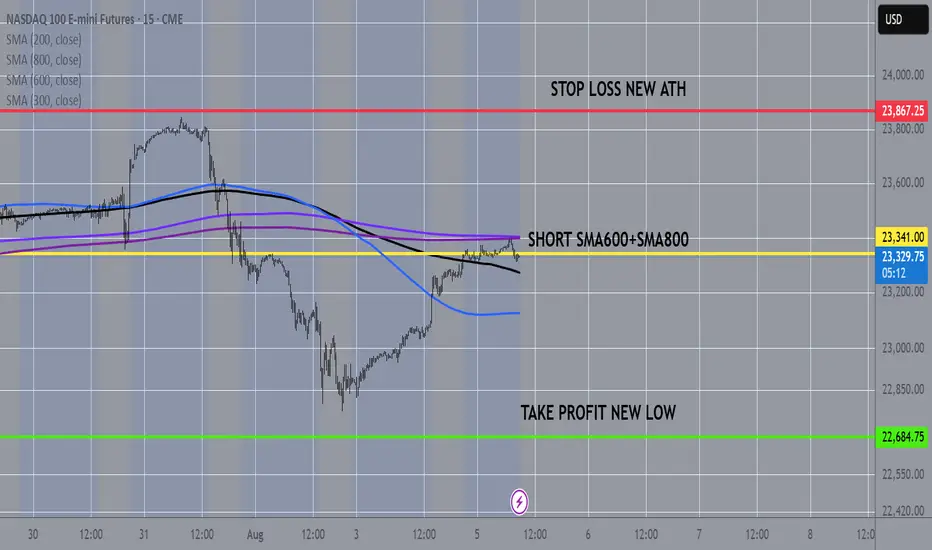
NASDAQ100 15MIN CHART FROM SMAS TO NEW LOWNasdaq100 at 10 and 15min chart touches the sma600 and the sma800 so as in many other cases before, odds are are more that it will fall from here to a new low
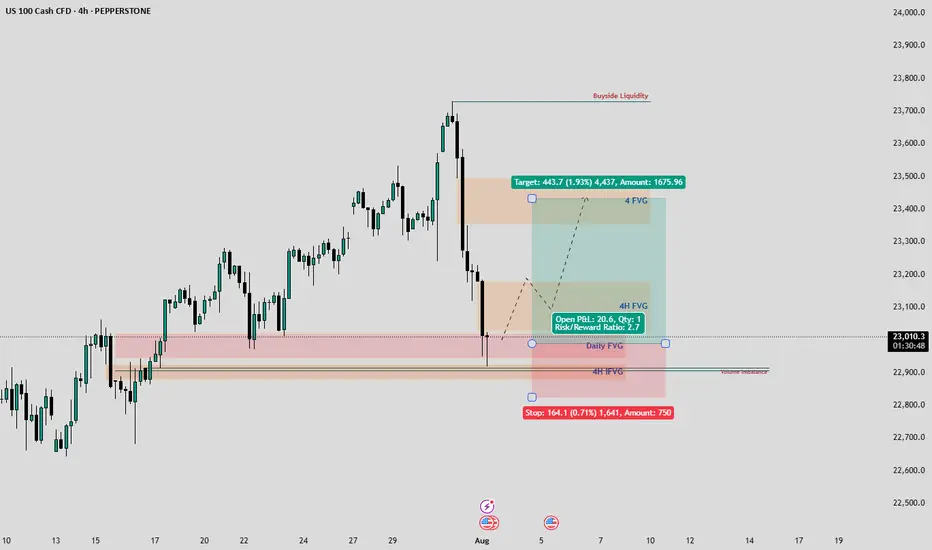
NASDAQ Week 32 OutlookOn the US Nas 100 1-hour chart, a bearish breakout from a symmetrical triangle suggests downward momentum. The Fair Value Gap at 23,500.0 is a pivotal level—watch for a breakout and retest here to confirm sell entries. Aim for the target at 22681.1, with a stop-loss at 23,740.4 to protect against adverse moves.

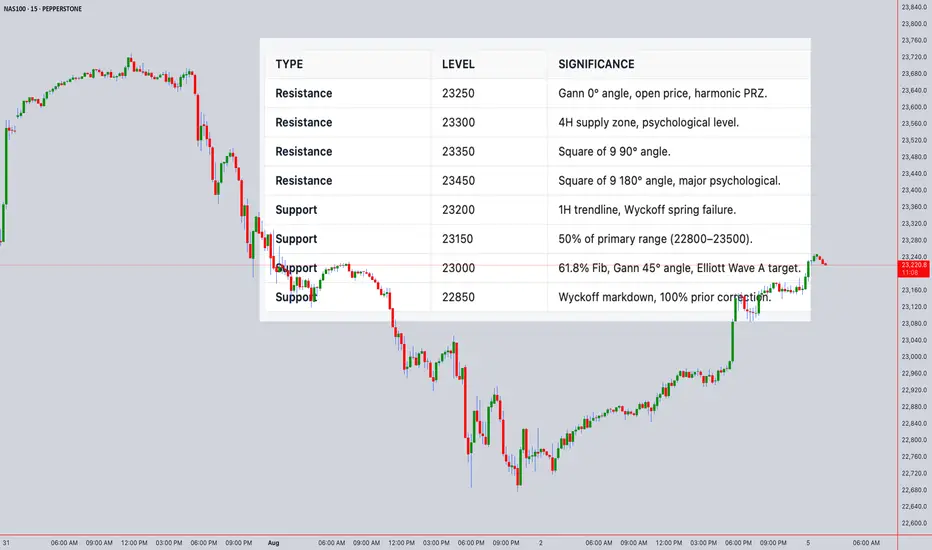
Technical Analysis Forecast for NAS100Open Price: 23242.3 (UTC+4)
1. Japanese Candlestick Analysis
4H/1H: Price opened at 23242.3 near resistance (23250–23300). Recent candles show bearish harami (4H) and dark cloud cover (1H), signaling rejection.
30M/15M: Gravestone doji at 23242.3 and three black crows indicate strong bearish momentum.
5M: Shooting star formation suggests exhaustion. Failure to close above 23250 confirms weakness.
Outlook: Bearish reversal likely if 23200 breaks.
2. Harmonic Patterns
4H/1H: Bearish Butterfly Pattern completing at 23242.3 (D-point).
PRZ: 23240–23250 (confluence of 127.2% XA and 161.8% BC).
Fibonacci Ratios: AB=CD symmetry (23240–23250).
30M: Bullish Crab forming at 23100, but secondary to larger bearish setup.
Outlook: High-probability short entry at 23240–23250 with target 23000.
3. Elliott Wave Theory
4H: Wave 5 of impulse cycle peaked at 23242.3.
Structure: Completed 5-wave sequence from 22800 → 23242.3.
Corrective Phase: ABC pullback targeting 23000 (Wave A) and 22850 (Wave C).
1H: Sub-wave (v) of 5 ending at 23242.3. RSI divergence confirms exhaustion.
Outlook: Bearish correction to 22850–23000 within 24 hours.
4. Wyckoff Theory
Phase: Distribution (after markup from 22800 → 23242.3).
Signs: High volume at 23242.3 (supply), upthrust above 23300 failed.
Schematic: Phase C (markdown) initiating.
1H/30M: Spring at 23200 failed to hold, indicating weak demand.
Outlook: Break below 23200 triggers markdown to 23000.
5. W.D. Gann Theory
Time Theory
24H Cycle: Key reversal windows:
UTC+4: 08:00–10:00 (resistance test), 14:00–16:00 (trend reversal).
Square of 9: 23242.3 aligns with 0° angle (resistance).
Square of 9
23242.3 → Resistance Angles:
0° (23250), 90° (23350), 180° (23450).
Support: 45° (23000), 315° (22850).
Price Forecast: Reversal at 23250 (0° angle).
Angle Theory
4H Chart: 1x1 Gann Angle (45°) from 22800 low at 23000. Price above angle = bullish, but overextended.
1H Chart: 2x1 Angle (63.75°) at 23242.3 acting as resistance.
Squaring of Price & Time
Price Range: 22800 → 23242.3 (442.3 points).
Time Squaring: 442.3 hours from 22800 low → 23250 resistance (442.3 points ≈ 442.3 hours).
Harmony: 23242.3 = Time Cycle Peak (24H from open).
Ranges in Harmony
Primary Range: 22800–23500 (700 points).
50% Retracement: 23150 (support).
61.8% Retracement: 23000 (critical support).
Secondary Range: 23000–23300 (300 points).
Key Levels: 23150 (50%), 23000 (61.8%).
Price & Time Forecasting
Price Targets:
Short-Term: 23000 (61.8% Fib, Gann 45° angle).
Extension: 22850 (100% of prior correction).
Time Targets:
First Reversal: 8–12 hours from open (UTC+4 12:00–16:00).
Second Reversal: 20–24 hours (UTC+4 00:00–04:00 next day).
Synthesized 24H Forecast
Bearish Scenario (High Probability)
Trigger: Break below 23200 (confirmed by 1H/30M close).
Targets:
T1: 23000 (61.8% Fib, Gann 45° angle).
T2: 22850 (Wyckoff markdown, Elliott Wave C).
Timeline:
8–12H: Drop to 23000 (UTC+4 12:00–16:00).
20–24H: Test 22850 (UTC+4 00:00–04:00 next day).
Confirmation: RSI <50 on 1H, volume spike >25% average.
Bullish Scenario (Low Probability)
Trigger: Sustained close above 23300 (Gann 0° angle).
Targets: 23350 (90° angle), 23450 (180° angle).
Timeline: 12–16 hours (if 23300 breaks).
I am buying AMAZONI am buying AMAZON
Amazon's stock lost over 10% last week, marking a significant decline within just one week.
I will start buying using dollar cost averaging (DCA) with $240 as my long-term to mid-term target.
I will hold
Please like, share, comment and follow.
I look forward to connecting with you

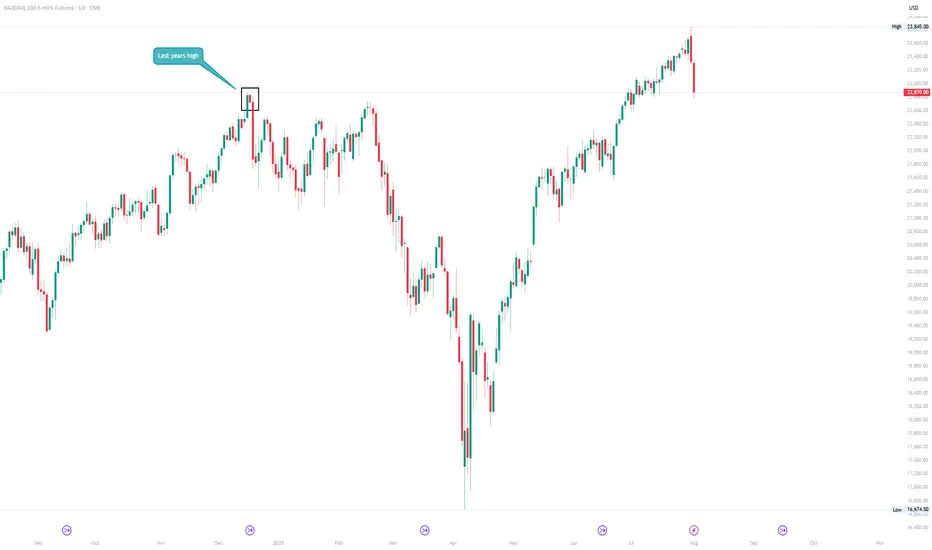
E-Mini Nasdaq Futures Markets Close at a Major Inflection PointAs the new month begins, the market just closed right at last year’s high, a critical level that could act as either resistance or new support.
These return-to-origin zones aren’t random. They often mark key decision points for institutional capital.
The question now:
Does this level hold as a launchpad, or does it reject?
What to watch :
VIX curve: contango or hedging pressure?
Bond market: confirming risk-on or signaling caution?
Breadth: is this rally broadening or narrowing?
No need to predict. Let price and flow do the talking.
See you on the inside. CME_MINI:NQ1!
Beautiful Bullish Divergence on Bigger tf.TNON
CMP 1.46 (03-08-2025)
Beautiful Bullish Divergence on Bigger tf.
However, this time it should not break 0.80;
otherwise we may witness further selling pressure.
Immediate Resistance seems to be around
2.50 - 3.50

UPDATEFriday we closed on the breakeven after that the price reached our 50% level of the trade, so our TP was raised to the breakeven.
Follow for more trades to catch up the next week!

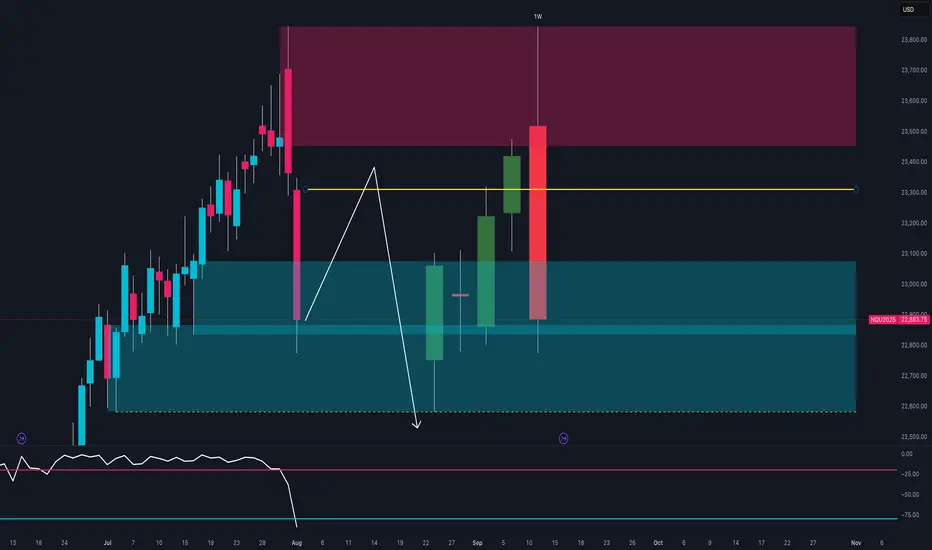
NASDAQ at Key Turning Point 🔍Technical Context
After testing the 23,600–23,800 supply zone, price printed a strong bearish rejection with a weekly engulfing candle.
The RSI broke decisively below the midline, signaling a clear loss of momentum.
Price is now trading back within the weekly demand zone between 22,800 and 22,950.
If a pullback toward 23,200 occurs, it could offer a fresh short opportunity, with downside targets around 22,600.
🪙 COT Report – July 29
Non-Commercials (speculators):
Long: +8,581
Short: +4,355
Commercials (hedging):
Long: +4,955
Short: +8,556
The market remains net long, but commercials are increasingly hedging with shorts.
The current imbalance — 88.6% long vs 11.3% short — suggests excessive bullish positioning, raising the risk of a correction.
🗓️ Seasonality – August
August is historically strong for the NASDAQ:
+222 pts (10Y)
+400 pts (5Y)
+912 pts (2Y)
While the trend is clearly bullish seasonally, caution is warranted:
Tops are often formed during the first half of August, followed by more pronounced corrections in September.
📉 Operational Summary
Primary scenario:
Wait for a retest of the 23,200–23,250 area
Look for rejection signals → enter short
Target 1: 22,800
Target 2: 22,600
Alternatively:
If 22,800 breaks on a strong weekly close, deeper downside scenarios may unfold.
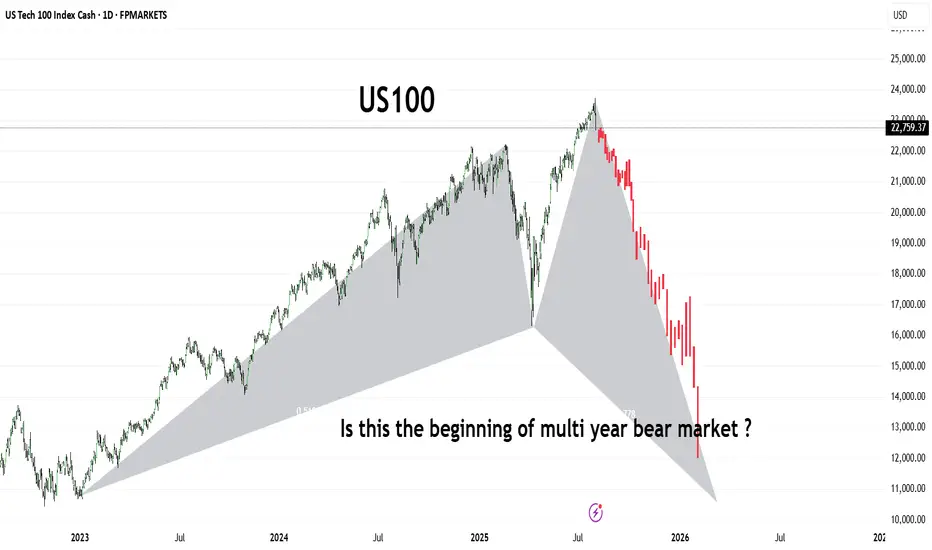
US100The US100 (Nasdaq 100) has shown a dramatic shift in trend, forming what appears to be a large-scale bearish harmonic pattern or potential M-top structure. After reaching its peak in mid-2025, the index has entered a sharp downward trajectory, shedding significant value in a short span.
This chart raises a critical question for long-term investors and traders:
Are we witnessing the early phase of a prolonged bear market that could stretch into 2026 and beyond?
🔻 Key Observations:
Bearish structure developing with aggressive selling pressure.
Potential breakdown from long-term support trendlines.
Momentum suggests institutional risk-off behavior.
Stay alert for macroeconomic cues, interest rate policy, and earnings season signals. A break below 13,000 could confirm a deeper bear cycle
OUR TRADE TODAY ON NASDAQBeen a while since I last posted here, today I’m sharing with you our trade we took 15min ago with an RR of 3
Follow for more

NASDAQ & NFP- I expect BullishnessHello fellow traders,
Today is NFP and I expect a bulishness as per my PD Arrays analysis. Lets se if it words out.
I have higlighted all important PD Arrays in my chart, keep an eye.
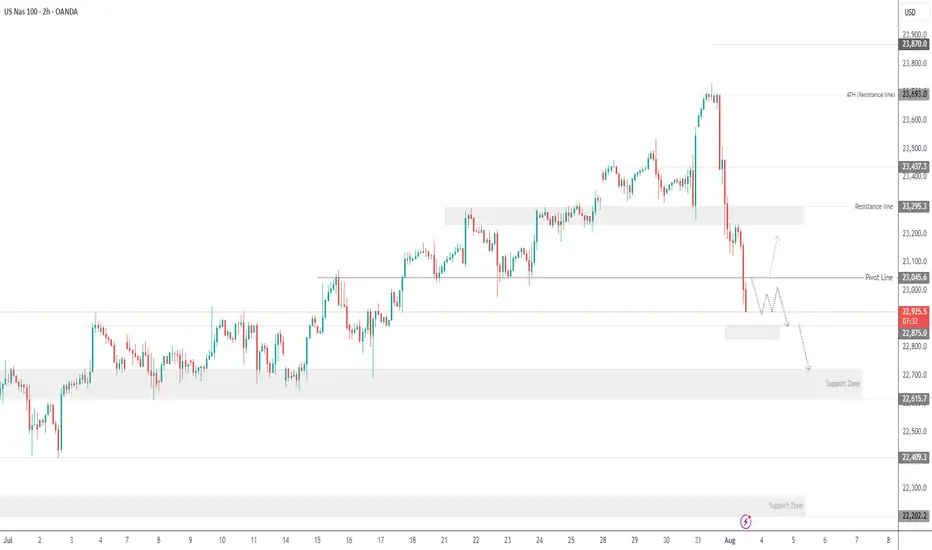
USNAS100 - Tech Weakness & Tariffs Drag NASDAQ LowerTariff Day Pressure Builds as Amazon Miss Weighs on Markets
Markets were hit by a wave of risk-off sentiment on Friday as renewed tariff headlines, weakness in pharma stocks, and a disappointing earnings report from Amazon clouded investor confidence. All this comes just ahead of the U.S. jobs report, which is expected to challenge the market's already diminished expectations for Fed rate cuts.
While macro markets appeared resilient earlier in the week, Wall Street futures and global equities turned cautious as sentiment deteriorated.
NASDAQ – Technical Outlook
The NASDAQ has dropped nearly 850 points from its recent all-time high of 23690, as anticipated in previous updates. The index remains under bearish pressure.
For today, the market is expected to remain sensitive due to recent macro and earnings-driven volatility.
If the price breaks below 22875, the decline is likely to extend toward 22710, with a deeper support zone at 22615.
To shift back to a bullish bias, the index must break and close above 23045 on the 1H chart.
Support Levels: 22875 • 22710 • 22615
Resistance Levels: 23140 • 23240 • 23320
Bias: Bearish while below 23045
Bullish confirmation: 1H close above 23045
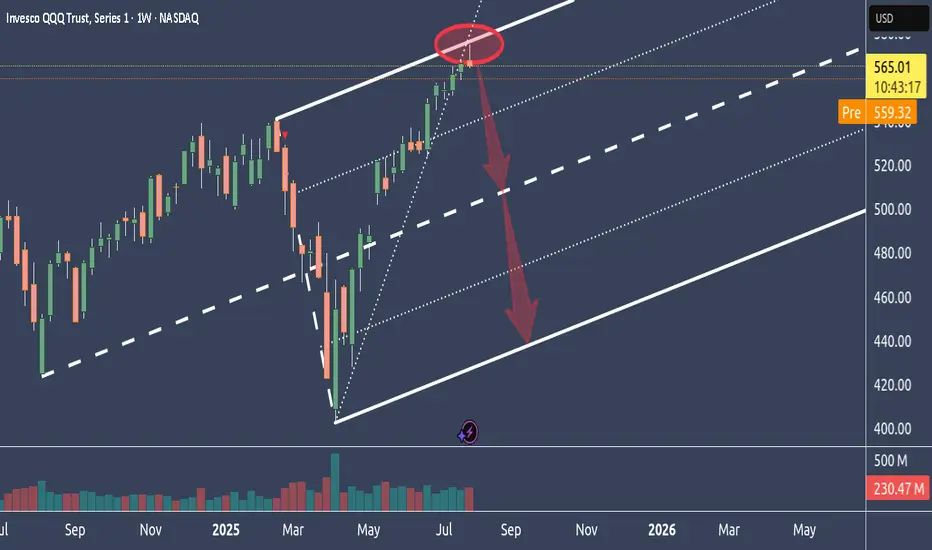
Why NQ is probably tanking big timeIn this weekly chart, we see QQQ, which represents the Nasdaq.
As we can see, it had a hell of a run up.
Too far too fast IMO, and it reached the stretch level at the Upper Medianline Parallel.
The natural move is now to let go, take a breath and trade down to center again, which is the Centerline.
After all the most major and most important earnings results are over, and Funds have pumped up their gains through manipulative Options plays, it's time to reap what they have planted and book the gains.
It's all in line with, all moves are at the point, and everything is showing in a simple chart.
Unless price is opening and closing outside of the U-MLH, it's time to load the Boat and sail to the South.
Fibonacci Retrace Strategy NAS100 Trade Idea📈 NASDAQ 100 (NAS100) is holding a strong bullish trend 🚀. After a weekend gap-up 🕳️➡️📈, price retraced back into the gap zone—exactly what you'd expect in a healthy trending market.
🔍 I'm applying my Fibonacci Expansion + Retrace Strategy 🔢, watching closely for a pullback into equilibrium ⚖️ within the previous price swing. That’s where I’ll be waiting for a bullish market structure break 🔓📊 to confirm my long bias.
🧠 Patience is key here—let the setup come to you.
📌 As always, this is not financial advice!
