Nasdaq

NASDAQ Long-term looks brighter than ever!Nasdaq (NDX) has been trading within a massive Channel Up since the bottom of the 2008 U.S. Housing Crisis and during the April 07 2025 bottom, a very distinct bullish signal emerged.
The index hit its 3W MA50 (blue trend-line) for the first time since May 2023. As you can see, since the 2008 Crisis, every time the market rebounded after hitting the 3W MA50, it posted a rise of at least +62.06% before the next time it touched it (and that was on the highly irregular COVID crash).
As a result, we expect to see NDX hit at least 26500 (+62.06%) before a new 3W MA50 test. Chances are we see the market move much higher though.
Note also the incredible bounce it made on the 3W RSI 14-year Support Zone.
-------------------------------------------------------------------------------
** Please LIKE 👍, FOLLOW ✅, SHARE 🙌 and COMMENT ✍ if you enjoy this idea! Also share your ideas and charts in the comments section below! This is best way to keep it relevant, support us, keep the content here free and allow the idea to reach as many people as possible. **
-------------------------------------------------------------------------------
💸💸💸💸💸💸
👇 👇 👇 👇 👇 👇

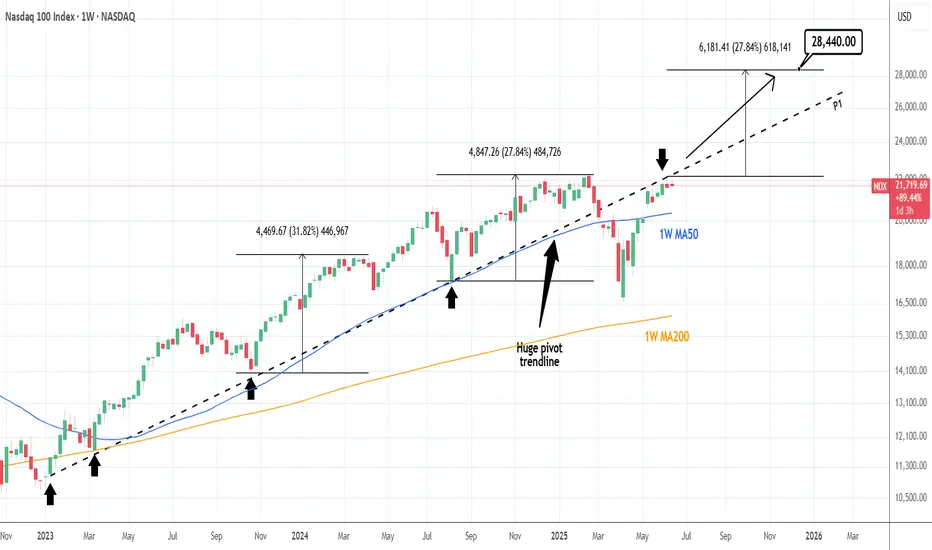
NASDAQ: Huge pivot can catapult it if broken.Nasdaq has turned neutral again on its 1D technical outlook (RSI = 54.712, MACD = 377..560, ADX = 20.644) as it has been struggling to cross above a hidden trendline, the Pivot P1 that was at the start of this Bull Cycle a support and after the trade war acts now as a resistance. If broken, we anticipate a +27.84% rise at least (TP = 28,440), which may very well be an end of year target.
## If you like our free content follow our profile to get more daily ideas. ##
## Comments and likes are greatly appreciated. ##

US100 / NASDAQ TodayUS100 / NASDAQ Today is still bearish
My SSM Reversal Pattern is comming.
This is just my view of course

Apple Near Key Support — Long Setup DevelopingIntroduction:
Apple NASDAQ:AAPL is approaching a critical support zone that has consistently held over the past two months. As price retraces toward this level, it presents a potential long opportunity for traders looking to position ahead of the next bullish leg.
Technical Setup:
Support Zone: $193 – $196
This area has acted as a strong demand zone, providing multiple bounce points since April.
Price is now pulling back into this region, offering a potential entry for a long trade.
Trade Idea:
Entry: $193 – $196 (on confirmation of support holding)
Take Profit Targets:
First Target: $210 – $215
Second Target: $225 – $233
Stop Loss: Just below $184 (to protect against a breakdown from support)
#AAPL #Apple #Stocks #TechnicalAnalysis #SupportZone #LongSetup #TradingStrategy #NASDAQ #TechStocks #RiskReward

NASDAQ - UniverseMetta - Signal#NASDAQ - UniverseMetta - Signal
D1 - Formation of a narrowing diagonal + price broke through the lower trend line through a 3-wave structure. It is better not to increase risks. Stop behind the maximum of the 1st wave.
Entry: 21509.0
TP: 20986.3 - 20372.2 - 19784.5 - 18396.7
Stop: 22160.6

NASDAQ 2 Expected Scenarios Very Clear , Which One You Prefer ?Here is my opinion on Nasdaq on 4H T.F , The price still below my res so we can sell it if the price touch the res level again , and if we have a daily closure above my res then we can buy it with retest for the broken res , so it`s very easy if we still below the res we can sell and if we going up it we can buy it . but we need a daily closure above first .


NASDAQ 100 Under Pressure –Watching 21470 Break for ContinuationUSNAS100 – Technical Overview
USNAS100 has reached the support level we highlighted yesterday and continues to trade within a bearish trend, especially after confirming a 1H close below 21635.
Bearish Outlook:
As long as the price remains below 21635, the next target is 21470.
A break below 21470 would confirm further downside toward the support zone at 21375 and 21250.
Bullish Scenario:
Bullish momentum may return if the price breaks above 21635 on the 1H timeframe, targeting 21780 and potentially 21930 and 22090.
• Support: 21470 / 21375 / 21250
• Resistance: 21780 / 21930 / 22090

example of how to trade this is 1 ex of how to use alarms and think when u trade. identify high and lows setting alarms, triggers and setups , freeroll

Nasdaq - This starts the next +50% rally!Nasdaq - TVC:NDQ - might break out soon:
(click chart above to see the in depth analysis👆🏻)
Despite the quite harsh correction of about -25% which we saw in the beginning of 2025, the Nasdaq is clearly heading for new all time highs. It sounds almost incredible but if the Nasdaq breaks above the current confluence of resistance, a breakout rally of +50% will follow thereafter.
Levels to watch: $21.500, $33.000
Keep your long term vision!
Philip (BasicTrading)

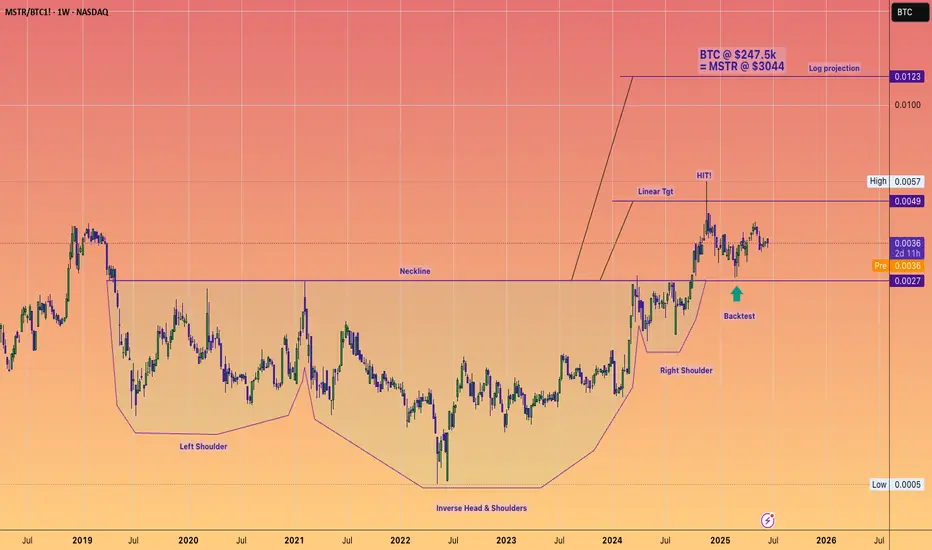
Could Microstrategy be a 1 Trillion dollar mcap company?!Microstrategy and Michael Saylor evoke a spectrum of opinions, with analysts offering a diverse range of potential future valuations.
High risk, high reward!
The destiny of Microstrategy’s market capitalization is clearly linked to Bitcoin’s performance. The company has been utilizing debt to acquire the cryptocurrency, aiming to create significant spreads. This leverage is the reason why the stock has significantly outperformed Bitcoin throughout 2024.
I am confident that Bitcoin can indeed reach $200k, with a potential upper price target of $250K for this cycle, indicating a potentially explosive Q3 and Q4.
The lingering question is how much additional FOMO and premium Saylor can cultivate for his leveraged vehicle in such an environment?
That's why charting is such a key component to any personal investing strategy IMHO, as we navigate these markets.
NASDAQ Consolidation: Why Sitting Out Is Sometimes the Best PlayI'm currently monitoring the NASDAQ (US100) closely, and on the 4-hour chart, we can clearly see that the market is in a phase of consolidation 🔍
Yesterday, I was anticipating a bullish breakout, which could have signaled the start of a structure with higher highs and higher lows — something that would have presented a clean long opportunity 📈. However, during the U.S. session, the NAS100 momentum shifted and we instead saw a bearish breakdown, invalidating the previous setup 🚫
As things stand now, there's no clear directional bias on the 4H — just a sideways range with neither bulls nor bears in full control 🤝. This type of environment calls for patience and discipline.
It's worth noting that knowing when not to trade is just as important as knowing when to pull the trigger. Sitting on the sidelines and allowing the market to make the next move — whether that’s a break above or below this consolidation range — is a valid and often wise decision 🧘♂️📊
At the moment, my preference is to remain neutral and let price show its hand before committing to a position.
⚠️ Disclaimer:
This analysis is for educational purposes only and does not constitute financial advice. Always do your own research and apply proper risk management when trading.

NQ Bulls Teasing a Breakout – But Watch That 4H RSI Divergence We’re at a decision point here on NQ.
📌 Bullish case: We’ve got a clean inverse H&S on the 5-min sitting right on the weekly pivot. If we reclaim the daily pivot and the 30-min VWAP (red line), we could get a squeeze toward 21,960, where prior supply sits.
📉 Bearish case: A break below 21,650 cracks the head and confirms downside toward 21,480.
⚠️ Don’t ignore that 4H RSI divergence. Momentum is fading. If buyers want this, they’ve got to show up now.
📊 Timeframes used:
4H: macro momentum divergence
30M: chop zone with directional potential
5M: inverse H&S near key support
1M: low timeframe momentum shift
🔭 Scenarios plotted for both directions. Choose your trigger.
#nasdaq #futures #MNQ #tradingstrategy #priceaction #headandshoulders #vwap

2025-06-17 - priceactiontds - daily update - nasdaq
Good Evening and I hope you are well.
comment: Big up, big down, big confusion. Market rallies 500 points yesterday and today we get a late bear breakout and close below 22000. Traps on both sides and I am not believing in bear strength what so ever. I see this as a triangle and 22000 is the middle. Chop chop.
current market cycle: trading range
key levels: 21700 - 22300
bull case: Bulls want to stay above 21900 and print a higher low to then re-test 22300. Today they were weak and let the bears close below 22000 which was unexpected, giving yesterday’s bullishness. Tomorrow we have FOMC and I doubt market can move far from 22000 tomorrow. Any longs closer to 21800 make sense.
Invalidation is below 21680.
bear case: Bears left behind a gap up to 22015 but I doubt it can stay open. We have to decent trend lines below us and bears would need to break strongly below 21900 to try and go for 800 or even 700. Bears do not have any arguments to go below 21700 so I won’t make up any. That doesn’t mean it can not happen but it’s unlikely.
Invalidation is above 22230.
short term: Completely neutral around 22000. Only interested in longs below 21900 and shorts closer to 22100.
medium-long term - Update from 2024-06-15: Daily close below 21450 is my validation for the new bear trend which has the first bigger target at 21000 but I think we will printed below 20000 again this year. Structure is obviously not yet bearish, so don’t be early if you want confirmation and can’t/won’t scale in to shorts higher.
trade of the day: Buy low, sell high and scalp. Clear range 22000 - 22100 and the late bear breakout was ok if you made your money before. I do think it was unusual that we did not close the gap to y close 22176.

NASDAQ 100 Bullish Breakout Potential: What to Watch NextI'm currently monitoring the NASDAQ 100 (NAS100) very closely. Building on yesterday’s outlook, we've now seen a clear bullish structural shift — price is holding firm above a recent higher high and higher low, suggesting the early stages of a potential trend continuation 📈
Zooming into the 30-minute chart, we can track price action more precisely. I’m watching for a decisive break above the current range high on this timeframe. If we get the break → retest → rejection pattern, this would confirm bullish momentum and provide a long opportunity 🚀
Should this scenario play out, we could also see JPY pairs strengthen to the upside, as a risk-on sentiment flows through the markets 🧭
🔍 This setup is developing — as always, patience and precision are key.

AAPL — Broadening Range and Accumulation Phase. Targeting $300Apple stock has been moving in a broadening pattern for an extended period, showing signs of accumulation. This price behavior suggests a potential bullish breakout. The upside target in the coming months is around $300, possibly by fall or winter. However, a corrective scenario remains on the table, with a potential pullback toward the $165–144 range, which could present a strong long entry opportunity. From a fundamental perspective, investor interest is likely to increase ahead of Apple’s expected product presentation in the fall, which historically supports bullish sentiment in the stock.

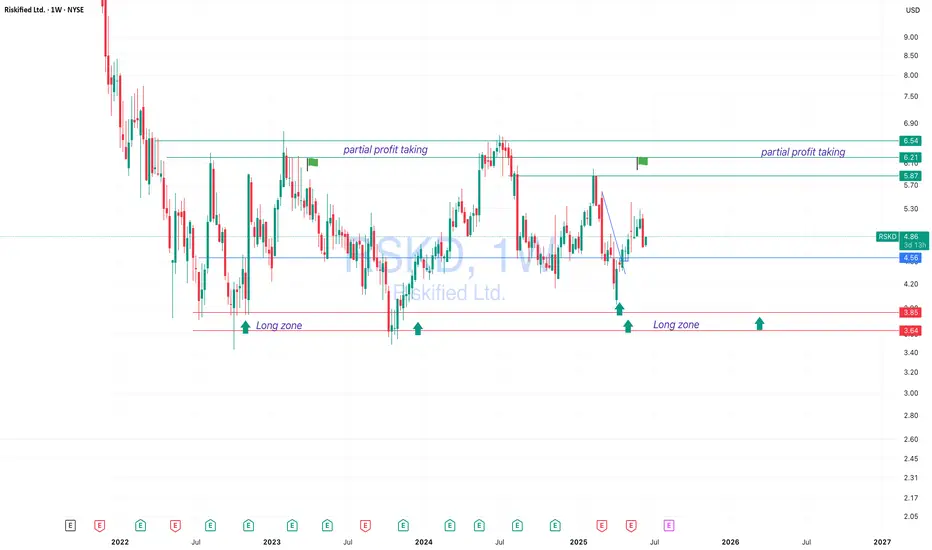
RSKD — 50–100% Return Potential Within a YearRiskified Ltd. (RSKD)
has been trading in a consistent long-term range, cycling between lows of 3.65–3.85 and highs of 6.20–6.54 approximately every 6 to 12 months.
This presents a swing opportunity with potential gains of up to 100%. We are currently mid-range and already in the trade, but as US indices show strength, additional buy setups may develop on retracements.
Fundamentally, investor interest in RSKD is supported by the growing demand for fraud prevention and identity verification solutions in e-commerce, client base expansion, and renewed attention to tech stocks during a potential sector recovery. Estimated holding time is 6–12 months.
Markets rally as missiles fly | how long can risk be ignored? Markets may be underpricing Israel and Iran risk.
Despite continued fighting—including high-impact strikes and rising casualties—global equities moved higher to start the week.
U.S. indices led the advance, with the Nasdaq gaining 1.5%, followed by the S&P 500 and Dow. Earlier in the session, European and Asian markets also closed higher, with Germany’s DAX up 0.8% and Japan’s Nikkei rising 1.3%. Now Asian markets are set to open for the second trading day of the week.
Tensions escalated further on Monday as Israel launched drone strikes on Iran’s state-run IRINN television headquarters in Tehran, interrupting a live broadcast. Additional Israeli attacks hit the South Pars gas field. In retaliation, Iran launched a fresh wave of missile attacks into Israel, killing at least five people.

NASDAQ Close to the 1st 1D Golden Cross in 2 years!Nasdaq (NDX) has been trading within a Channel Up since the December 2022 Low and is currently extending the gains of the latest Bullish Leg.
At the same time it is about to form the first 1D Golden Cross in more than 2 years (since March 08 2023). The last two major Bullish Legs of this pattern, before the previous one was interrupted by the Trade War, were pretty symmetrical, peaking at +49.21% and +47.47% respectively.
If the current one follows the +47.47% 'minimum', we should be expecting Nasdaq to hit 24000 by late Q3.
-------------------------------------------------------------------------------
** Please LIKE 👍, FOLLOW ✅, SHARE 🙌 and COMMENT ✍ if you enjoy this idea! Also share your ideas and charts in the comments section below! This is best way to keep it relevant, support us, keep the content here free and allow the idea to reach as many people as possible. **
-------------------------------------------------------------------------------
Disclosure: I am part of Trade Nation's Influencer program and receive a monthly fee for using their TradingView charts in my analysis.
💸💸💸💸💸💸
👇 👇 👇 👇 👇 👇

Conditions For A Pullback In The NASDAQ 100 Are PresentAll the conditions for a reversal in the NASDAQ 100 appear to be in place, but just because these conditions are present doesn’t mean a reversal must occur. The most obvious condition is the presence of a rising wedge, which formed over the past month and broke on Friday. Whether this pattern entirely unfolds remains to be seen, but there is supporting evidence suggesting it may.
Momentum, as measured by the Relative Strength Index, has clearly been trending lower since peaking on May 19, even as the price of the NASDAQ 100 has continued to rise—a classic bearish divergence.
Over the same period, we’ve observed the NASDAQ rising on decreasing levels of volume—another characteristic of a rising wedge pattern. Then, on Friday, the index broke below the lower boundary of the wedge. The wedge measures approximately 7% from its bottom to the top, suggesting that if the pattern fully plays out, the NASDAQ could decline back to around 20,350. It is also worth noting that there is a gap on the chart at 20,150, which could potentially be filled during such a pullback.
However, that doesn’t mean a decline will be straightforward, because, for now at least, the NASDAQ has found support at the 20-day moving average at 21,514. The NASDAQ will therefore need to break through this strong support level for a deeper decline to occur. In fact, the NASDAQ has not traded below its 20-day moving average since April 23.
While all the conditions for a break from the NASDAQ’s rising wedge are present and appear on the verge of unfolding, the market still has much to prove before the bearish scenario can fully materialize.
Written by Michael J. Kramer, founder of Mott Capital Management.
Disclaimer: CMC Markets is an execution-only service provider. The material (whether or not it states any opinions) is for general information purposes only and does not take into account your personal circumstances or objectives. Nothing in this material is (or should be considered to be) financial, investment or other advice on which reliance should be placed.
No opinion given in the material constitutes a recommendation by CMC Markets or the author that any particular investment, security, transaction, or investment strategy is suitable for any specific person. The material has not been prepared in accordance with legal requirements designed to promote the independence of investment research. Although we are not specifically prevented from dealing before providing this material, we do not seek to take advantage of the material prior to its dissemination.

Nasdaq Challenges Record HighsNasdaq continues to trade just below a one-month resistance line, which connects consecutive higher highs formed between May and June 2025. This line has capped the index just shy of the 22,000 mark, as price action navigates the push and pull between summer momentum, geopolitical tensions, and economic uncertainty.
To the upside, a decisive break and hold above 22,200 would be a bullish trigger, potentially opening the path toward the 23,700 resistance zone. This level notably aligns with the 0.618 Fibonacci extension, projected from the 2023 low, 2025 high, and 2025 retracement low.
On the downside, risks remain for a deeper correction if the index retraces toward the 21,000–20,600 region. This zone represents the neckline of the December–January double top, and stands as a critical threshold separating a bullish continuation scenario from the possibility of a deeper bearish pullback.
- Razan Hilal, CMT
