Bearish Setup on NFLX: Correction Wave (C) UnfoldingTF: 4h
NFLX appears bearish at the moment. The corrective structure on the 4-hour timeframe suggests a potential decline. The current formation indicates that wave B likely completed at 998.61 , and the stock has now begun its descent into wave (C) of the correction.
The correction may extend to the 100% projection of wave A at 788.67 , or potentially deepen to 659.06 , aligning with the 1.618 Fibonacci extension of wave A. After the completion of wave (C), traders can buy for the target up to wave B at 998.61 .
I will continue to update the situation as it evolves.
Nasdaq

NASDAQ Black Monday or a Massive Rally??Nasdaq (NDX) opened on early Monday futures trade below both its August 05 2024 and April 19 2024 Lows. All technical Supports have been broken and the market made new 12-month Lows. The market sentiment is extremely bearish, technically oversold, even the 1W RSI is below the 30.00 oversold barrier and the prevailing fundamentals regarding the back-and-forth Tariffs between nations don't leave much room for encouragement.
The index is more than -25% off the February 17 2025 All Time High (ATH), technically Bear Market territory, and the last time it dropped more this fast is during the lockdowns of the COVID crash (February 20 - March 23 2020). The market dropped by -32%, below also all known technical Supports (including its August low) before finding support and forming a bottom just above the 1W MA200 (red trend-line).
The two time events are virtually identical with the only notable difference is that Nasdaq is about to form the 1D Death Cross now while in 2020 it did about 1 month after the low.
The only technical development that leaves room for encouragement is that the 1W RSI during COVID got oversold just a day before the eventual market bottom.
Does today's 1W RSI drop into oversold territory mean that we are about to form a bottom? Unknown. But what we do know is that on March 03 and 16 2020 on two urgent, out-of-schedule meetings, the Fed stepped in to save the market from the free-fall (and save they did) by cutting the Interest Rates to near zero (first to 1.25% and then to 0.25% subsequently from 1.75% previously).
Perhaps that is the only thing that can restore investor confidence (certainly the only action that the Fed can do) and avoid a Black Monday below the 1W MA200, which would be catastrophic. On the other hand, if the U.S. government reach indeed trade deals with the rest of nations and the Fed do what they can from their end, we may even hit new ATH by August!
So what do you think it's going to be? Black Monday or Massive Rally?
-------------------------------------------------------------------------------
** Please LIKE 👍, FOLLOW ✅, SHARE 🙌 and COMMENT ✍ if you enjoy this idea! Also share your ideas and charts in the comments section below! This is best way to keep it relevant, support us, keep the content here free and allow the idea to reach as many people as possible. **
-------------------------------------------------------------------------------
💸💸💸💸💸💸
👇 👇 👇 👇 👇 👇

CAN INTEL JOIN THE TRILLION DOLLAR COMPANY CLUB? last couple years business was bad for intel and hammoraging money.
but if 18A and 14A succeeds , their foundry will provide lot of income.
i think in the long term intel also can be a trillon dollar worth company.

#Nasdaq analysis for the months or years ahead.I hope the price moves in line with this perspective and forms a new high in the future. And on the other hand, it strengthens your viewpoint and enables you to become one of the future millionaires of the stock market:))

QQQ Selling Just StartingIf you have any illusions this will be a buy-the-dip market, you are taking on a major risk!
1. Last time QQQ sold off it lost 84%
2. It took 17 years to break even
3. It took much longer to break even inflation-adjusted
You can't buy low if you don't sell first. You don't have infinite money.
WARNING!

$QQQ Has Officially Entered a Bear Market $SPX is CloseNASDAQ HAS OFFICIALLY ENTERED A BEAR MARKET, DOWN ~22%
NASDAQ:QQQ 2022 Bear Market bottomed ~37%
just below the 200WMA
S&P 500 is not quite there yet, down only ~17.5%
SP:SPX 2022 Bear Market bottomed ~27% a tick below the 200WMA

Market Review: Full Higher Time Frame Review of NASDAQ bear runI hope this get's featured 🎯
The simplest macroeconomic review of NASDAQ you may see this year.
It's all a fib retracement. That's all I have to say for now 🔪 Share this with someone looking for a good review 💰
**Video was cut short by a minute or two but the general idea was complete

NASDAQ New Week Gap will tell you everything you need to knowIf you watched my idea update from Friday, I was saying that the sellside monthly lows as well as the 2023 yearly high are being targeted.
Low and behold, we hit all targets on the weekly gap drop. Let's see how price approaches the new week opening gap mid level (dashed white). It will definitely hit that level before the end of the week.
If it does not, that means we have super easy sellside targets to hit after a clear rejection back below tested highs as always.
Share this with someone needing easy targets 🎯

SPX500 & Nasdaq: Confluence! Confluence! Confluence!With consumer confidence off at circuit breaking levels, the market, technically, has reached extreme levels of support. Let's look at it:
Technicals:
(1) Horizontal Levels of support
(2) 50%/61.8% fib confluence
(3) exDiv1
(4) extreme indicators
(5) Chikou span testing cloud support
(6) 28% drop is SPX
All of these levels are lining up around the same location. And just like in real estate "Location! Location! Location!" is the adage; in markets, "Confluence! Confluence! Confluence!" is the adage!

When will NASDAQ stop melting? You can't say I didn't warn you!I hate to say I told you but I warned about this crash at my analysis back at September 2024 for NQ1! (you can see it at related ideas below), anticipating market moves based on structure well before the narrative around election and tariffs even began circulating.
We often see markets engineer these kinds of dramatic dives below obvious lows. This projection towards the 4.0-5.0 zone looks characteristic of such a liquidity hunt, designed to clear out sell-side stops and shake out traders before a potential major move higher – a dynamic not unlike what we anticipated previously.
While the projected sharp drop on NQ1! below key levels like the Monthly Order Block near 3.0 and the AG (actual gap) level near 3.5 might look aggressively bearish, I'm viewing this as a potential setup for a significant buy opportunity.
My attention is focused on that "Possible reversal level 1" between 4.0 and 5.0. If price stabilizes and shows rejection signs within this zone, it could signal the start of a powerful rally, potentially targeting levels back up towards the 1.75 area or even revisiting prior highs.
Remember, these market structure plays can take time to fully develop, just as previous setups did. We could see NQ consolidate or even briefly dip lower within that 4.0-5.0 zone before the anticipated upward reversal truly gains traction.
Thanks for reading, boost and follow to stay liquid and not become liquidity.
Wish you safe and informed trading decisions.
___________
CME_MINI:NQ1! TVC:VIX

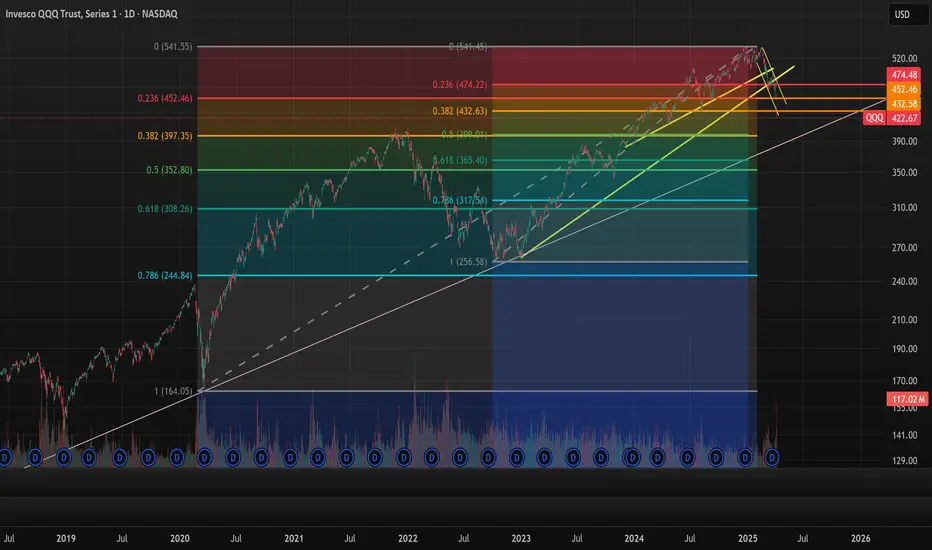
QQQ fibonacci retracementsThis is the QQQ and Fibonacci retracements from 2022 and 2020 to give you an idea of where support may lie. We crashed through support and sit in open air.
Weekly Market Forecast: Short Term Buys, Then Sells! In this video, we will analyze the S&P 500, NASDAQ, AND DOW JONES Futures for the week of April 7 - 11th.
The Stock Market Indices may find support at current levels for a Bear Market Rally. Wait for the market structure shift to the upside before taking any buys. Let the market confirm it's intended direction first, then look for valid buy setups for a short term countertrend play.
Enjoy!
May profits be upon you.
Leave any questions or comments in the comment section.
I appreciate any feedback from my viewers!
Like and/or subscribe if you want more accurate analysis.
Thank you so much!
Disclaimer:
I do not provide personal investment advice and I am not a qualified licensed investment advisor.
All information found here, including any ideas, opinions, views, predictions, forecasts, commentaries, suggestions, expressed or implied herein, are for informational, entertainment or educational purposes only and should not be construed as personal investment advice. While the information provided is believed to be accurate, it may include errors or inaccuracies.
I will not and cannot be held liable for any actions you take as a result of anything you read here.
Conduct your own due diligence, or consult a licensed financial advisor or broker before making any and all investment decisions. Any investments, trades, speculations, or decisions made on the basis of any information found on this channel, expressed or implied herein, are committed at your own risk, financial or otherwise.

S&P 500 Records Largest Weekly Decline Since 2020The S&P 500 Index has suffered its steepest two-day drop since the pandemic crash in March 2020. On April 4th, 2025, the benchmark index closed at 5,074.08, down 322.44 points (5.97%). This marks a loss of $5.4 trillion in market value across just two sessions.
The sell-off followed comments from Federal Reserve Chair Jerome Powell. He warned that President Donald Trump’s new tariffs could lead to persistently higher inflation. All 11 sectors in the S&P 500 closed in the red. Only 14 stocks remained positive as Nvidia and Apple fell more than 7%, while Tesla dropped 10%.
The Nasdaq 100 Index plunged 6.1%, confirming a bear market after losing over 20% from its February peak. The rapid decline mirrors the speed seen during the 2020 COVID crash and the 2000 dot-com bust.
President Trump announced sweeping tariffs on U.S. imports on Wednesday. These include a 10% general tariff and higher rates on dozens of countries. China responded by imposing a 34% levy on American goods. The tit-for-tat measures triggered fears of a full-scale global trade war.
Global markets reacted sharply. Investors pulled out of stocks and moved into safer assets like government bonds. The two-day loss of $5 trillion on the S&P 500 set a new record, surpassing the $3.3 trillion loss during March 2020.
Rick Meckler, of Cherry Lane Investments, said the escalation is now deeper than many investors expected. The initial belief that tariffs were a negotiation tactic has now given way to serious market concerns.
Technical Analysis: Price Approaching Key Support Zones. Will They Hold?
The S&P 500 has shown a bearish trend since early 2025. Several weekly candles have closed bearish, confirming a strong downtrend. Currently, the index is trading lower toward a key ascending trendline near $4,930.
The $4,930 support level may offer short-term support. A bounce from here could see a brief recovery. However, the sentiment remains bearish without strong economic data or policy changes.
Further Downside Risk If Support Fails
Another horizontal support sits at $4,780. If both support levels fail, the index may fall toward the $4,500 psychological zone. This level is crucial as it marks a long-term support and potential reversal point.
At present, bearish momentum dominates, with much strength coming from trade war fears. Unless data shifts investor sentiment, the downtrend may persist.

SPX500: The trendline show a bottom in Sept 2025 at 4700 We're being magnetically pulled toward the trendline bottom around 4700.
Based on the current MACD and RSI signals, the bearish scenario could continue until September–October 2025. This correction is very similar to the one from 2022.
There will be some dead cats bounces, but do not be fooled, the MACD is reseting hard.
Stay sharp. Be ready.
DYOR.

Market Update: NASDAQ 100 Analysis📈 The NASDAQ 100 is currently trading at 18,075.00, which represents a -22.6% decline from the all-time high of 22,425.75 . This marks a significant drop from its peak, entering into what could be classified as a bear market by traditional standards.
📊The previous decline from the high of 16,800.00 in November 2021 saw a decline of 37.47% , eventually bottoming out at the 61.8% Fibonacci retracement level (10,514.25), from which it staged a significant recovery to reach the all-time high of 22,425.75.
📊Current Demand Zones & Fibonacci Levels:
These zones represent potential reversal areas where buyers could regain control. The Fibonacci retracement levels align well with historical price action, reinforcing their significance as support zones.
DZ-1 (17,539.00-16,334.85): Approximately the 50% Fibonacci retracement of the recent bull rally
DZ-2 (16,334.85-15,384.25): Approximately the 61.8% Fibonacci retracement - Historically a strong support level
DZ-3 (15,384.25-14,557.00): Critical structural level with prior buyer interest
DZ-4 (14,557.00-14,140.25): Deep support level - key psychological zone
📈 Recovery Potential
To regain the all-time high of 22,425.7 5, the market would need to achieve the following percentage gains from each demand zone:
From DZ-1 (Top: 17,539.00, Base: 16,334.85): 📈 +37.3% to all-time high
From DZ-2 (Top: 16,334.85, Base: 15,384.25): 📈 +45.8% to all-time high
From DZ-3 (Top: 15,384.25, Base: 14,557.00): 📈 +54.0% to all-time high
From DZ-4 (Top: 14,557.00, Base: 14,140.25): 📈 +58.6% to all-time high
The DZ-2 to DZ-3 range provides the most likely region for a significant reversal based on confluence between historical support levels and Fibonacci retracements. While DZ-4 aligns with the 37% historical decline.
🔑 Key Takeaways
The NASDAQ 100 s is in a significant correction phase, down -22.6% from its peak.
Price is approaching critical Demand/support zones (DZ-1 to DZ-4), which may act as reversal points.
A return to all-time highs would require substantial gains, particularly if the market reaches the deeper demand zones.
Investors should closely monitor price action around the DZ-2 to DZ-3 range (15,384.25 - 14,557.00) for signs of a potential reversal.
Additionally, staying updated on developments related to the new tariffs is essential, as they may heavily influence market dynamics in the coming months.

Apple Inc. (NYSE:$ AAPL)Drops $300B+ in Tariff- Fueled Sell-OffApple Inc. (NYSE:$ AAPL) faced a massive sell-off on Thursday, April 4th 2025, with its stock closing at $188.38, down $14.81 (7.29%). This marked Apple’s worst trading day since March 2020. The steep drop came after former President Donald Trump announced a new set of tariffs targeting 185 countries, including major U.S. trading partners.
As a result, Apple’s market capitalization fell by more than $310 billion in a single day. These newly imposed tariffs, effective April 9th, include a 10% blanket duty on all imports, with higher rates applied to specific countries. China, Apple’s primary manufacturing hub, will face a combined 54% tariff—34% newly imposed, added to an existing 20% rate.
Other affected regions include the European Union (20%), Vietnam (46%), Taiwan (32%), and India (26%). Analysts consider Apple especially vulnerable to these policies due to its heavy reliance on overseas production, especially in China, where nearly 85% of iPhones are manufactured.
According to Dan Ives of Wedbush, future exemptions to these tariffs may depend on Apple’s efforts to localize its operations within the U.S., a move hinted at by the company earlier this year. However, no details have been confirmed regarding whether Apple’s U.S. expansion plans will qualify for tariff relief. The timing of the policy combined with Apple’s exposure to international supply chains, led to a bear shift in market.
Technical Analysis: Apple Breaks Below Key $197 Support
Apple’s price action shows an impulsive breakdown below the key $197 strong support level. The price is currently trading around $188, trading towards next support at $167 as the immediate support.
A drop below $167 could push the stock lower to a long-term support around $125, which was lastly retested in Dec 2022. On the upside, any recovery would first need to reclaim the broken support at $197, which now acts as resistance. The all-time high around $260 remains far away from reach unless the overall stock market sentiment improves.
Looking ahead, the chart outlines two likely scenarios. In the bullish case, Apple may find support around $167, bounce back and attempt to break above $197, possibly re-establishing it as a support zone.
In the bearish case, failure to hold $167 could push the stock lower to test $125, and if that level breaks, the price may continue downward. The current market outlook suggests a wait-and-see approach, to what happens at key level, as both macroeconomic news and technical levels continue to drive Apple stock lower.

Combined US Indexes - Lower High Lower Low checked; What next...As previously expected, a lower low has been achieved.
What was not expected was the speed, magnitude and extent of the fallout.
Next up, since it is about 3.5 Standard Deviations out, we can start looking for a consolidation, although there might be slightly more downside and we need a higher low in the expected range within box. Having said that, it is possible to see it overextend downwards briefly.
There is a long term support, Fibonacci downside target zone just below.
So expecting a short term bounce between Monday to Wednesday at the earliest, and following that a consolidation area formation.

Understanding the ICT Venom ModelIn this video I break down the ICT Venom Model as recently described by the man himself on his YouTube channel. I am sure he has more details on the model he has not released, but I basically attempt to give my two cents on NQ and the model itself.
I hope you find the video useful in your endeavours regarding learning ICT concepts as well as trading in general.
- R2F Trading

NAS100 Turn of the Month Strategy Meets Market Volatility!In this video, we dive into the Turn of the Month Strategy and explore how it could play out in the current market environment. Historically, mutual funds rebalance their portfolios at the end of the month, creating buying pressure that often leads to higher stock prices into the new month. Additionally, recurring financial inflows, such as monthly salary payments and pension contributions, tend to boost market demand during this period.
However, this month presents a unique challenge. The NASDAQ 100 has capitulated into the end of the month, driven by heightened volatility and uncertainty fueled by Donald Trump's rhetoric. With the market currently trading into a significant support zone and liquidity pool, we analyze whether the Turn of the Month effect can counteract the recent bearish momentum.
📊 Key Highlights in the Video:
Price Action Analysis: The NASDAQ 100 is deeply overextended, trading into a critical liquidity pool.
Trade Idea: A potential counter-trend rally could emerge as the market seeks to correct and rebalance.
Strategy: Look for a short-term rally into resistance, followed by a possible shorting opportunity as the market resumes its downward trend.
This video is perfect for traders looking to combine price action trading with seasonal strategies like the Turn of the Month effect. Will the market rally into the new month, or will bearish momentum prevail? Watch now to find out! 🚀

Short Position - NASDAQShort Position Entry: Consider initiating a short position if the Nasdaq-100 Index falls below 21,000.
Stop Loss (SL): Set a stop loss at 21,555 to manage potential losses.'
Market Sentiment: The combination of the Federal Reserve's cautious approach and rising inflation may contribute to a weakening market sentiment, potentially leading to a downward movement in the index.
his recommendation is for educational purposes only. Always consult your financial advisor before making any investment decisions. Stock trading involves risks, including the potential loss of capital. Ensure to evaluate your risk tolerance and conduct thorough research.

NASDAQ CRASH: Are We in a Bear Market? Let’s Break it Down!The NASDAQ 100 (NDX) just took a huge dive, dropping 21.69% from its recent highs. That officially meets the definition of a bear market (a decline of 20% or more). The question is: Are we going lower, or is a reversal coming? Let’s analyze the moving averages, Fibonacci levels, and key market signals to figure out what’s next.
📊 Moving Averages Breakdown: A Bearish Trend Confirmation?
One of the biggest red flags here is how the price is behaving relative to its moving averages:
🔴 Short-Term Moving Averages (Yellow & Green - 9 EMA & 21 EMA)
These are the fastest-moving indicators and help us track momentum.
The price has been consistently closing below them, showing strong bearish pressure.
Whenever the price tries to bounce, it gets rejected at these levels, signaling weak demand.
🟠 Mid-Term Moving Averages (Orange - 50 MA)
The 50-day moving average acts as a key support/resistance zone in many market trends.
In this chart, we saw a breakdown below the 50 MA, and since then, the price hasn’t even attempted to reclaim it.
This suggests that even mid-term traders are losing confidence, leading to further selling pressure.
🔵 Long-Term Moving Averages (Blue - 200 MA)
The 200-day moving average is a critical level for defining long-term trends.
Right now, the index is trading well below the 200 MA, which signals a major trend shift—we're no longer in a bull market.
The further we move away from this level, the harder it becomes for bulls to regain control.
➡️ Conclusion: All key moving averages are trending downward, and the price is failing to reclaim even short-term levels. This means we are likely in a sustained bear market unless we see a major reversal.
Key Fibonacci Levels & Market Structure
We are currently testing the 1.618 Fibonacci extension at 17,268. If this level fails, we could see further downside towards 15,771 (2.618 Fib) or even lower.
Any bounce will face major resistance at 18,500 - 19,100, where multiple Fib retracements and moving averages converge.
🔥 What’s Next?
If buyers step in at 17,268, we might see a relief rally.
If we break below it, expect 15,771 or even 14,273 to be the next downside targets.
Watch the moving averages closely if we start reclaiming the 9 & 21 EMA, that could be an early sign of a recovery.
Are we heading deeper into a bear market, or is this just a big correction before another bull run? Drop your thoughts below!

NASDAQ tanking! Do the right thing and CUT RATES NOW Jerome!The market is collapsing, China is retaliating with 34% tariffs and Powell is making jokes!
Well that pretty much sums up the market news since yesterday, with Nasdaq / US100 having the worst day since the COVID crash 5 years ago while President Trump shouting 'the market is going to boom'.
Today China imposed 34% reciprocal tariffs on imports of U.S. goods and the worst of all.. Jerome Powell on his speech a little earlier was making jokes about his purple tie, avoiding to address the elephant in the room and take action!
Nasdaq is testing the August 5th 2024 Low, having crossed even under the 1week MA100 for the first time since May 15th 2023! At the same time the 1week RSI just got oversold at 30.00.
Reminds you of something? Yes that's right the last time Nasdaq broke under its 1week MA100 that fast and got oversold on its 1week RSI was on the week of March 16th 2020: YES the COVID crash.
What happened then? Well dear old Fed stepped up, did what they HAD to and cut rates to near zero (0.25%).
Even President Trump tweeted just a few hours ago that Powell should cut rates now and stop playing politics!
Tariffs are in place and they will pay off very well in the long term. On the shorter term, it is in Powell's hands save the economy.
-- Do the right thing and finally CUT THE RATES Jerome! --
Follow us, like the idea and leave a comment below!!

Short-Term Gamble on a NASDAQ Bounce Using TQQQIn this quick update, I’m taking a speculative short-term trade on a possible NASDAQ recovery after a steep sell-off. Was the market oversold—at least for a day? Maybe. Do I think the pain is over for the longer term? Probably not.
I’m using NASDAQ:TQQQ , a 3x leveraged ETF that tracks the NASDAQ-100 (the top 100 non-financial stocks in the NASDAQ). This means if the index moves up 2%, TQQQ should theoretically gain roughly 6%, and vice versa on the downside. Leveraged ETFs like this are high-risk, time-sensitive instruments—they’re designed for short-term trades, not buy-and-hold investing.
The idea here is that after a sharp drop, institutions might step in to scoop up oversold tech stocks, creating a brief rebound. If that happens, TQQQ could give me amplified upside. But this is purely a gamble—I’m under no illusion that the market has bottomed. In fact, I expect more downside ahead.
I entered in the after-hours session once some of the heavy bearish volume faded, and I’ve set a tight 5% stop-loss to manage risk. Yes, I could get shaken out by an early dip before any rebound, but the stop is there to protect me if the sell-off continues.
This is a high-risk, short-term trade—buyer beware. If you’re considering TQQQ, understand the risks: decay from daily resetting leverage, extreme volatility, and the potential for rapid losses.
I’ll update on how this plays out. Wish me luck in the comments below 😁
Real question is where to take profit...
