US Market Reversal Emerged? This Week's Closing is CrucialThe final trading day of February. I always take the opportunity to analyze the monthly chart closely.
We saw an inverted hammer. From the cash chart, clearly, we can see the inverted hammer. Beyond that, it also appears to be a potential double top for the Nasdaq.
E-mini Nasdaq Futures & Options
Ticker: NQ
Minimum fluctuation:
0.25 index points = $5.00
Micro E-mini Nasdaq Futures & Options
Ticker: MNQ
Minimum fluctuation:
0.25 index points = $0.50
Disclaimer:
• What presented here is not a recommendation, please consult your licensed broker.
• Our mission is to create lateral thinking skills for every investor and trader, knowing when to take a calculated risk with market uncertainty and a bolder risk when opportunity arises.
CME Real-time Market Data help identify trading set-ups in real-time and express my market views. If you have futures in your trading portfolio, you can check out on CME Group data plans available that suit your trading needs tradingview.com/cme/
Trading the Micro: cmegroup.com/markets/microsuite.html
Nasdaq

NASDAQ about to nuke?In my previous ideas and posts i told you about #nasdaq chart structure' s weaknesses. Well, it has already made the extended rally and the time has likely come.
In lower time frame, nasdaq, spx and dji already started dumps and broke the local supports.
In monthly candle stick size, i mean higher time frame, #nasdaq100 chart:
- Formed a huge bearish divergence
- Stoch RSI made bearish triple top
- MACD is warning about the trend reversal (Bullish to bearish)
The strong support zones in HTF are:
Monthly EMA Ribbon at 15000
Monthly İchimoku Cloud bottom at 12000
The stronghold the historical trendline support at 6000.
This strategy is NOT a SHORT TERM strategy and NOT FINANCIAL ADVICE. Dyor.
Just avoid being over greedy.

Should wait for the Breakout..Bearish Divergence on Weekly & Monthly TF.
However, Hidden Bullish Divergence is appearing
on Weekly TF which is actually a Positive sign.
Immediate Support seems to be around 126 - 130.
But if 140 is Sustained on Weekly basis, we may witness
further Upside around 150ish.
Best Approach would be to wait for the Rectangular Channel
Breakout.

USTEC - Short-Term Pain, but...Hello TradingView Family / Fellow Traders. This is Richard, also known as theSignalyst.
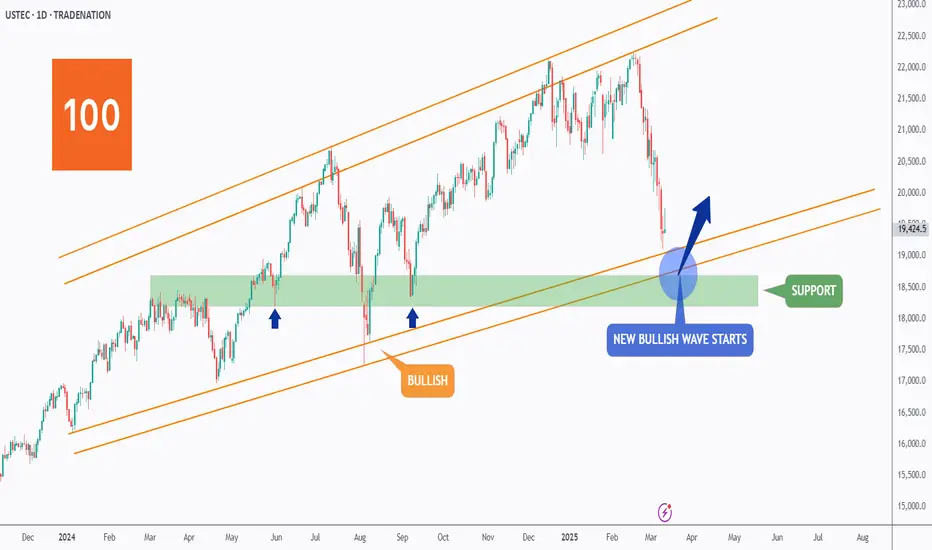
📈Long-term, USTEC has been overall bullish trading within the rising channel marked in orange.
This month, USTEC has been in a correction phase, retesting the lower bound of the channel.
Moreover, the green zone is a strong support zone.
🏹 Thus, the highlighted blue circle is a strong area to look for buy setups as it is the intersection of support and lower orange trendlines acting as non-horizontal support.
📚 As per my trading style:
As #USTEC is hovering around the blue circle zone, I will be looking for bullish reversal setups (like a double bottom pattern, trendline break , and so on...)
📚 Always follow your trading plan regarding entry, risk management, and trade management.
Good luck!
All Strategies Are Good; If Managed Properly!
~Rich
Disclosure: I am part of Trade Nation's Influencer program and receive a monthly fee for using their TradingView charts in my analysis.
MNQ!/NQ1! Day Trade Plan for 03/11/2025MNQ!/NQ1! Day Trade Plan for 03/11/2025
📈19470 19560
📉19380 19285
Like and share for more daily NQ levels 🤓📈📉🎯💰
*These levels are derived from comprehensive backtesting and research and a quantitative system demonstrating high accuracy. This statistical foundation suggests that price movements are likely to exceed initial estimates.*

MNQ!/NQ1! Day Trade Plan for 03/10/2025MNQ!/NQ1! Day Trade Plan for 03/10/2025
📈20040 20140
📉19760 19665
Like and share for more daily NQ levels 🤓📈📉🎯💰
*These levels are derived from comprehensive backtesting and research and a quantitative system demonstrating high accuracy. This statistical foundation suggests that price movements are likely to exceed initial estimates.*

US100 Short From Resistance!
HI,Traders !
US100 has retested a
A horizontal resistance
Of 20669.2 from where
A bearish reaction can be
Observed already and so
We will be expecting a
Further bearish correction !
Comment and subscribe to help us grow !

Appetite For Risk Through the Lens of Nasdaq and BitcoinBitcoin tends to track Wall Street sentiment well, particularly compared to the Nasdaq. Growing concerns that Trump's policies will tip the US (and therefore the global economy) into a recession, which currently has the Nasdaq on the ropes and bitcoin getting dragged along for the ride. And there could be further losses to follow, though a cheeky bounce at a minimum could be due first.
Matt Simpson, Market Analyst and City Index and Forex.com

NASDAQ: Oversold at the bottom of 8month Channel Up.Nasdaq is oversold on its 1D technical outlook (RSI = 26.693, MACD = -501.840, ADX = 53.670), which is the most oversold 1D RSI reading since August 15th 2015. In the meantime, it touched the HL bottom of the 8month Channel Up, a bearish wave that looks much like July 2025. The bullish wave that followed topped on the 1.382 Fibonacci extension. If candle closings are contained inside the Channel Up, we expect it to attract a lot of new buyers and initiate the new bullish wave to at least the same Fib. Long trade, TP = 23,400. A closing under the Channel Up, should test though the 1W MA100 (TP = 18,000).
## If you like our free content follow our profile to get more daily ideas. ##
## Comments and likes are greatly appreciated. ##

18 Times, +2000%, 5800 Days - All About NASDAQ100 Corrections!Hi, all!
I need to repost some of my recent ideas on TradingView due to issues with the platform's moderation. Let's start! The most up-to-date post is coming right away - one that serves as a timely reminder during these interesting times: never forget history.
From November 2008 to February 2025, the Nasdaq 100 (NDX) index has grown by over 2000%! Yes, that’s a 20x increase! This tech giant, made up of the 100 leading technology stocks, has shown impressive strength.
For comparison, the S&P 500 has risen about 820% in the same period. A great performance but Nasdaq 100 leaves it far behind.
Has this been a straight-line rise? Not really. Looking back, it may seem like the perfect investment. But the road was not smooth. Nasdaq 100’s success came with painful drops, investor panic, and moments when it felt like the market would never recover.
From the outside, everything looks great. But would you sit through a 30% drop, while the news is screaming about the "end of the world"?
So, I decided to analyze every correction of 10% or more since the market bottom in 2008.
- How long do corrections and recoveries last?
- How often do they happen?
- What should investors know?
- Can this help you in any way?
DATA ANALYSIS - 18 corrections in Nasdaq 100 (2008–2025), -10% or more.
Retracement Stats:
- Average drop: -15%
- Median drop: -13%
- Biggest drop: -37.72%
- Smallest drop: -10%
Correction Length (17 completed corrections): How many days does a correction last from the peak to the bottom?
- Average: 60 days
- Median: 35 days
- Longest: 325 days
- Shortest: 14 days
Recovery Time: From bottom back to new highs.
- Average: 165 days (~5.5 months)
- Median: 119 days (~4 months)
- Longest: 752 days (over 2 years)
- Shortest: 42 days (~1.5 months)
Correction Frequency
If we take a rough estimate, in 5800 days, there were 18 corrections, which means a correction happens every 322 days (~10.5 months) on average.
Total Time Spent in Corrections vs. Rising Markets
- Corrections lasted 1016 days
- Recoveries lasted 2801 days
- Total time spent in "work mode": 3817 days
- Total "smooth uptrend" days: 1983 days (~5.4 years)
Basically, like a hardworking employee – the market spends more time struggling than rising!
What Can Investors Learn from This?
1. Accept Volatility
Knowing that market swings are normal, investors can keep a long-term perspective and avoid panic-selling during downturns.
2. Nasdaq 100 Has Always Recovered
In the long run, Nasdaq 100 has always bounced back to new highs. Each recovery has been different, but so far, making new all-time highs has never been a problem.
3. Make Better Decisions
Understanding psychological biases helps investors make rational choices and manage risks better.
4. Market Drops = Opportunities, Not Threats
Most big market rallies started when most investors were too scared to buy.
"A simple rule dictates my buying: Be fearful when others are greedy, and be greedy when others are fearful." – Warren Buffett
Market drops always feel unique and scary but history shows they follow repeating patterns. And those who keep their emotions in check have the best opportunities.
"The time to buy is when there's blood in the streets." – Baron Rothschild
Final Thoughts: Is the current retracement a buying opportunity? No one knows for sure but history suggests - stay calm!
So, that's all. Like & Boost if you find this useful! 🚀
Have great day,
Vaido
💬 Before you leave... What’s your take on the current Nasdaq 100 correction? Drop your thoughts in the comments 👇
Longs for nasdaq 2025 /03/10Nasdaq is giving simple longs for intraday trading. This is not a long term position, we will wait to enter into fvg below the asian lows to target the asian highs. These are simple ict strategies, nothing major for monday. If we do get an extension ,it will be higher to the 1h ob-.
Good luck

NAS 100 Overextended – Brace for a Pullback! The NAS 100 is looking highly overextended at the moment 📊. Market conditions are precarious, with many instruments trading into key support and resistance levels on both the daily and weekly timeframes ⏳.
A sharp pullback 📉 could be on the horizon, potentially offering a counter-trend buying opportunity on the lower timeframes for the US 100 💰. If it pushes higher, it may set up a potential short trade 🎯.
🚨 Not financial advice – trade wisely and manage your risk! ⚖️

Tesla (TSLA) Weekly Chart Analysis – Key Levels & Market OutlookTesla (TSLA) Weekly Chart Analysis – Key Levels & Market Outlook 🚀
1️⃣ Overall Trend:
✅ Long-Term Uptrend (2019-2021): Tesla experienced a massive rally, reaching all-time highs.
🔻 Correction Phase (2022): A significant pullback led to a strong downtrend.
📈 Recovery Mode (2023-Present): The stock started forming higher highs and higher lows, indicating a bullish structure.
📉 Recent Pullback: The price is now retracing from recent highs, showing potential short-term downside momentum.
2️⃣ Key Support & Resistance Levels:
📌 Support Zones:
$300: A critical level—if it breaks, Tesla could drop further.
$260 - $280: The next demand zone if selling pressure continues.
$240 - $250: Strong historical support, previous swing low.
$180 - $200: A major long-term base where Tesla found strong demand before a rally.
📌 Resistance Zones:
$380 - $400: A strong rejection zone—Tesla recently pulled back from here.
Above $400: A breakout could send TSLA toward $500+ (previous cycle highs).
3️⃣ Candlestick & Price Action Observations:
📉 Bearish Momentum:
The latest weekly candle is red, indicating strong selling pressure.
If Tesla fails to hold $300, expect a move toward $260-$280.
📊 Potential Bounce Area:
If buyers step in, Tesla might consolidate before another leg higher.
4️⃣ Market Context & Indicators:
🚗 EV Sector & Nasdaq Trends: Tesla follows macroeconomic conditions and overall tech sector movements.
📆 Earnings & News Catalysts: Watch for updates on deliveries, margins, and macro sentiment.
📊 Technical Indicators:
✅ Moving Averages:
50-Week MA: A close below this could signal weakening momentum.
200-Week MA: A crucial long-term dynamic support.
✅ RSI (Relative Strength Index):
Not oversold yet—watch for levels near 30 for potential reversals.
✅ MACD (Moving Average Convergence Divergence):
Bearish crossover forming? A confirmation could indicate further downside momentum.
✅ Fibonacci Retracement:
Retracement levels align with $260 - $280 as a possible bounce zone.
5️⃣ What’s Next?
📌 Bullish Scenario: If Tesla holds $300, expect a potential rebound toward $350-$380.
📌 Bearish Scenario: A break below $300 could lead to a test of $260-$280, with downside risk toward $240 - $250 in extreme cases.
🚀 Key Question: Will Tesla hold support and bounce back, or will sellers push it lower?
💬 Drop your thoughts below! 🔥📉📈

Nasdaq Potential Huge BounceI post this again, because from my last post, some only see a confusing picture instead of the chart.
Price nearly reached the L-MLH of the Red Fork.
This is a huge price stretch and chances are super high that we will see a big bounce to the upside.
As for PTG's I focus on the Red, and the Orange Centerline.

QQQ long term trend is down with short-term relief rallyI am guessing a bit more downside before we see a relief rally. The AI bubble is starting to unwind, and that falling knife is sharp. I am patiently waiting for some version of a short-term bottom. You can see in the chart that price is has several key support lines within near reach. I would expect testing and hopefully finding some support in the coming days. If it is like the COVID bubble unwind, then we could see a strong reverse rally out of this range. However, I think it is pretty clear QQQ is in correction with a convincing loss of the 200 day SMA.

NASDAQ: Correction or Crash?!If this Monthly Chart for March holds then the NASDAQ:QQQ is COOKED!
Next Level: $450
Crash level: $370-$400 🥶
- Breaking out of WCB Trend
- Volume is WAY less than 202 Market Crash (Can get worse)
- Breaking out of Bullish Channel
- Topping tail wicks
Not financial advice

AMAZON at important support. Positive days coming?AMZN looking at good support. We can see positive days if it works.
Many cryptocurrency dominance charts, as well as Nasdaq and other stock charts too, showing the same pattern. Is the reversal starting? Check my other analysis too.
We’ll see.
This is not investment advice. Please do your own research.
Wishing you best.
-YusufDeli

NASDAQ below its 1W MA50 after 2 years. Doom or recovery ahead??Nasdaq (NDX) broke below its 1W MA50 (blue trend-line) for the first time in 2 years (since week of March 13 2023). That is a strong long-term Support, in fact it is technically the first level to look for during cyclical bull trends. So how bad can a break and/or 1W candle closing below it?
As you can see on this multi-year chart on the 1W time-frame, since the 2008 Housing Crisis, the index has had a number of breaks below its 1W MA50. With the exception of the 2022 Inflation Crisis, which was a cyclical Bear Market like 2008, all of those breaks were short-lived and rebounded on the 1W MA100 (green trend-line) almost instantly.
In fact, the current technical pull-back resembles the June - August 2011 correction, which after breaking below the 1W MA50, it found support and rebounded on the 1W MA100 in 2 weeks. The rebound that followed rose by +38% in 7 months. If a similar development is followed, which is what we expect, we are looking at a potential end-of-year rally to 24900. This also took place on the 2019 rally.
What makes this 17-year recurring pattern even more interesting is that technical pull-backs such as the current, tend to take place when the 1W RSI Channel Down, a technical Bearish Divergence) hits 40.00 and makes a Lower Low (green circles).
-------------------------------------------------------------------------------
** Please LIKE 👍, FOLLOW ✅, SHARE 🙌 and COMMENT ✍ if you enjoy this idea! Also share your ideas and charts in the comments section below! This is best way to keep it relevant, support us, keep the content here free and allow the idea to reach as many people as possible. **
-------------------------------------------------------------------------------
💸💸💸💸💸💸
👇 👇 👇 👇 👇 👇

TESLA important support. Are positive days coming?TSLA coming to an important support level. It can bounce back for a while, It dropped %55 from top.
Positive days coming?
Many cryptocurrency dominance charts, as well as Nasdaq and stock charts too, showing the same pattern. Is the reversal starting?
Check my other analysis too.
We’ll see.
This is not investment advice. Please do your own research.
Wishing you best.
-YusufDeli

Nasdaq 100 Drops More Than 4.0% Amid Market UncertaintyThe Nasdaq 100 index has already accumulated a loss of over 4.0% during today’s session and has declined more than 12% since its peak on February 18. The strong bearish movement remains intact as the market anticipates that the new 25% tariffs imposed on countries like Mexico and Canada could begin affecting production costs for U.S. companies. In the long run, this may lead to a low-return environment that could be unfavorable for the index.
Additionally, companies such as Amazon, Nvidia, and Microsoft have seen declines between 3% and 5% in recent sessions, reinforcing the bearish pressure on the Nasdaq due to their heavy weighting within the index.
Momentum Accelerates
With the strong downward bias currently present in the chart, selling pressure has been able to break through the support level at 19,700 points. However, the rapid price acceleration is beginning to have a significant impact, which could lead to short-term bullish corrections.
Oversold Indicators
Bollinger Bands: The bearish momentum has broken below the lower Bollinger Band, which could indicate a high acceleration in recent price movements.
RSI (Relative Strength Index): The RSI line continues to decline below the oversold level of 30, suggesting an imbalance between buying and selling forces.
MACD (Moving Average Convergence Divergence): The MACD histogram has dropped to levels not seen since July 2024, indicating a persistent downward acceleration without giving buyers an opportunity to regain control.
The alignment of these indicators suggests a significant acceleration of the bearish trend, which may lead to a standardization of bullish corrections in the short term.
Key Levels:
18,800 points – Near-Term Support: This level corresponds to lows not seen since September 2024. Persistent trading below this level could further accelerate the strong downward bias currently present in the chart.
19,700 points – New Resistance Zone: This level aligns with the lower Bollinger Band, which may serve as the area where potential bullish corrections could take place in the short term.
20,500 points – Distant Resistance: A neutral zone that has been tested by price movements in recent months. A sustained rally back to this level could challenge the current bearish sentiment prevailing in the market.
By Julian Pineda, CFA – Market Analyst

Nasdaq - Potential Huge Bounce AheadPrice nearly reached the L-MLH of the Red Fork.
This is a huge price stretch and chances are super high that we will see a big bounce to the upside.
As for PTG's I focus on the Red, and the Orange Centerline.

MNQ!/NQ1! Day Trade Plan for 03/07/2025MNQ!/NQ1! Day Trade Plan for 03/07/2025
📈20328 20420 20515
📉19860 19765
Like and share for more daily ES/NQ levels 🤓📈📉🎯💰
*These levels are derived from comprehensive backtesting and research and a quantitative system demonstrating high accuracy. This statistical foundation suggests that price movements are likely to exceed initial estimates.*

NASDAQ Futures Fall Following S&P's Worst Week Since SeptemberUS stock futures fell solidly Monday as investors and traders took the weekend to process the February jobs report and prepared for a busy week of economic data, headlined by a report on inflation amid concerns over its resurgence under President Trump's unpredictable trade policy.
Dow Jones Industrial Average futures (YM=F) fell 1%, while futures attached to the benchmark S&P 500 (ES=F) also dropped 1% after the index posted its worst week since September. Futures tied to the Nasdaq (NQ=F) also slipped around 1.79%.
All three major indexes looked set to build on losses of more than 2% last week.
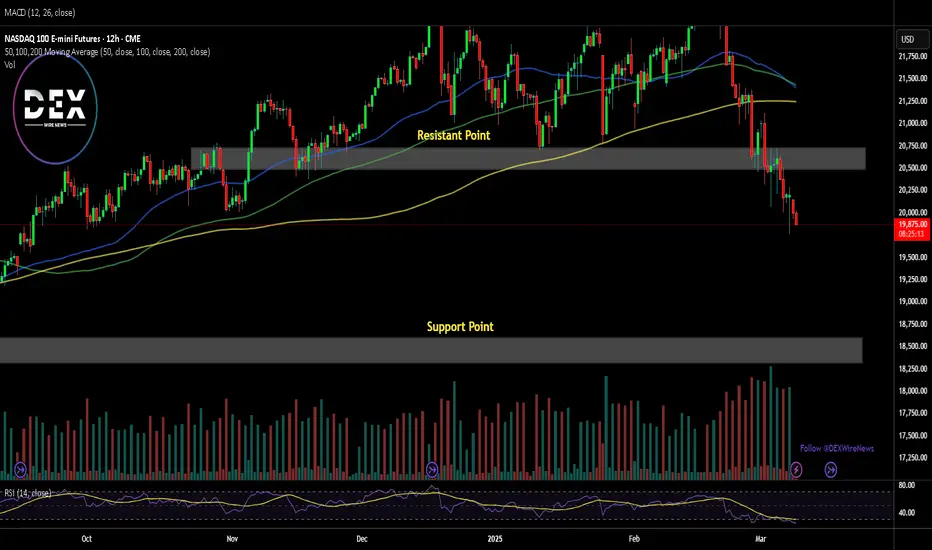
For the Nasdaq Composite, the resistance point has been faded with selling pressure increasing, the 18,500 point could serve as support point for Nasdaq price index. However, should a trend reversal occur, the break above the resistant pivot may catalyse a bullish spree as industries, investors and traders are dissecting President Trump's trade policy.