Actionable Nasdaq insights: 05-Mar-2025Rise and shine, traders! Start your day with actionable Nasdaq insights. Let's grow your skills together, one chart at a time.
Nasdaq

Today analysis for Nasdaq, Oil, and GoldNasdaq
The Nasdaq closed lower as market volatility increased due to tariff concerns. Although the index dropped below the 240-day moving average, it formed a lower wick, indicating an attempt to establish a short-term bottom. On continuous futures, the 240-day MA is slightly below 20,000, meaning that the 20,100–20,000 zone is a key support area where a technical rebound is likely following the recent sharp decline. If the market falls into this zone, it could present a swing buying opportunity. Since the daily MACD and signal line are dropping steeply, a sideways consolidation period may be necessary to reduce their angle and separation before further directional movement.
Given that the Nasdaq rebounded strongly after forming a lower wick yesterday, a pullback in pre-market trading could provide a buy-the-dip opportunity. Additionally, potential bullish catalysts include today’s ADP Non-Farm Employment data and Friday’s Non-Farm Payroll report.
On the 240-minute chart, the index is forming a bullish divergence and attempting a golden cross, reinforcing the buy-the-dip strategy at current levels. Therefore, chasing shorts is not advisable, as the Nasdaq has entered a more attractive buying zone. A range-trading approach remains effective, with a preference for buying near support.
Crude Oil
Crude oil closed lower, finding support near previous demand zones. Despite the continued downtrend, the $66–67 range remains a strong support area, making it a potential rebound zone for technical buyers. However, on the daily chart, the MACD and signal line are sloping downward sharply, meaning that selling pressure could intensify further. Long positions should be initiated as close to the lower support zone as possible.
On the 240-minute chart, the MACD has formed another bearish crossover, confirming strong selling momentum. However, when compared to the previous MACD level near $68.50, price has declined further, but the MACD has not dropped as low, suggesting a potential bullish divergence. Since this zone has historically acted as strong support, a buy-the-dip strategy remains preferable, but traders should remain cautious of today’s Crude Oil Inventory report, which could lead to increased volatility.
Gold
Gold closed higher, successfully rebounding from support. Yesterday, gold reached the previously projected target of 2,925, aligning with the 240-day moving average characteristics.
If gold continues higher, the 2,940 level will act as resistance, as this is a previous supply zone on the daily chart. Therefore, further upside should be monitored carefully before making new decisions. Since the daily MACD and signal line remain widely separated, this is not an ideal condition for chasing long positions. Even if gold extends its rally, a pullback is likely, making buying dips a safer approach.
On the 240-minute chart, the MACD formed a golden cross, leading to a sharp rally. As expected, price reached the 60-day MA following the 240-day MA bounce. However, while the MACD has moved above zero, the signal line is still below zero, meaning that another corrective phase could occur before further upside. Additionally, there is a possibility that gold could revisit the 2,850 support zone to form a double-bottom structure, making buying dips a better strategy than chasing breakouts. Overall, a range-trading strategy—buying low and selling high—remains effective, and today’s ADP Non-Farm Employment data could introduce market volatility.
As market conditions shift, risk management remains crucial. Stay disciplined, adapt to volatility, and trade with confidence. Wishing you a successful trading day! 🚀
If you like my analysis, please follow me and give it a boost!
For additional strategies for today, check out my profile. Thank you!
NASDAQ: Madness in the markets THANKS to Trump!! Watch out!!Investors are unwinding their risk positions in the face of the imminent escalation of the global trade war and are seeking refuge in the safest assets. The entry into force of the new US tariffs on Canada and Mexico of 25%, in addition to a doubling of China's taxes to 20%, has triggered falls in the stock markets.
The proposed tariffs represent the highest trade barriers in several decades, and their entry into force distorts supply chains and will increase the prices of capital goods, raw materials, industrial and consumer products, including food that crosses the border. Measures that will push inflation upwards.
---> How far can the price fall?
If we look at the chart above (DAILY timeframe), the price has touched a KEY zone where it could end the retracement phase if it respects it or, on the contrary, start a much deeper bearish phase.
Today it touched it and automatically rebounded, but we have to wait for it to consolidate and for the indicators to start marking a bullish TREND AND STRENGTH (Bull) in H4 and H1 timeframes. This Friday the NFP will be published and therefore it will be a key day in the markets.
If we look at the chart below (H1), the TREND is clearly bearish (Bear), and as long as we do not see a bullish TREND (Bull) in that chart, the end of the retracement cannot be considered finished.
--> What strategy can we follow?
If our PROFILE is AGGRESSIVE, we are in a very good area to enter long, but if our PROFILE is CONSERVATIVE, we should wait for the H1 or H4 timeframe chart to show an upward TREND and STRENGTH (Bull).
Conclusion:
Mr. TRUMP and his CRAZY way of attacking the WORLD, has BROKEN the markets and now we just need to see when he decides to back down and CALM the markets down again... because HE WILL DO IT!!! He is a MARKET MANIPULATOR and that is the problem (FOR EXAMPLE WHAT HE DID 2 DAYS AGO WITH THE CRYPTOCURRENCIES CARDANO, SOLANA AND RIPPLE). He uses his messages to manipulate everything and SOMEONE SHOULD STOP HIM... Warren Buffet might do it at any moment :-).
Greetings and good luck because we are in a difficult time to invest in a stable way.

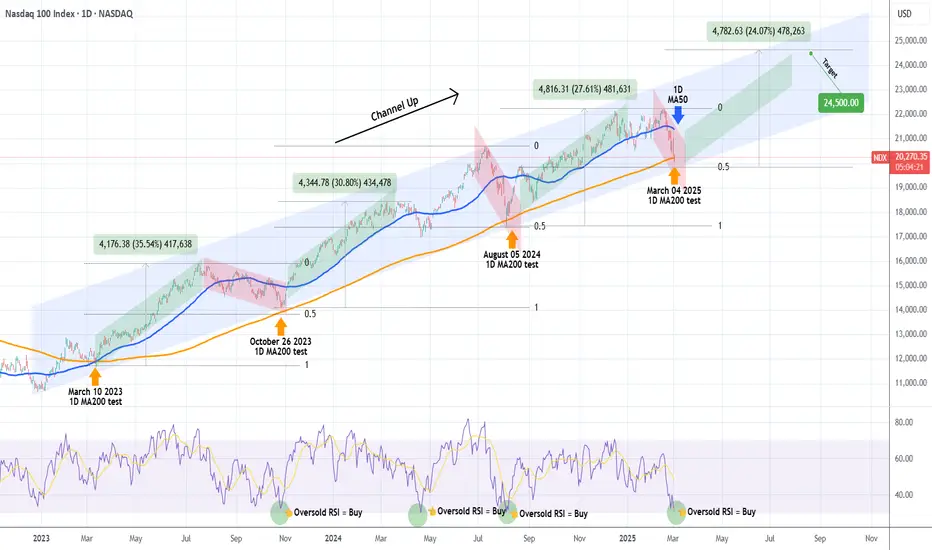
NASDAQ hit its 1D MA200. Strongest buy signal in 2 years!Nasdaq (NDX) hit today its 1D MA200 (orange trend-line) for the first time in 7 months (since the August 05 2024 Low) with its 1D RSI almost oversold (below 30.00). In the past 2 years (since the March 10 2023 test), the 1D MA200 has been tested another 3 times, all of which have been the absolute technical buy entries, kick-starting enormous rallies.
On top of that, the price is close to the bottom (Higher Lows trend-line) of the long-term Channel Up that started on the December 2022 market bottom. Every rally that followed after a 1D MA200 test has been marginally weaker than the previous but all three have been around +30% on average. The last one has been +27.61%, which is -3% weaker than the previous.
As a result, we are expecting a new rally to start now as all buy conditions within a 2-year span have been met (1D MA200, oversold 1D RSI) that can target 24500, which represents a +24.00% rally (-3% shorter rise than the previous).
-------------------------------------------------------------------------------
** Please LIKE 👍, FOLLOW ✅, SHARE 🙌 and COMMENT ✍ if you enjoy this idea! Also share your ideas and charts in the comments section below! This is best way to keep it relevant, support us, keep the content here free and allow the idea to reach as many people as possible. **
-------------------------------------------------------------------------------
💸💸💸💸💸💸
👇 👇 👇 👇 👇 👇
Nasdaq100 - Where could we go?NASDAQ:QQQ
If we lose this Bullish Channel then here are the levels...
Level 1: $445-$450
Level 2: $385-$400
Not financial advice

POSITION REVERSED ON NASDAQWe reversed our position after that we got an IFVG to target the DLQ we have at 19785.48.

NASDAQ Potential DownsidesHey Traders, in today's trading session we are monitoring NAS100 for a selling opportunity around 20700 zone, NASDAQ is trading in a downtrend and currently is in a correction phase in which it is approaching the trend at 20700 support and resistance area.
Trade safe, Joe.

MNQ!/NQ1! Day Trade Plan for 03/04/2025MNQ!/NQ1! Day Trade Plan for 03/04/2025
📈20420 20520 20610
📉20230 20140 20045
Like and share for more daily ES/NQ levels 🤓📈📉🎯💰
*These levels are derived from comprehensive backtesting and research and a quantitative system demonstrating high accuracy. This statistical foundation suggests that price movements are likely to exceed initial estimates.*

BUY NASDAQI'm sharing with you our trade this morning on NASDAQ which is based on the FVG after the LQ grab, to target the BUYSIDE LIQUIDITY.
Follow for more!

NQ Short Term Long - Second ChanceThis is a intraday short term trade.
Yesterday price stopped at the L-MLH as expected.
Today we have the second bounce at it.
A nice second chance for a long entry.
Target is the Centerline and above.

MSTR IS JUST GETTING STARTED - ONLY FOOLS SELL NOW!MSTR and Bitcoin are gearing up for the biggest bull run you've ever seen. Its unbelievable how many people are selling now thinking the bear market is starting and the bull run is over. Its crazy how many bears are flooding X and other platforms. It makes me laugh people calling Saylor a top signal and stupid. Saylor is not stupid and to think that you're smarter than him is just dumb. These rich dudes and hedge funds know whats going on, way better than anyone on here or any other platform. They control the markets, they have the money to make the charts do what they want. Dont be fooled.
None of this is financial advice. Just my opinion. Follow me for more charts and updates.

Nasdaq market analysis: 04-Mar-2025Good morning, traders! Welcome to today's Nasdaq market analysis. Compare my price action insights with your own charts and enhance your trading skills.

NASDAQ: Bearish Engulfing PatternWhat is a bearish engulfing?
A bearish engulfing pattern, which is a technical chart pattern that indicates that lower prices are on the way. The pattern consists of an up candlestick (white or green) followed by a big down candlestick (black or red) that eclipses or "engulfs" the smaller up candle.
----------------------------------------------------------------------------------------------------------------------
We are not registered or licensed in any jurisdiction whatsoever to provide investing advice or anything of an advisory or consultancy nature.
and are therefore are unqualified to give investment recommendations.
Always do your own research and consult with a licensed investment professional before investing.
This communication is never to be used as the basis of making investment decisions, and it is for entertainment purposes only.

Today analysis for Nasdaq, Oil, and GoldNasdaq
The Nasdaq closed sharply lower, rejecting resistance at the lower boundary of its previous range and dropping to the 240-day moving average. Testing the 240-day MA was an expected technical move, and after facing resistance at the 120-day MA, the index retested the 20,300–20,500 zone. This price action has formed the head of a head-and-shoulders pattern, making it crucial to watch for potential rebound attempts. However, since both the MACD and signal line have moved below the zero line, the market remains in a confirmed downtrend, making selling into rallies the preferred strategy.
As mentioned previously, if the Nasdaq finds support near the 240-day MA, a technical rebound toward the 60-day MA remains possible, as per moving average behavior. On the 240-minute chart, the index is holding support between 20,300–20,500 and still maintaining a golden cross. If the MACD avoids a bearish crossover with the signal line, the likelihood of a rebound increases, making buying near support a reasonable approach. However, the previous range low near 21,000–21,100 will likely act as strong resistance, making selling into rallies favorable. While no major economic reports are scheduled today, market volatility could increase due to comments from President Trump, so traders should maintain strict risk management.
Crude Oil
Crude oil closed lower following news that OPEC+ plans to increase production. On the daily chart, both the MACD and signal line are sloping downward, confirming a gradual downtrend. However, the $66–67 zone remains a strong support level, while the $70.50 level is the key resistance to watch. For now, trading within the range is the most effective strategy. If oil fails to stage a recovery this week, the weekly chart could confirm a sell signal, reinforcing further downside risk.
On the 240-minute chart, the MACD has formed another bearish crossover, suggesting that selling pressure is continuing. Instead of chasing shorts, traders should wait for a pullback to support near $66–67 and consider buying on dips. Given that market flows remain mixed, oil is likely to trade sideways, making range-bound trading the most effective approach for now.
Gold
Gold closed higher, finding support near previous highs. On the daily chart, the index rebounded to the 5-day moving average, and since both the MACD and signal line remain above zero, buying pressure remains intact. However, given the wide gap between the MACD and the signal line, even if gold continues higher, it may face another pullback, making chasing long positions risky. On the weekly chart, the bullish trend remains intact, but since gold is now approaching the 5-week moving average, breaking above resistance may take time.
On the 240-minute chart, a strong rebound emerged from the previous resistance zone, which aligns with the 240-day MA. The MACD has also formed a golden cross, meaning that if the uptrend continues, price targets could extend toward the 60-period MA on the 240-minute chart, potentially reaching the 2,925 area. However, since this initial move is a single-bottom formation, the market could attempt to form a double-bottom before continuing higher, making buying at lower levels more favorable. Gold could also enter a consolidation phase ahead of Friday’s Non-Farm Payroll (NFP) report, so traders should anticipate range-bound price action.
Risk management remains key, and I sincerely hope that March brings strong trading opportunities for all of you. Wishing you a successful trading day!
If you like my analysis, please follow me and give it a boost!
For additional strategies for today, check out my profile. Thank you!

NQ - Nasdaq Bounce Port IntradayNasdaq is stretched, I prepare for a bounce at the Lower-Medianline-Parallel.
Targets are at the Centerline and U-MLH.
My S/L is planned for roughly 50 Points because of this crazy Volatility.

MNQ!/NQ1! Day Trade Plan for 03/03/2025MNQ!/NQ1! Day Trade Plan for 03/03/2025
📈21180
📉20900
Like and share for more daily ES/NQ levels 🤓📈📉🎯💰
*These levels are derived from comprehensive backtesting and research and a quantitative system demonstrating high accuracy. This statistical foundation suggests that price movements are likely to exceed initial estimates.*

TP FILLED ON NASDAQCouple minutes ago, I posted to sell NASDAQ, and now the market reached our TP.
Follow for more trades!

SELL NASDAQGood morning Traders
I'm sharing with you one of the trades I'm taking today, we sold after that the Minor BUYSIDE LQ got swept and based on the IFVG. And our target is the Daily LQ.
Follow for more!

NAS100 - Nasdaq, won't it go below 20k?!The index is below the EMA200 and EMA50 on the four-hour timeframe and is trading in its medium-term ascending channel. If the index rises towards the suggested zones, we can look for the next Nasdaq sell-off.
The composition of investors’ financial assets from 1990 to 2025 reveals shifts in the allocation of equities, bonds, and cash. Currently, the share of equities in investment portfolios has reached an all-time high of 54%, indicating a growing preference for the stock market among investors.
Conversely, the share of bonds and cash has declined to 18% and 13%, respectively, suggesting reduced interest in holding fixed-income assets and liquidity. At present, more than half of investors’ financial assets are concentrated in equities, which could reflect optimism about the market’s future growth.
This situation calls for increased caution from the Federal Reserve and the Trump administration, as a significant portion of American households’ surplus income is now directed toward stocks. As a result, any downturn in the U.S. stock market could have more severe consequences for the public than before.
Scott Bassett, the U.S. Treasury Secretary, responded to a recent survey indicating that Americans want President Donald Trump to focus more on reducing inflation. He stated that he is confident consumer price inflation in the United States will decline throughout the year.
In an interview with CBS and Face the Nation, Bassett defended Trump’s economic policies, emphasizing that the president is pursuing a comprehensive approach that includes tariffs, deregulation, and a gradual reduction in energy costs.
Meanwhile, following weaker-than-expected preliminary Purchasing Managers’ Index (PMI) data for February and a decline in the University of Michigan’s Consumer Sentiment Index, investors are now pricing in approximately 60 basis points of rate cuts by the Federal Reserve for this year. This projection is 10 basis points higher than the forecasts from the December dot plot.
Market pricing indicates that traders still expect the Federal Reserve to cut interest rates in June, particularly after the release of Personal Consumption Expenditures (PCE) data. However, with Trump ramping up tariff threats against key U.S. trading partners such as China, Canada, and Mexico, outlining a clear economic roadmap has become more challenging. Tariff impositions pose a serious risk of reigniting inflation, prompting many Federal Reserve officials who have recently expressed their views to adopt a “wait and see” approach.
This week, market attention will once again turn to employment data, as investors eagerly anticipate the release of the February Non-Farm Payrolls (NFP) report. Other key events include the preliminary Consumer Price Index (CPI) estimates for the Eurozone and the ISM U.S. Manufacturing PMI on Monday, the ADP Employment Report and ISM Services PMI on Wednesday, and the weekly jobless claims data on Thursday. Additionally, the European Central Bank’s monetary policy decision on Thursday will be closely watched, with economists expecting another interest rate cut.

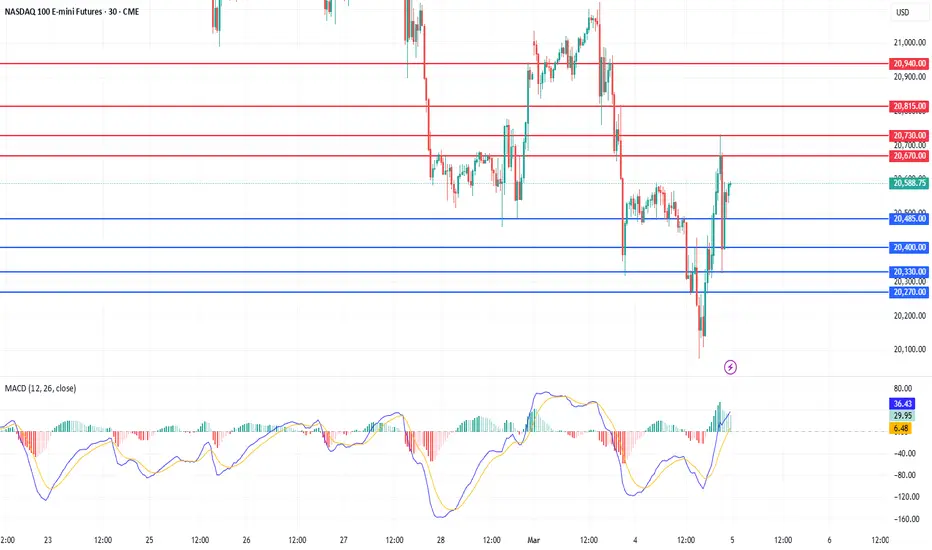
Nasdaq volatility NOT OVER YET!!Make note of the following liquidity targets this wk
Buy-side near term tp @ 21110-21160 (selling from there)
Sell-side tp @ 20378 (scaling into long buy positions from there)

Monthly, Weekly and Monday analysis for Nasdaq, Oil, and GoldNasdaq
The Nasdaq closed higher, finding support at the lower Bollinger Band on the weekly chart. Due to the sharp decline last week, the 20,500 to 20,300 range was a technical rebound zone.
On the monthly chart, February closed with a bearish candle, bringing the index below the 5-day moving average and forming a range with the 10-day MA. For March, the 3-day and 5-day moving averages will act as resistance, while the 10-day MA serves as support. Since the monthly MACD is still above the signal line, even if corrections occur this month, rebound potential remains, meaning traders should be cautious about chasing shorts aggressively.
On the weekly chart, the Nasdaq fell below the 20-week MA, accelerating the sell-off. The MACD continues to slope downward, keeping further downside potential open, but since the signal line is still above zero, the index may consolidate between the 3-week and 5-week moving averages, making a range-bound strategy effective this week.
On the daily chart, both MACD and the signal line have dropped below zero, confirming a bearish market structure. The 21,000 level was broken decisively with a large bearish candle, meaning that if price struggles to reclaim this level, further downside toward the 240-day moving average is possible. If the Nasdaq falls to the 240-day MA, traders should prepare for a potential technical bounce, as historically, this level has provided support. Reviewing moving average dynamics could be helpful for understanding this scenario.
On the 240-minute chart, Friday’s low produced a strong rebound, making the MACD's potential golden cross a key signal to watch. As long as the recent lows hold, buying opportunities may exist, but since the signal line remains far above zero, selling pressure may persist on any rallies. Traders should avoid chasing long positions and focus on range trading. This week, traders should keep an eye on China’s National People's Congress (NPC) on Tuesday and the U.S. Employment Report on Friday, as both events could increase market volatility later in the week.
Crude Oil
Crude oil closed lower within a narrow range, continuing its sideways movement. On the monthly chart, February closed with a bearish candle, causing the MACD to turn downward while still maintaining a range-bound structure. Although the MACD and signal line remain above zero, buyers are still attempting to hold support within this range. For now, oil should be traded as a large range-bound market.
On the weekly chart, last week’s doji candle suggests indecision, and this week, the MACD has crossed below the signal line, triggering a sell signal. However, since a weekly close is needed to confirm this, the possibility of a trend reversal remains open. If oil continues lower this week, the sell signal will be fully confirmed, but if price rebounds, last week’s doji candle could mark a reversal point. Key bullish catalysts include Trump’s potential tariffs on Canada and Mexico, as well as the possibility of stricter oil sanctions on Venezuela. Meanwhile, bearish factors include economic slowdown fears reducing oil demand.
On the daily chart, breaking above $70 remains the key bullish trigger, but since the MACD has yet to form a golden cross, confirming an end to the downtrend is premature. On the 240-minute chart, the MACD has formed a golden cross, indicating a potential recovery after a pullback. For now, traders should buy dips cautiously, but breaking above $70 remains the key factor for further upside confirmation.
Gold
Gold closed sharply lower, forming a large bearish candle. On the daily chart, gold has fallen from previous highs to the lower Bollinger Band, meaning that additional downside (overshooting below support) remains possible.
On the monthly chart, gold formed a doji candle, indicating uncertainty. If gold found support at the 3-day MA last month, this month, traders should watch for support at the 5-day MA, as it could provide a buying opportunity on pullbacks.
On the weekly chart, gold has fallen to the 5-week MA, meaning that it has entered a range-bound structure. Since the lower support levels are still open, traders should avoid chasing long positions at highs and focus on buying lower. The U.S. Employment Report is due on Friday, which could increase volatility for gold.
On the daily chart, while the MACD is declining, the signal line remains well above zero, meaning that even if prices fall, rebound attempts are likely. On the 240-minute chart, further downside toward the 240-day moving average remains possible, but traders should watch for bottoming signals and potential support. If the MACD forms a golden cross, a strong rebound could follow, so monitoring short-term momentum shifts will be key.
February marked a transition to a range-bound market after an extended uptrend, suggesting that March could be a period of consolidation or further downside extension. Geopolitical risks have increased since Trump took office, and market volatility is rising due to key global events. Traders should focus on risk management and avoid overexposure. Wishing you a successful start to March! 🚀
If you like detailed this analysis and today's strategy, please follow me and give it a boost!

Weekly Market Forecast Mar 3-7: Stock Indices, Gold, Oil, moreThis is a FUTURES market outlook for the week of Mar 3-7th.
In this video, we will analyze the following futures markets:
ES | S&P 500
NQ | NASDAQ 100
YM | Dow Jones 30
GC | Gold
SIL | Silver
PL | Platinum
HG | Copper
The indices took a bearish turn at the end of last week. Trump announcements, tariffs, Ukraine and Russia injected uncertainty into the markets, and investors moved money into safe havens.
Patience is required to trade in this environment. Wait until there are clear signs of shifts in the market before deciding on a bias. Setup confirmations are always the best course of action.
Enjoy!
May profits be upon you.
Leave any questions or comments in the comment section.
I appreciate any feedback from my viewers!
Like and/or subscribe if you want more accurate analysis.
Thank you so much!
Disclaimer:
I do not provide personal investment advice and I am not a qualified licensed investment advisor.
All information found here, including any ideas, opinions, views, predictions, forecasts, commentaries, suggestions, expressed or implied herein, are for informational, entertainment or educational purposes only and should not be construed as personal investment advice. While the information provided is believed to be accurate, it may include errors or inaccuracies.
I will not and cannot be held liable for any actions you take as a result of anything you read here.
Conduct your own due diligence, or consult a licensed financial advisor or broker before making any and all investment decisions. Any investments, trades, speculations, or decisions made on the basis of any information found on this channel, expressed or implied herein, are committed at your own risk, financial or otherwise.

#202509 - priceactiontds - weekly update - nasdaq e-miniGood Evening and I hope you are well.
comment: My line in the sand for bears was 20600 and bears actually got there but the very bullish close on Friday destroyed many bear hopes. Biggest question for Monday is now, does the bear channel hold or will we strongly break above to test the highs again? I don’t know and that’s when I will lean neutral. Both sides have reasonable arguments and the bear channel is valid until clearly broken but Friday’s close was special. 20900 is probably a bad place to trade and I will be cautious on Monday. There are multiple bigger patterns we are currently in. Most recent is the tight bear channel down from last week, which would be broken above 21100. Then we are also inside an expanding triangle on the daily tf where the upper trend lines goes through the ath 22450. On the weekly tf I have two bull trend lines and both could be right or wrong, you never know. The lower one runs a bit below 20000 and that is obviously a magnet market will test over the next days or weeks but I have no idea if we do another leg up first.
current market cycle: trading range
key levels: 21000 - 22500
bull case: Bulls have probably seen enough selling and Friday’s close showed some strength that they want more exposure again. Their first target is 21000 and then break above the bear channel from last week, which would be above 21100ish. Next targets are then the mid point around 21500 and then likely no more resistance until 22000. Bullish ABC move on the chart, which would be my preferred path if we close above 21200 on Monday.
Invalidation is below 20400.
bear case: Bears want to see this as a W1 and get at least another strong leg down or even a third one. What are the odds of that? The last strong selling we had was 2024-07 where nq dropped for 16% over 5 weeks. So a long time ago where we did not correct for 10% or more. Right now we are down 8% in two weeks, which is the strongest selling we have seen in the past 7 months. Bears certainly would have a bit more room to the downside to touch 20000 or a bit lower to hit the bull trend line around 19800 (depending on how you draw it). I’m just having a really hard time believing this is more likely than a trade back up to at least 21500 since we are still inside the bull trend and two weeks ago we were 130 points below the ath. An expanding triangle is likely the more dominating feature for now. Every dip below 21000 has been bought and selling here has not been profitable for the past 2 months.
Invalidation is above 21100.
short term: Neutral. Tough spot. Bears could want more downside since the bear channel is still active until we break above 21100. Bulls see the expanding triangle and two weeks of selling with -8% was enough for them to strongly buy into Friday’s close. If 20k is now resistance, I’d like to short with a stop 21410 for target 20500 or lower. If bulls come out strongly early tomorrow, the 4h ema + bear channel could break and we would likely test the highs above 22000 again.
medium-long term - Update from 2024-02-23: Neutral since we are in a 4-5 month trading range. Still leaning heavily bearish for this year but for now it’s sideways until we get consecutive daily closes below 20000.
current swing trade: None
chart update: Added possible paths for both sides. There is a very low chance that the past 2 weeks were the W1 of a very strong 5-wave series down but until we see daily closes below 20000, I have zero confidence in this.
