MNQ!/NQ1! Day Trade Plan for 02/25/2025MNQ!/NQ1! Day Trade Plan for 02/25/2025
📈21466, 21513, 21560
📉21325, 21280, 21230
Like and share for more daily ES/NQ levels 🤓📈📉🎯💰
*These levels are derived from comprehensive backtesting and research and a quantitative system demonstrating high accuracy. This statistical foundation suggests that price movements are likely to exceed initial estimates.*
Nasdaq

Buy Costco Wholesale CorporationShort Term Trading Advice by Naranj Capital
Buy Costco Wholesale Corporation
● Buy Range- 1035 - 1050
● Target- 1101 - 1110
● StopLoss- 1010
● Potential Return- 5-6%
● Duration- 12-14 Trading Days

Nasdaq-100 H4 | Overhead pressures persistNasdaq-100 (NAS100) is rising towards a pullback resistance and could potentially reverse off this level to drop lower.
Sell entry is at 21,391.40 which is a pullback resistance that aligns close to the 38.2% Fibonacci retracement level.
Stop loss is at 21,650.00 which is a level that sits above the 50.0% Fibonacci retracement and a pullback resistance.
Take profit is at 20,777.93 which is a swing-low support.
High Risk Investment Warning
Trading Forex/CFDs on margin carries a high level of risk and may not be suitable for all investors. Leverage can work against you.
Stratos Markets Limited (www.fxcm.com):
CFDs are complex instruments and come with a high risk of losing money rapidly due to leverage. 63% of retail investor accounts lose money when trading CFDs with this provider. You should consider whether you understand how CFDs work and whether you can afford to take the high risk of losing your money.
Stratos Europe Ltd (www.fxcm.com):
CFDs are complex instruments and come with a high risk of losing money rapidly due to leverage. 63% of retail investor accounts lose money when trading CFDs with this provider. You should consider whether you understand how CFDs work and whether you can afford to take the high risk of losing your money.
Stratos Trading Pty. Limited (www.fxcm.com):
Trading FX/CFDs carries significant risks. FXCM AU (AFSL 309763), please read the Financial Services Guide, Product Disclosure Statement, Target Market Determination and Terms of Business at www.fxcm.com
Stratos Global LLC (www.fxcm.com):
Losses can exceed deposits.
Please be advised that the information presented on TradingView is provided to FXCM (‘Company’, ‘we’) by a third-party provider (‘TFA Global Pte Ltd’). Please be reminded that you are solely responsible for the trading decisions on your account. There is a very high degree of risk involved in trading. Any information and/or content is intended entirely for research, educational and informational purposes only and does not constitute investment or consultation advice or investment strategy. The information is not tailored to the investment needs of any specific person and therefore does not involve a consideration of any of the investment objectives, financial situation or needs of any viewer that may receive it. Kindly also note that past performance is not a reliable indicator of future results. Actual results may differ materially from those anticipated in forward-looking or past performance statements. We assume no liability as to the accuracy or completeness of any of the information and/or content provided herein and the Company cannot be held responsible for any omission, mistake nor for any loss or damage including without limitation to any loss of profit which may arise from reliance on any information supplied by TFA Global Pte Ltd.
The speaker(s) is neither an employee, agent nor representative of FXCM and is therefore acting independently. The opinions given are their own, constitute general market commentary, and do not constitute the opinion or advice of FXCM or any form of personal or investment advice. FXCM neither endorses nor guarantees offerings of third-party speakers, nor is FXCM responsible for the content, veracity or opinions of third-party speakers, presenters or participants.

Nasdaq market analysis: 26-Feb-2025Good morning! Here's your daily Nasdaq market analysis. Learn, grow, and trade wisely.

Combined US Indexes - Incoming Break or Bounce ?From the previously marked timeline on 18 Feb 2025, just days later, you see the combined US Indexes plummet to cut through the middle decision box (purple), and extrude out below. This formed the double top second peak in essence, and the days following just closed at a two month low.
While this might appear Bearish, it is worth noting the lower tails in previous candles which are followed by rallies to the upper resistance. Would this happen the third time?
I would beg to differ...
In fact, marked out is a critical support point which should be tested in early March. At that point (yellow ellipse), there is a confluence of a previous trend change support, the current TDST and just below that the larger consolidation range support.
While the RoVD is slightly bullish, the MACD is dipping with MACD in bearish lower half, and the signal line tapering down towards the boundary into bear territory.
In summary, it looks slightly bearish to the critical support point. From there, it would be good to see if it bounces or it breaks down.

DJT - Parabolic Move IncomingNASDAQ:DJT is soon in my mind to begin the most insane of rallies. This chart for me is as clean as they come!
Recent Price Action
From the peak of October 2024 to recent days in February 2025 - the stock has seen a ~46% correction, in what is likely the completion of an Elliott Wave 2 correction (in X,Y,Z form).
This after a bullish initial Wave 1 formation saw it go beyond even the most bullish of bullish initial price targets, in just 2 weeks flat.
Price had prior to that been compressed inside a downwards-pointing wedge pattern (orange lines), since late March 2024. This is one of my most favourite bullish chart patterns. It often leads to explosive price action.
After breaking out of the wedge, it is now not-only putting the finishing touches to an Inverse Head & Shoulder pattern (grey text)... but when it does so it will also complete a massive Cup & Handle formation (white arrows).
Future Price Targets
The initial target (T1) from this move would be $570 (20x) in a very short period. Perhaps even by end of June 2025. This would coincide with the 1.414 fibonacci level. Drawn from its initial introduction to public markets to its peak just weeks later.
Thereafter, an extended 5th wave target of $1,020 (43x) could be reached sometime around late November 2025 and January 2026. This coincides with the 1.618 fibonacci level (darker blue T2 line).
Price as of today has overshot the 0.382 fibonacci line and back-tested the previously-formed left shoulder. It is likely to find support here on the yellow line.
Next Up...
Volume has been pitiful of late. Watch it ramp-up again in the next few days, just like we saw in September 2024 when it completed its full retrace.
It is my expectation that we will see rest of the markets surprising bears, with a huge reversal before March, perhaps even combined with a significant dollar devaluation.
During this time when volume picks-up, a sharp reversal to the upside out of its latest wedge (dark red lines) is possible before the week ends on 28th February. If this occurs, this will likely confirm the end to Wave 2 of 5.
If there is any further downside to come, the absolute worst case scenario will likely be ~$18 - coinciding with the 0.238 fib. However this is not expected, just something to be wary of.
NASDAQ:DJT from here is ready to begin the most volatile of Elliott Waves, Wave 3. If volume persists, price will be drawn like a magnet to the horizontal sloping trend line in bold white.
Possible Elliott Waves
Wave 1 - $12 to $55
Wave 2 - $55 to $24
Wave 3 - $30 to $570
Wave 4 - $570 to $175
Wave 5 - $175 to $1,020
Ridiculous targets, right? So what could be the catalyst?
With the appointment of Kash Patel, we may now start seeing legal action taken against entities & individuals involved with naked short positioning. NASDAQ:DJT even in it's short history has been a prime target for this since 2022.
NASDAQ:DJT may be partially or heavily-involved with the Sovereign Wealth Fund being discussed for the United States.
NASDAQ:DJT may also complete the long-rumored acquisition of Bakkt Holdings ( NYSE:BKKT ). Perhaps even obtaining a minority stake in TikTok.
Short squeeze, M&A, fraudulent recovery, purchases of ETHUSD or just plain old organic price discovery - you pick your poison. But if you thought you'd seen NASDAQ:DJT reach its peak prior to the elections, be prepared to rethink your views.
NASDAQ:DJT has a LOT of room to the upside still from here. Make sure at the very least, you keep this one on your watch-list.
----
Note : This post was originally published on 2nd November 2024 in the lead-up to the election. It was popular but was hidden due to an error on my part including a private indicator. It has now been updated to account for recent price action & timing.

Today analysis for Nasdaq, Oil, and GoldNasdaq
The Nasdaq closed lower, continuing its selling pressure. The index quickly dropped to the lower boundary of a large range, touching the 120-day moving average. The daily MACD has formed a bearish crossover with the signal line, confirming the downtrend, and the index has now reached a potential support zone near previous lows. Yesterday provided a short opportunity at the 5-day moving average, and since there was no meaningful rebound, the gap between price and the 5-day MA has widened significantly. This suggests that a short-term technical bounce could occur based on intraday movements.
However, given the strong selling momentum on the daily chart, even if the market consolidates for a few days, further downside remains likely. If considering long positions, strict stop-loss management is essential. On the 240-minute chart, selling pressure continues to dominate, with both the MACD and signal line dropping sharply below the zero line. Comparing this to past price action near 20,763, the current MACD decline is even steeper, meaning that even if a short-term bounce occurs, the MACD is unlikely to recover back above zero easily. Overall, selling into rallies remains the preferred strategy, but traders should watch for intraday bottoming signals, as a bounce toward the 5-day MA is possible.
Crude Oil
Crude oil closed lower, weighed down by concerns over slowing consumer demand. On the daily chart, the sell signal remained intact, and the break below $70 has now confirmed a potential breakdown. Since $70 had been a key support/resistance level, the break below it suggests further downside risk. Today, a shorting opportunity may arise at the 3-day moving average, in line with technical retracement principles. However, the $66–67 range remains a strong support zone, so traders should monitor whether selling pressure is strong enough to push prices below this area. Since the MACD is turning sharply downward, and price action is forming a large bearish candle, the best strategy remains shorting into rallies near the 3-day MA.
On the 240-minute chart, a third bearish wave has developed, leading to an accelerated decline. Aside from potential buying at key support levels on the daily chart, selling into rallies remains the most favorable approach. Given that inventory data will be released today, traders should be cautious of increased volatility.
Gold
Gold closed sharply lower, forming a large bearish candle as the Consumer Confidence Index fell. Yesterday, gold was at a crossroads between a buy and sell signal, and with this bearish breakout, the sell signal is now confirmed. For now, gold is likely to trade within a broad range, as the daily MACD and signal line remain widely separated from the zero line. This suggests that while further downside is possible, periodic rebounds should also be expected.
Since gold has now fallen below the 10-day moving average and reached the 20-day MA, traders should treat the 3-day, 5-day, and 10-day MAs as key resistance levels, while the 20-day, 30-day, and 60-day MAs serve as support levels. On the 240-minute chart, the MACD has dropped below zero, with the signal line following downward. This reinforces a range-bound trading strategy, focusing on buying at major support levels while keeping in mind potential rebounds.
By analyzing the daily candles, traders can identify potential future scenarios for Nasdaq, oil, and gold. This is why daily and intraday technical analysis is essential. Additionally, NVIDIA’s earnings report will be released tonight, which could introduce further market volatility. Stay disciplined, manage risk carefully, and have a successful trading day!
If you like my analysis, please follow me and give it a boost!
For additional strategies for today, check out my profile. Thank you!

QQQ Thrives Amidst Trump Administration's UnpredictabilityQQQ still bullish amid all of the chaos of Trump's first few weeks. Friday saw a high that was just a touch shy of a new ATH. Next week will give us a good idea what the future is, if we pull back we may be seeing a double top if you are bearish or we could make a new ATH and power on higher with bulls in control.

NASDAQ Three conditions met for strong BUYNasdaq is trading inside a Channel Up in 2025 and today the price reached its bottom.
At the same time it marginally crossed under the MA100 (1d), making today's low the best technical buy opportunity since January 27th.
Trading Plan:
1. Buy on the current market price.
Targets:
1. 22370 (+6.92% rise like the previous two bullish waves).
Tips:
1. The RSI (4h) got oversold on the same level as the Jan 27th low. Overall, an oversold RSI on Nasdaq's last 6 month price action, has been a great buy opportunity.
Please like, follow and comment!!

Bullish on Monthly TF.Bullish on Monthly TF.
Double Bottom with Bullish Divergence is a
Positive Trigger.
2 Important Support Levels
S1 around 819 - 820
S2 around 720 - 722
Upside Targets can be around 970 - 975
Next Resistance is around 1000 - 1020

MicroStrategy The Next levels for Long positionsI have outlined the next important Levels for MSTR Longs using a suite of Fib tools . If you find value in my work then support me with a like/share/comment.

Reverse At Centerline In NQJust watch how price came down to the red Centerline. From there the Bulls where waiting.
Now we push back up to the white L-MLH.
Further potential targets are shown with the green arrows.
Just observe it and learn from it.
Done4Today §8-)

TP FILLED ON NASDAQMinutes ago, I posted to sell NASDAQ targeting the 4H LQ, and the market filled our target.
Follow for more!

SELL NASDAQToday we entered in a bearish position on NASDAQ in which we're trgeting the 4H LQ
I don't post at the same time we enter since I share it to my students.
Follow for more!

Aditxt (NASDAQ: ADTX) Set for 3,000% Surge Amidst Falling Wedge Aditxt Inc. (NASDAQ: ADTX) is on the brink of a potential game-changing breakout.
We believe NASDAQ: ADTX could deliver a staggering 3,000% surge, presenting a massive short-term opportunity while holding long-term potential as a leader in the biotech space.
About Aditxt Inc. (NASDAQ: ADTX)
Aditxt Inc. (NASDAQ: ADTX), a cutting-edge biotechnology company founded in 2017 and headquartered in Richmond, Virginia, is revolutionizing immune system monitoring and modulation through its groundbreaking technologies aimed at improving health outcomes. Operating within the healthcare sector, Aditxt specializes in developing and commercializing innovative solutions such as AditxtScore, a pioneering platform designed to help individuals understand, manage, and monitor their immune profiles, offering critical insights into immune responses and potential threats.
Technical Overview
Aditxt Inc. (NASDAQ: ADTX) shares have seen a 5.35% decline in the past 24 hours, currently trading within a steep falling wedge pattern—a historically bullish structure that often precedes explosive breakouts. This wedge has been forming since August 2023, signaling a prolonged consolidation phase. With RSI at 19, ADTX is in deeply oversold territory, making it an attractive setup for a significant reversal.
The support level has already been established, preventing further downside pressure. If ADTX breaks above the 38.2% Fibonacci retracement level, it could act as the catalyst for a 3,000% surge, as traders recognize the wedge breakout and align with the strengthening biotech sector trend.
Despite being listed on NASDAQ, ADTX has an intraday market cap of just $6.879 million, an unusually low valuation given its positioning. This makes it a prime candidate for a revaluation, especially as trading volume continues to rise, indicating increased interest from buyers.
Further reinforcing the bullish thesis is the fact that ADTX is trading below the 50-day, 100-day, and 200-day moving averages. Historically, when a stock is far below these levels with growing volume, it often signals a reversal is on the horizon. The combination of a tight trading range, declining seller pressure, and increasing accumulation suggests that ADTX is nearing a breakout point, with technical conditions aligning for a massive upward move.
#Sponsored

Nasdaq market analysis: 25-Feb-2025Let’s dive into today's Nasdaq market analysis. Share insights, and potentially spot opportunities for good pips.

NAS100 Analysis: Key Levels & Bearish Trade Setup📊 NAS100 Analysis and Trade Idea | Key Levels & Bearish Bias Explained 📉
Dive into a detailed analysis of the NAS100 (NZ 100) with a focus on key support zones, retracement levels, and a bearish trading bias. Learn how to identify overextended price movements, imbalances, and potential short setups using the daily and 4-hour timeframes. Perfect for traders looking to refine their strategies in indices trading! 💡 💬 Share your thoughts and trading ideas in the comments below!

Today analysis for Nasdaq, Oil, and GoldNasdaq
The Nasdaq closed lower following news that Microsoft is reducing its data center leasing. This week, the weekly chart suggests strong selling pressure, meaning long positions should be approached with caution.
On the daily chart, yesterday’s bearish candle confirmed the MACD sell signal, though the signal line remains above the zero line. In a broader context, a potential bounce could occur near key technical levels, including the lower Bollinger Band, 120-day moving average, and previous resistance zones.
Two days ago, a large bearish candle formed, and yesterday’s price action provided an opportunity to sell at the 3-day moving average. However, the market failed to test the 3-day MA during pre-market, leading to a false impression that the daily close was rejected at resistance. This illustrates how a daily close can sometimes be misleading, reinforcing the need to plan for alternative scenarios.
Since selling was executed at the 3-day MA yesterday, today’s key resistance level shifts to the 5-day moving average. Given the wide gap between price and the 5-day MA, a short-term rebound toward this level is possible.
On the 240-minute chart, both the MACD and signal line have moved below the zero line, confirming continued selling pressure. However, since the Nasdaq has now entered a key support zone from a previous range, a short-term bounce toward the 5-day MA is possible. Traders should be cautious with short positions and focus on range-bound strategies rather than chasing downside momentum.
Crude Oil
Crude oil gapped down but managed to close higher. Despite the ongoing MACD sell signal on the daily chart, oil held above the key $70 support level.
This week’s weekly close is critical—if oil can end the week with a bullish candle, it could set the stage for a potential reversal. Holding above $70 remains the key technical factor, as a breakdown below this level would signal further downside.
On the daily chart, if the market fails to extend lower and instead rebounds, a MACD double-bottom pattern could develop, reinforcing potential upside momentum. However, since market flows remain mixed, it is best to treat oil as range-bound until a decisive break occurs.
On the 240-minute chart, both the MACD and signal line are below the zero line, but price action is attempting a temporary rebound. While selling into rallies remains the preferred approach, traders should be cautious of event-driven volatility, as news developments could trigger sudden moves.
The $70 level remains the key downside level to monitor—if it breaks, selling pressure could intensify. Risk management is crucial when taking long positions.
Gold
Gold briefly made new highs before closing flat within its range. On the daily chart, the buy signal remains intact, but today’s session will be crucial in determining whether gold can sustain its momentum or enter a consolidation phase.
The key factor to watch is whether gold finds support at the signal line and continues higher or if a bearish crossover forms, leading to a range-bound correction.
On the 240-minute chart, a bullish MACD crossover has occurred, but for the uptrend to be confirmed, a strong breakout candle is needed. Without a significant bullish move, gold risks forming a bearish divergence, meaning that even if price breaks to new highs, the MACD may fail to confirm the move.
Since market flows remain mixed, a range-trading approach remains most effective, with a focus on buying at strong support levels and avoiding breakout trades. Traders should remain flexible and manage risk carefully, as both upside and downside scenarios remain open.
Looking at VIX futures, a strong buy signal has emerged at the zero level. Historically, VIX buy signals near zero tend to generate large price swings, suggesting that Nasdaq volatility may increase significantly. This increases the likelihood of a sharp correction, making risk management a top priority.
Stay disciplined, manage risk carefully, and wishing you a successful trading day! 🚀
If you like my analysis, please follow me and give it a boost!
For additional strategies for today, check out my profile. Thank you!
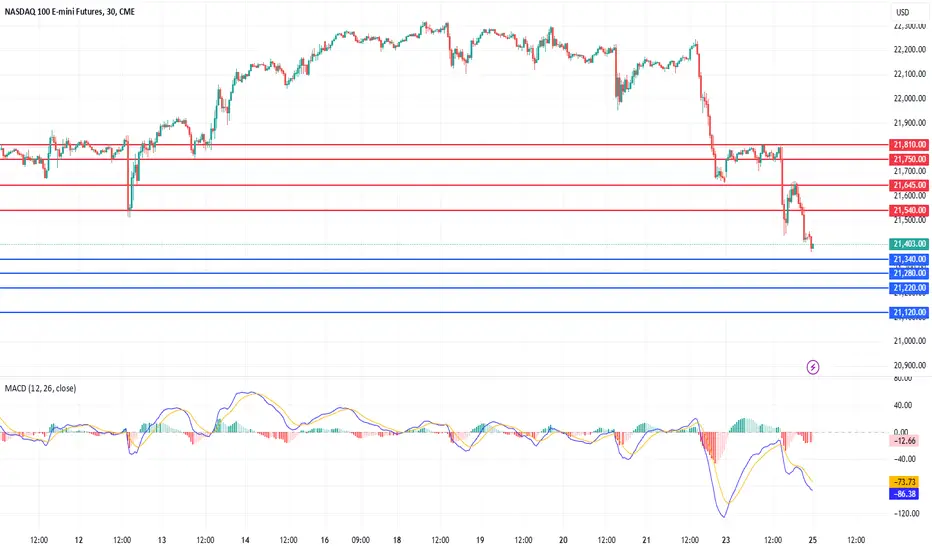
2025-02-24 - priceactiontds - daily update - nasdaqGood Evening and I hope you are well.
comment: Bears have turned 21650 (last weeks low) resistance, which is a huge sign of strength. Their problem is, that they could not break below the previous bear trend line and as long as that holds, we could have another bounce from 21400 up to 500 or 600. It’s a clear bear wedge and I think the next push down would bring us much closer to the bull trend line around 21200. For now I still don’t have any confidence in the bears to make new lows below 20900.
current market cycle: trading range
key levels: 21000 - 21700
bull case: Bulls bought the dip but it keeps dipping. They failed to get above Friday’s low 21650 and after 2h of trying bulls gave up and we closed at new lows. Bulls now need to keep the bear wedge alive and buy 21400 to test back up to 21500 or 600. Market is respecting the trend lines and 1h ema. So don’t bet on a breakout of either. Wait for it to happen and tag along. Bulls can only turn this neutral with consecutive 1h closes above the 20ema.
Invalidation is below 21300.
bear case: Bears did amazing, which is surprising to me. They have no erased 2 weeks of gains in 3 days. Interesting to say the least. Lower targets are 21200, followed by 21000 and 20940. The bear wedge is valid until broken and I wait for the Globex open to see if bulls buy 21400 or bears want blood. I do think it’s more reasonable to expect the trend lines to hold and chop some up to at least 21500 and getting closer to the 1h ema before we can have a third leg down.
Invalidation is above 21700.
short term: Bearish near the 1h 20ema or upper bear wedge line. Would be amazing to see 21000 this week but for now I still have doubts.
medium-long term - Update from 2024-02-23: Neutral since we are in a 4-5 month trading range. Still leaning heavily bearish for this year but for now it’s sideways until we get consecutive daily closes below 20000.
trade of the day: Buying the Globex open obviously and then shorting 21600 once we broke below the 15m ema again at bar 52 or 53.

MNQ!/NQ1! Day Trade Plan for 02/24/2025MNQ!/NQ1! Day Trade Plan for 02/24/2025
📈21845.50, 21893, 21940.50
📉21704, 21657, 21609
Like and share for more daily ES/NQ levels 🤓📈📉🎯💰
*These levels are derived from comprehensive backtesting and research and a quantitative system demonstrating high accuracy. This statistical foundation suggests that price movements are likely to exceed initial estimates.*

META Technical Analysis: Potential Buy OpportunityMETA is currently exhibiting a bullish trend, trading above both its 100-day SMA and a key weekly trendline. The stock is currently retracing, having recently tested the 0.5 Fib retracement level, a common area of support. The RSI is also synced with the price action, further supporting the bullish outlook. This pullback could present a favorable buying opportunity.
Trading Recommendations:
Buy 1 (CMP): 669
Buy 2: 642
Stop-Loss: Closing below 575
Take Profit 1: 738
Take Profit 2: Open
A stop-loss order placed below the last higher low, which is also positioned below the trendline, is recommended on a closing basis. A laddered buy approach is suggested to take advantage of potential further price dips. Happy trading!

Nas100 sudden crash heading towards which level?Hello Guys. Wish you a Great weekend.
A quick update on nas100 cfd, which we will witness moving below 21400 level , which is very high probability. just waiting for the Monday London session to frame the entry and stoploss.
stay tuned to this post. i will update the entry , stoploss and risk reward about this setup
good luck good trading

NASDAQ 4 more months before next correction.Nasdaq (NDX) has been rising non-stop with the 1W MA50 (blue trend-line) as its Support since it first broke above it in March 13 2023, following the 2022 Inflation Crisis Bear Cycle.
This continuous period of growth has been built on a prolonger Bearish Divergence based on the 1W RSI, which has been on Lower Highs since June 05 2023. It is not the first time in recent history that the index has seen this pattern, as in the last 10 years we have had 2 periods of similar growth.
The 2014 - 2015 phase came to a sudden end in the first week of January 2016 after having marginally topped above the 4.0 Fibonacci extension. The 1W RSI Bearish Divergence eventually kicked in and the price dipped below the 1W MA100 (green trend-line), while an RSI below 40.00 formed the bottom.
Similarly, the 2018 - 2019 phase got hammered in early February 2020 after topping very close to the 4.0 Fib ext, again sharply declining below the 1W MA100, finding support exactly on the 1W MA200 (orange trend-line). We need to point out that this was a (technically) exaggerated price collapse though due to the COVID lockdowns.
As mentioned above, we are facing again an RSI Bearish Divergence and if the price action follows the previous two periods that both, amazingly enough, lasted for 742 days (106 weeks) from the first RSI High, we should be expecting a technical peak around June 23 2025 (exactly 4 months from now) near a 4.0 Fibonacci extension at 23500.
-------------------------------------------------------------------------------
** Please LIKE 👍, FOLLOW ✅, SHARE 🙌 and COMMENT ✍ if you enjoy this idea! Also share your ideas and charts in the comments section below! This is best way to keep it relevant, support us, keep the content here free and allow the idea to reach as many people as possible. **
-------------------------------------------------------------------------------
Disclosure: I am part of Trade Nation's Influencer program and receive a monthly fee for using their TradingView charts in my analysis.
💸💸💸💸💸💸
👇 👇 👇 👇 👇 👇
