MNQ!/NQ1! Day Trade Plan for 02/19/25MNQ!/NQ1! Day Trade Plan for 02/19/25
📈22225, 22320
📉22130, 22106
Like and share for more daily ES/NQ levels 🤓📈📉🎯💰
*These levels are derived from comprehensive backtesting and research and a quantitative system demonstrating high accuracy. This statistical foundation suggests that price movements are likely to exceed initial estimates.*
Nasdaq

NASDAQ Potential UpsidesHey Traders, in today's trading session we are monitoring NAS100 for a buying opportunity around 21800 zone, NASDAQ is trading in an uptrend and currently is in a correction phase in which it is approaching the trend at 21800 support and resistance area.
Trade safe, Joe.

OUR TRADE ON NASDAQThis is our trade for today on nasdaq in which we sold and recovered the loss we made on gold and made more profits on it.
I didn't share it to public since I gave it to my students, now after the TP reached here you are watching it!
Follow us for more!

Arista Networks Dips 4% Premarket Despite Strong Q4 FinancialsArista Networks (NASDAQ: NYSE:ANET ) saw a 4% dip in premarket trading despite delivering better-than-expected revenue and earnings in its latest quarterly report. The stock's recent movement raises questions about market sentiment and potential buying opportunities.
Strong Revenue and Earnings Growth
Arista Networks, a leader in cloud networking, reported a fourth-quarter revenue of $1.93 billion, reflecting a 7% year-over-year increase. This beat analyst estimates and demonstrated the company’s ability to sustain growth even amid economic uncertainty.
Net earnings surged to $830.1 million (65 cents per share), compared to $664.3 million (52 cents per share) in the prior year. These strong financials reflect Arista’s continued dominance in the cloud networking industry, particularly as it pushes further into AI-driven initiatives.
Additionally, Arista Networks provided an optimistic forecast for the first quarter of 2024, expecting revenue between $1.93 billion and $1.97 billion, surpassing analysts' expectations. This suggests that despite short-term price volatility, the company’s long-term growth remains intact.
Market Sentiment and Analyst Ratings
Despite the positive earnings report, NYSE:ANET faced early selling pressure. However, analysts remain bullish on the stock, with an average "Buy" rating from 15 analysts. The 12-month price forecast stands at $108.38, representing a slight downside of -3.12% from the latest price, indicating that the market might already be factoring in Arista’s growth potential.
Technical Analysis
From a technical perspective, NYSE:ANET ’s premarket drop of 4.11% has placed its Relative Strength Index (RSI) at 47, signaling that the stock is approaching oversold territory but not yet at extreme levels.
Currently, the stock is trading above key moving averages (MA), suggesting that the broader uptrend remains intact. However, the dip brings NYSE:ANET close to its one-month low, a temporary support level that traders should watch closely. If selling pressure continues, a break below this level could lead to further downside.
That said, this retracement could also be a strategic move to sweep liquidity and attract demand for a potential rebound. Investors should watch for price stabilization and confirmation of renewed buying interest before making any decisive moves.
Conclusion
Despite the early sell-off, Arista Networks’ strong fundamentals, growing revenue, and positive long-term outlook position it as a solid investment choice. The recent dip may be an opportunity for traders to capitalize on a short-term pullback before the stock resumes its upward trajectory. As always, monitoring key technical levels and broader market trends will be crucial in assessing NYSE:ANET ’s next move.

BILI Projects to $100Bilibili Inc. is a leading provider of online entertainment tailored for the youth of the People's Republic of China. The company boasts a diverse array of digital offerings, including professionally produced user-generated videos, mobile gaming experiences, and enhanced services like live streaming, occupationally created videos, audio dramas on Maoer, and comics available through Bilibili Comic. Additionally, Bilibili offers advertising solutions, IP derivatives, and various other services. The company is also involved in business and technology development, e-commerce, and the distribution of videos, comics, and games. Established in 2009, Bilibili Inc. is based in Shanghai, China.
Bilibili is currently priced at $20.81, indicating it may be undervalued according to discounted cash flow analysis, which suggests a fair value of $28.84. Although there has been notable insider selling recently, the stock remains 28% below its estimated fair value and is projected to achieve profitability within the next three years, surpassing average market growth rates. While the anticipated revenue growth of 10.2% per year is not as robust as one might hope, it still outpaces the overall US market's growth rate of 8.9%.

Riding Wave 5: Is $700 Just Around the Corner?Hey Realistic Traders, Will META Bullish Bias Continue ? Let’s Dive In....
In the Daily timeframe, META rebounded above the 38.2% Fibonacci level, marking the completion of wave 4. Within this wave, a Descending broadening wedge pattern was formed. Recently the price has broken out of the pattern. This breakout was further confirmed by a bullish MACD crossover, signaling increasing momentum and strengthening the case for a continued upward move.
Based on these technical signals, I foresee a potential upward movement toward the first target at $638. After reaching this level, a minor pullback is likely before the rally continues toward a new high at $700.
This outlook remains valid as long as the price holds above the stop-loss level at 550.00.
Support the channel by engaging with the content, using the rocket button, and sharing your opinions in the comments below.
Disclaimer: "Please note that this analysis is solely for educational purposes and should not be considered a recommendation to take a long or short position on META.

Today analysis for Nasdaq, Oil, and GoldNasdaq
The Nasdaq closed flat with a doji candle, facing resistance at previous highs. As mentioned yesterday, there was a possibility of a pullback to the 5-day moving average, and while the market did not fully correct to that level, it did consolidate and pull the 5-day MA higher, suggesting a preparatory phase for further upside.
On the daily chart, the MACD and signal line remain upward-facing, indicating that buying dips remains the preferred strategy. However, since trading volume remains relatively low and market flows appear mixed, it is advisable to take profits quickly when buying dips rather than holding for extended gains.
On the 240-minute chart, a sell signal has appeared at the highs, meaning that a pullback toward the upper boundary of the previous range is possible. Given the doji candle on the daily chart, traders should be cautious about chasing longs in the pre-market session. If the MACD turns downward, selling pressure could intensify.
That said, the MACD and signal line remain well above the zero line, suggesting that rebound attempts are likely. While the sell signal remains active, short positions should be managed with strict stop-loss levels.
Tonight, the FOMC meeting minutes will be released, so be mindful of potential volatility during the regular session and after-hours trading.
Crude Oil
Crude oil closed higher, testing $72 as resistance while forming a potential double-bottom pattern. The MACD on the daily chart is approaching a key decision point, where it will either bullishly cross above the signal line or turn lower again, determining the next directional move.
Since the signal line is near the zero level, the next buy or sell signal is likely to trigger a significant price move. Additionally, the ongoing Ukraine-Russia peace negotiations remain a key geopolitical risk factor, as any developments could lead to increased oil price volatility.
From a technical perspective, oil remains within a range-bound structure, making buying dips the most effective approach. A break below $70 would be a bearish signal, while sustained movement above $72 could confirm a breakout.
On the 240-minute chart, the MACD has moved above the zero line, lifting the signal line upward. While a short-term pullback is possible, as long as the MACD does not form a bearish crossover, buying pressure could strengthen further.
Gold
Gold closed higher, rebounding from previous levels. Yesterday’s price action confirmed that the MACD used the signal line as support and turned higher, reinforcing the bullish trend.
Since the MACD has not yet crossed below the signal line, the daily chart remains in a buy-biased structure, meaning that until a confirmed bearish crossover occurs, the market should still be approached with a buy-on-dip mindset.
However, if gold moves above its previous high but the MACD fails to exceed its previous peak, a bearish divergence could form, increasing the risk of a sharp correction. Traders should remain aware of this scenario and avoid chasing long positions at elevated levels.
On the 240-minute chart, the MACD has crossed above the signal line near the zero level, generating a strong upward wave. However, the market is approaching key resistance zones, and if another rally occurs, a bearish divergence could develop, reinforcing the need for cautious positioning.
Buying at major support levels remains the safest strategy, while avoiding breakout trades is advisable.
With the FOMC meeting minutes set for release tonight, overnight positions in gold should be managed carefully due to the potential for increased volatility.
Despite high market volatility, trends remain clear across different asset classes, making trading conditions manageable. Instead of attempting countertrend trades, focus on following the prevailing trend and capitalizing on structured setups.Wishing you a successful trading day!
If you like my analysis, please follow me and give it a boost!
For additional strategies for today, check out my profile. Thank you!

NASDAQ Bullish Breakout!HI,Traders !
NASDAQ is trading in a
Local uptrend and
Made a bullish breakout of
The key horizontal level
Of 22062.4 and the breakout
Is confirmed so we will
Be expecting a further
Bullish continuation !
Comment and subscribe to help us grow !

2025-02-18 - priceactiontds - daily update - nasdaqGood Evening and I hope you are well.
comment: Bears started the day very bearish and printed decent bear bars down to 22200 but bears failed to find sellers below 22130 and we went sideways 22100-22200 until we saw bigger buying coming through again and bears gave up late into the day. Bulls closed it between Friday’s close and today’s open, so the day was neutral as can be. Bears failed to get down to 22k which is my line in the sand for them. We have to expect higher prices, given that this was a shallow sideways correction on the daily chart.
current market cycle: trading range
key levels: 22100 - 22500
bull case: Bulls happily buying every dip and bears could not even touch the breakout price of 22094 (January high). Can only see today’s price action as bullish and on the 4h chart it’s a two-legged pullback to the 20ema with a decent buy signal bar now. Longs with stop 22090 are reasonable for target 22450+.
Invalidation is below 21900.
bear case: Bears tried an failed. They made some points and then covered as bigger buying came late in the day. They need a strong 1h bar close below 22k to turn this neutral again. For now they can only hope to sell new highs and scalp some points. Most bears wait for 22450ish and if we find more sellers there.
Invalidation is above 22150.
short term: Bullish. Below 22k that changes but for now you can buy every good bullish signal bar after a dip.
medium-long term - Update from 2024-02-16: Bulls are on their way of making a new ath again. So no bearish thoughts until market character changes dramatically again. I can see this going up to 23000 but not beyond. No bigger opinion on a medium-term outlook for this.
trade of the day: Very good bearish signal bar going into US open and then follow-through to 22200. Market then printed bar 36 + 37 and the big tails below was a good sign to be cautious with shorts because we are finding more buyers in that area, so the downside might probably be limited. Market then went sideways until we made a lower low major trend reversal with bar 53 + 54. 55 was the bar to go long on but could also have waited for bar 56. This has now also build a head & shoulders bottom and a measured move brings us above 22300 again.

Tracking Crisis with This Ratio – US Markets vs GoldThese are the 3 major crisis over the last 25 years. The dot com, 08 and the recent 9% inflation crisis.
Before each crisis get into its full swing, I have observed there was a surge in gold.
In this tutorial, I will share:
1) Why a surge in gold before each crisis?
2) What are the key variables that we should be looking out for this year? and
3) I hope I don’t sound too ambitious in discussing how to time this move?
E-mini Nasdaq Futures & Options
Ticker: NQ
Minimum fluctuation:
0.25 index points = $5.00
Micro E-mini Nasdaq Futures & Options
Ticker: MNQ
Minimum fluctuation:
0.25 index points = $0.50
Disclaimer:
• What presented here is not a recommendation, please consult your licensed broker.
• Our mission is to create lateral thinking skills for every investor and trader, knowing when to take a calculated risk with market uncertainty and a bolder risk when opportunity arises.
Trading the Micro: www.cmegroup.com
CME Real-time Market Data help identify trading set-ups in real-time and express my market views. If you have futures in your trading portfolio, you can check out on CME Group data plans available that suit your trading needs www.tradingview.com

MNQ!/NQ1! Day Trade Plan for 02/18/25MNQ!/NQ1! Day Trade Plan for 02/18/25
📈22410, 22500
📉22225-22210, 22130
Like and share for more daily ES/NQ levels 🤓📈📉🎯💰
*These levels are derived from comprehensive backtesting and research and a quantitative system demonstrating high accuracy. This statistical foundation suggests that price movements are likely to exceed initial estimates.*

AMAZON: Good results and in the 61.8% Fibonacci zone! Pay attentAmazon presented results on February 7th, beating expectations driven by the cloud business.
AWS stands out with a growth of +19%, a pace that it has maintained for 3 consecutive quarters. Revenues on the online platform grow +8%, advertising +18% and third-party services +9%. Efficiency measures and the greater growth of AWS and advertising, with higher margins, boost EBIT +60.5% with a margin improvement of +350 bp to 11.3%.
AI will continue to be a growth factor in 2025 after the alliance with Anthropic and new AI applications. But the guidance for 1Q25 is disappointing, indicating that Amazon remains cautious in an environment of uncertainty due to the impact of tariffs on China (25% of its online sales are of Chinese products) and adverse effects due to exchange rates. Despite a weaker than expected 1Q25, we remain positive on the stock.
The advertising business is growing at a good pace and Amazon is already the third largest operator after Google and Meta, with a global share of 9%. On the online sales front, the group is reducing delivery times to face growing competition from Walmart and Temu. With a 47% market share in the cloud business in 2023 (55% excluding China), Amazon remains one of the companies that will benefit the most from the adoption of generative AI, ranking among the preferred providers of AI-based services/apps for users, although investment efforts and a moderation in consumption are slowing short-term growth prospects.
--> What does it look like technically?
So far this year, it has a cumulative revaluation of +4% and its trend is clearly bullish, so we will ONLY look for LONGs. It is currently in a RECOVERY PHASE and has already reached the 50%-61.8% Fibonacci zone, which means it is in a key zone from which it could end the retracement and start a new bullish impulse on the way to new highs.
Last Friday the IVO oscillator warned us of overselling, and if we add to that the fact that its trend is clearly bullish and that it has a retracement of almost 61.8% Fibonacci, it is very likely that the MOMENTUM will soon turn bullish (Bull) and we can make a long entry.
---------------------------------------
Strategy to follow:
ENTRY: We will open 2 long positions if it exceeds the 236 zone
POSITION 1 (TP1): We close the first position in the 245 zone (+4%)
--> Stop Loss at 226 (-4%).
--> Ratio ( 1:1 )
POSITION 2 ( TP2 ): We open a Trailing Stop type position.
--> Initial dynamic Stop Loss at (-4%) (coinciding with the 226 of position 1 ).
--> We modify the dynamic Stop Loss to (-1%) when the price reaches TP1 ( 245 ).
-------------------------------------------
SET UP EXPLANATIONS
*** How do you know which 2 long positions to open? Let's take an example: If we want to invest 2,000 euros in the stock, what we do is divide that amount by 2, and instead of opening 1 position of 2,000, we will open 2 positions of 1,000 each.
*** What is Trailing Stop ? A Trailing Stop allows a trade to continue gaining value when the market price moves in a favorable direction, but automatically closes the trade if the market price suddenly moves in an unfavorable direction by a certain distance. That certain distance is the dynamic Stop Loss.
-->Example: If the dynamic Stop Loss is at -1%, it means that if the price drops by -1%, the position will be closed. If the price rises, the Stop Loss also rises to maintain that -1% on rises, therefore, the risk is increasingly lower until the position becomes profitable. In this way, very solid and stable price trends can be taken advantage of, maximizing profits.

Nasdaq market analysis: 18-Feb-2025Good morning, traders! Welcome to today's Nasdaq market analysis. Compare my price action insights with your own charts and enhance your trading skills.

Today analysis for Nasdaq, Oil, and GoldNasdaq
The Nasdaq rose within a small range, forming a box consolidation pattern. On the daily chart, buying pressure remains strong, and today’s candlestick will merge with yesterday’s due to the holiday. As mentioned previously, today is a key session where the 5-day moving average may provide support, meaning a pullback to this level is possible.
Since yesterday’s high remained in a consolidation phase, the pre-market and regular session today could see some downside movement. The reason is that the market has yet to test a key level, which increases the likelihood of a short-term pullback.
On the 240-minute chart, the buy signal remains intact, but low-volume choppy price action persists. If a sell signal emerges on the 240-minute chart, the Nasdaq could correct down to the 5-day MA, making this a key area to consider buying dips.
Since today’s candle will be a combined session with yesterday, traders should expect price swings that normally unfold in one day to play out over two sessions.
Crude Oil
Crude oil closed higher within a neutral range, forming a bullish daily candle. The key focus now is whether oil can sustain its double-bottom structure, leading to further upside.
For the MACD and signal line to maintain a sell signal on the daily chart, oil must break decisively below $70 by the daily close. If this does not happen, a double-bottom reversal could trigger a rebound, meaning traders should be cautious with short positions.
On the 240-minute chart, a buy signal has appeared, following a false breakdown and a potential double-bottom formation. If holding short positions, be aware of the risk of a sudden price surge.
With ongoing Ukraine-Russia peace negotiations, oil volatility could increase, so traders should remain cautious. A break above $72 would be a bullish confirmation, while a failure to hold $70 support could lead to another leg down. Risk management is crucial.
Gold
Gold rebounded on the daily chart, closing higher. The MACD has not yet crossed below the signal line, meaning that the market remains in a buy-biased structure, increasing the likelihood of continued upside.
While buying dips remains the preferred strategy, gold has already tested the 3-day and 5-day moving averages, meaning traders should now focus on lower time frames for entry confirmation.
If gold continues to rise today and breaks above the 3-day and 5-day moving averages, the MACD could turn higher again, confirming that the buy trend remains intact. However, if gold declines and the MACD forms a bearish crossover, traders should prepare for a potential move down toward the 20-day moving average, adjusting their strategy accordingly.
On the 240-minute chart, the MACD has dropped below the zero line, but the signal line remains above zero, suggesting that rebound attempts are likely. However, since the MACD’s downward slope is steep, a quick bullish crossover is unlikely. Even if gold rises, it may face resistance and pull back again, meaning traders should avoid chasing breakouts.
If the signal line falls below zero, this would be a bearish confirmation, making it safer to trade within a range—selling near highs and buying at lower support levels.
Given yesterday’s holiday, today could see increased volatility as markets adjust. Additionally, Wednesday’s FOMC meeting minutes release is expected to introduce further market swings.
Risk management is key—stay disciplined, and have a successful trading day! 🚀
If you like my analysis, please follow me and give it a boost!
For additional strategies for today, check out my profile. Thank you!

MNQ!/NQ1! Day Trade Plan for 02/17/25MNQ!/NQ1! Day Trade Plan for 02/17/25
📈22320-22350
📉22190-22130
Like and share for more daily MNQ/NQ levels 🤓📈📉🎯💰
*These levels are derived from comprehensive backtesting and research, demonstrating over 90% accuracy. This statistical foundation suggests that price movements are likely to exceed initial estimates.*

What's next for Microsoft?The 50 EMA (green line) has historically acted as dynamic support, but with price now trading below it, there is a clear shift in momentum toward the bearish side. If price fails to reclaim the 50 EMA (currently around $415-$420) and faces rejection, it could signal further downside toward the $380 support zone, making a short trade viable with a stop above $426. However, if buyers step in at $387-$390 and we see a strong bullish reaction, it could lead to a rebound toward the 50 EMA and potentially the $427-442 distribution zone. The key decision point lies in whether price can reclaim or decisively reject the 50 EMA, dictating the next major move. A clean reclaim would signal bullish continuation, while a firm rejection could confirm further downside before any recovery.
Disclaimer:
This analysis is for educational purposes only and should not be considered financial advice. Trading and investing involve risk, and independent research or consultation with a professional is recommended before making any financial decisions.

MNQ!/NQ1! Day Trade Plan for 02/14/25MNQ!/NQ1! Day Trade Plan for 02/14/25
📈22320-22350
📉21975-21940
Like and share for more daily MNQ/NQ levels 🤓📈📉🎯💰
*These levels are derived from comprehensive backtesting and research, demonstrating over 90% accuracy. This statistical foundation suggests that price movements are likely to exceed initial estimates.*

SPX - Extreme Greed SPX value has extended too far from its common trend line that extends a LONG time back
We are in a hyper bubble and don't even know it
I have been bearish on SPX for awhile now and am just waiting for the collapse
Period of extreme greed
Respect the Trend Line
3 Monthly chart

NASDAQ The 3 Phase of its Bull Cycle.Nasdaq (NDX) had a strong closing last week, rallying aggressively after cementing the 4H MA50 (blue trend-line) as Support. As the market will stay closed today on Washington's Holiday, it is a good opportunity to take the time and look at the bigger picture.
Nasdaq's whole Bull Cycle so far since the late 2022 market bottom, can be categorized into 3 separate Phases of Growth. Right now we are naturally on the 3rd and as you see, compared to the previous Phases, we are on the 2nd accumulation of the Phase. This has led on a strong rally of at least +22% that completed each Phase.
Each Phase has two such accumulations and the 2nd is what makes the Channel Up peak and then correct back to the 1D MA200 (red trend-line). Since the final accumulation rally of Phase 1 has been +25.78% and the one of Phase 2 +22.13%, we may have a -3.50% decrease rate between each Phase rally. Assuming this to be the case this time around too, we may be looking for a +18.60% rally at 24000 to complete Phase 3.
-------------------------------------------------------------------------------
** Please LIKE 👍, FOLLOW ✅, SHARE 🙌 and COMMENT ✍ if you enjoy this idea! Also share your ideas and charts in the comments section below! This is best way to keep it relevant, support us, keep the content here free and allow the idea to reach as many people as possible. **
-------------------------------------------------------------------------------
💸💸💸💸💸💸
👇 👇 👇 👇 👇 👇

Is the NAS100 Setting Up for a Reversal? Here’s My Game Plan!👀 👉 In this video, we break down the US100, which appears overextended after pushing into a key weekly high. A significant retracement could be on the horizon this week. I’ll walk you through my trading strategy, covering breakout trades and trend continuation setups. 🚨 *Not financial advice.

Nasdaq-100 H4 | Bullish uptrend to extend further?Nasdaq-100 (NAS100) is falling towards a pullback support and could potentially bounce off this level to climb higher.
Buy entry is at 22,105.08 which is a pullback support.
Stop loss is at 21,948.00 which is a level that lies underneath an overlap support.
Take profit is at 22,378.60 which is a level that aligns with the 100.0% Fibonacci projection.
High Risk Investment Warning
Trading Forex/CFDs on margin carries a high level of risk and may not be suitable for all investors. Leverage can work against you.
Stratos Markets Limited (www.fxcm.com):
CFDs are complex instruments and come with a high risk of losing money rapidly due to leverage. 63% of retail investor accounts lose money when trading CFDs with this provider. You should consider whether you understand how CFDs work and whether you can afford to take the high risk of losing your money.
Stratos Europe Ltd (www.fxcm.com):
CFDs are complex instruments and come with a high risk of losing money rapidly due to leverage. 63% of retail investor accounts lose money when trading CFDs with this provider. You should consider whether you understand how CFDs work and whether you can afford to take the high risk of losing your money.
Stratos Trading Pty. Limited (www.fxcm.com):
Trading FX/CFDs carries significant risks. FXCM AU (AFSL 309763), please read the Financial Services Guide, Product Disclosure Statement, Target Market Determination and Terms of Business at www.fxcm.com
Stratos Global LLC (www.fxcm.com):
Losses can exceed deposits.
Please be advised that the information presented on TradingView is provided to FXCM (‘Company’, ‘we’) by a third-party provider (‘TFA Global Pte Ltd’). Please be reminded that you are solely responsible for the trading decisions on your account. There is a very high degree of risk involved in trading. Any information and/or content is intended entirely for research, educational and informational purposes only and does not constitute investment or consultation advice or investment strategy. The information is not tailored to the investment needs of any specific person and therefore does not involve a consideration of any of the investment objectives, financial situation or needs of any viewer that may receive it. Kindly also note that past performance is not a reliable indicator of future results. Actual results may differ materially from those anticipated in forward-looking or past performance statements. We assume no liability as to the accuracy or completeness of any of the information and/or content provided herein and the Company cannot be held responsible for any omission, mistake nor for any loss or damage including without limitation to any loss of profit which may arise from reliance on any information supplied by TFA Global Pte Ltd.
The speaker(s) is neither an employee, agent nor representative of FXCM and is therefore acting independently. The opinions given are their own, constitute general market commentary, and do not constitute the opinion or advice of FXCM or any form of personal or investment advice. FXCM neither endorses nor guarantees offerings of third-party speakers, nor is FXCM responsible for the content, veracity or opinions of third-party speakers, presenters or participants.

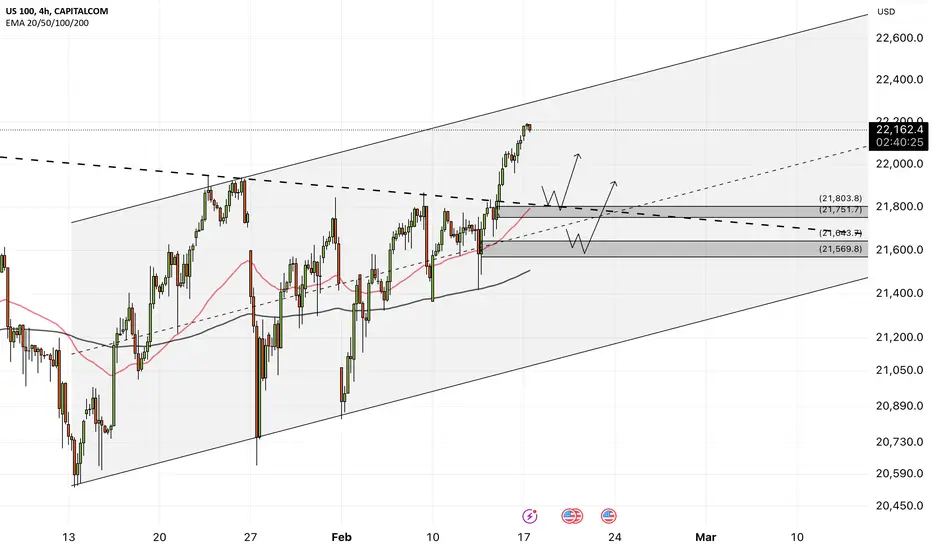
NAS100 - Nasdaq is setting a new ATH!The index is trading above the EMA200 and EMA50 on the 4-hour timeframe and is trading in its ascending channel. If the index corrects towards the marked trend line, which is also intersecting the demand zone, we can look for further buying opportunities in Nasdaq.
At the start of the week, the U.S. dollar strengthened significantly after President Donald Trump announced a 25% tariff on steel and aluminum imports. He also stated that any country imposing tariffs on American products would face reciprocal tariffs from the U.S. Later, Federal Reserve Chairman Jerome Powell, in his congressional testimony, emphasized that the central bank is in no hurry to implement further rate cuts. Additionally, data from the U.S. Consumer Price Index (CPI) for January came in higher than expected, further supporting the dollar.
Although the dollar experienced a slight correction on Thursday and Friday, these factors, combined with a strong non-farm payroll report for January, led investors to anticipate a rate cut of only 30 basis points for the year. This outlook is more hawkish than the Federal Reserve’s own forecast of a 50-basis-point reduction. In other words, traders in financial markets have fully priced in just a single 0.25% rate cut by December.
Kevin Hassett, Chairman of the White House Council of Economic Advisers, revealed in an interview with CBS’s Face The Nation that he meets regularly with Federal Reserve Chairman Jerome Powell. He stressed that these meetings are not intended to influence interest rate policy and that Powell’s independence is respected, although the President’s views are still conveyed.
Hassett also pointed out that long-term yields have declined, with a 40-basis-point drop in the 10-year Treasury yield, indicating market expectations of lower inflation.
Retail sales data showed a 0.9% decline following an upwardly revised 0.7% increase in December. Out of 13 reported categories, nine recorded declines, with the largest drops observed in automobiles, sporting goods, and furniture stores.
Following a tense week filled with impactful economic news, the upcoming week is expected to be quieter and shorter, as U.S. markets will be closed on Monday in observance of Presidents’ Day.
Key economic events for the week include the release of the Empire State Manufacturing Index on Tuesday, the minutes from the latest Federal Reserve policy meeting, and U.S. housing starts and building permits data on Wednesday. On Thursday, weekly jobless claims and the Philadelphia Fed Manufacturing Index will be released. Finally, Friday will see the publication of preliminary S&P Flash PMI reports and existing home sales data.
AppLovin (APP) AnalysisCompany Overview:
AppLovin NASDAQ:APP is a mobile marketing leader, providing developers with tools for user acquisition, ad optimization, and analytics. The company also benefits from its owned apps, such as Monopoly GO!, which contribute 30% of its revenue.
Key Catalysts:
AI-Driven Revenue Expansion 🤖
AI plays a pivotal role in AppLovin’s success, driving 80% of its revenue growth. This AI advantage helps optimize user engagement and ad targeting, boosting overall platform efficiency.
Mobile Gaming Growth 🎮
The mobile gaming industry is projected to grow at an 8% annual rate through 2027, positioning AppLovin to benefit as a key player in game monetization and marketing solutions.
E-Commerce Ad Expansion 🛒
AppLovin’s new e-commerce ad pilot could generate FWB:30M -$50M in Q4 2024, with a self-service platform launch in mid-2025 targeting the $200B+ global e-commerce ad market.
Analyst Confidence 📊
Oppenheimer has reiterated its Outperform rating, with a $480 price target, citing AppLovin’s earnings potential, robust ad revenue streams, and growing monetization avenues.
Investment Outlook:
Bullish Case: We are bullish on APP above the $380.00-$400.00 range, supported by AI adoption, ad growth, and entry into e-commerce advertising.
Upside Potential: Our price target is $650.00-$670.00, reflecting AppLovin’s potential to expand its revenue base across multiple high-growth sectors.
📢 AppLovin—Driving Innovation in Mobile Advertising and Game Monetization. #AppMarketing #AI #MobileGaming
