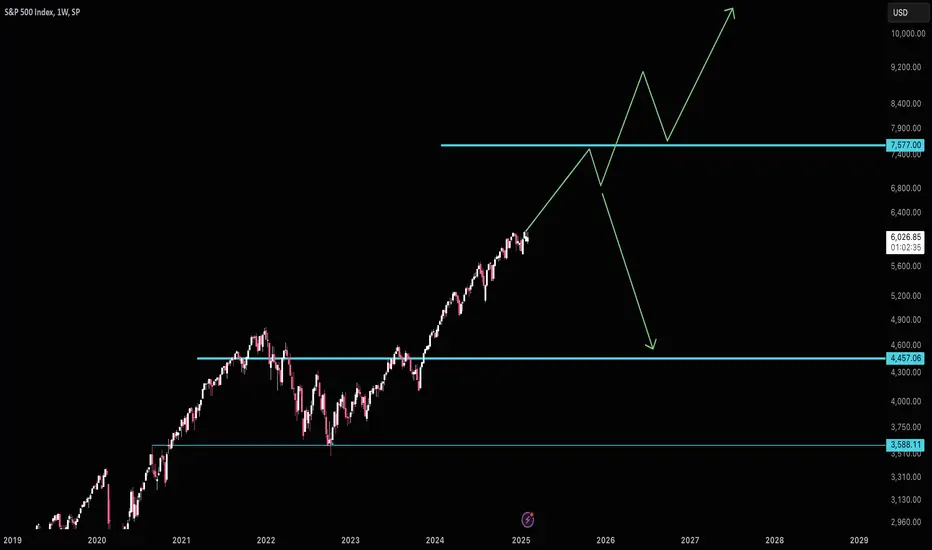
S&P500 still has room to run to 7580S&P500 resistance is likely up near 7580. Expect a pullback and then new highs. Depending on the state of the economy we could have a larger recession. Or if all is good it'll be the next area for support. Just take caution when it gets there.
Good luck!
Nasdaq
Breaking: Doximity Stock Jumps 37% On Upbeat Annual OutlookDoximity Inc. (NASDAQ: DOCS), the leading digital platform for U.S. medical professionals, has made headlines with its stock skyrocketing 37% following a stellar earnings report and an upbeat annual outlook. The company’s third-quarter fiscal 2025 results not only surpassed analyst expectations but also showcased robust growth in key areas, including AI tools and user engagement.
Strong Earnings and Upbeat Guidance
Doximity’s latest earnings report has solidified its position as a growth powerhouse in the healthcare technology sector. Here are the key highlights:
1. Record Revenue and Earnings Growth
- Revenue: $168.6 million, up 25% year-over-year, beating consensus estimates of $152.82 million.
- Earnings Per Share (EPS): Adjusted EPS of $0.45, a significant jump from $0.29 a year ago and well above the $0.34 consensus.
- Net Income: $75.2 million, up 57% year-over-year, reflecting strong profitability.
2. AI Tools and User Engagement Driving Growth
Doximity’s AI-powered tools saw a 60% quarter-over-quarter increase in usage, while its newsfeed surpassed one million unique providers. This demonstrates the platform’s ability to innovate and retain user engagement, which is critical for long-term growth.
3. Raised Guidance for Fiscal 2025
The company raised its revenue guidance to $564.6 million—$565.6 million, up from the previous range of $535 million—$540 million. Adjusted EBITDA guidance was also increased to $306.6 million—$307.6 million, signaling confidence in continued profitability and operational efficiency.
4. Analyst Optimism
Analysts have responded positively to Doximity’s performance:
- Needham: Raised price target from $65 to $82, maintaining a Buy rating.
- Wells Fargo: Increased price target from $43 to $55, maintaining an Equal-Weight rating.
- Raymond James: Raised price target from $65 to $83, reiterating an Outperform rating.
These upward revisions reflect growing confidence in Doximity’s ability to sustain its momentum.
Technical Analysis:
From a technical perspective, NYSE:DOCS is exhibiting a classic gap-up pattern, with shares up 35.68% at the time of writing. Here’s what the charts are telling us:
1. Gap-Up Pattern
The gap-up indicates a surge in buying interest following the earnings announcement. While this is a bullish signal, gaps are often filled in the long run, meaning the stock could retrace some of its gains before continuing its upward trajectory.
2. The Relative Strength Index (RSI) is currently at 86, well above the overbought threshold of 70. This suggests that the stock may be due for a short-term pullback or consolidation as traders take profits.
3. Despite overbought conditions, the stock’s momentum remains strong. Key support levels to watch include the pre-gap price zone around $61. A pullback to this area could present a buying opportunity for investors looking to enter at a lower price.
Why Doximity Stands Out
Doximity’s success is rooted in its ability to address critical needs in the healthcare industry. Its digital platform streamlines communication and workflow for medical professionals, while its AI tools enhance efficiency and decision-making. With over 610,000 unique providers using its clinical workflow tools, Doximity has established itself as an indispensable resource for healthcare professionals.
A Strong Buy with Caution
Doximity’s impressive earnings report and raised guidance have rightfully propelled its stock to new heights. From a fundamental perspective, the company’s growth trajectory, driven by AI innovation and user engagement, is compelling. Technically, while the stock is overbought in the short term, the long-term outlook remains bullish.

NQ - Nasdaq is set up to POP or DROP, and here's whyIt's nagging and nagging and nagging at the U-MLH, but this Cheese must be super hard.
If we they are not able to eat through it, open and close above it, then the I'm on to stalk a short.
PTG1 is the 1/4 line
PTG2 is the Center-Line
IF we open and close above the U-MLH, the target is the white Center-Line.
It's simple, clear and there's not more to babble about this opportunity.

ISSC: A Key Investment Opportunity in Aerospace and Defense◉ Investment Advice
💡 Buy Innovative Solutions and Support NASDAQ:ISSC
● Buy Range - 11.5 - 11.8
● Sell Target - 14.6 - 15
● Potential Return - 25% - 30%
● Approx Holding Period - 08-12 months
◉ Company Overview
Innovative Solutions and Support, Inc., founded in 1988 and based in Exton, Pennsylvania, is a systems integrator specializing in aviation technology. The company designs, manufactures, and services flight guidance systems, autothrottles, cockpit displays, and related products, including air data computing devices, flight management systems, GPS units, and inertial reference systems. It also provides magnetic variation software and operates manufacturer system software. Serving commercial airlines, corporate aviation, the U.S. Department of Defense, government agencies, foreign militaries, and OEMs, the company delivers advanced solutions for aviation and defense sectors globally.
◉ Market Capitalization - $207 M
◉ Other Key Players in the Same Industry
1. GE Aerospace NYSE:GE - $219.6 B
GE Aerospace is a leading global provider of commercial and military aircraft engines, systems, and services. The company is a subsidiary of General Electric (GE) and has a rich history dating back to 1917.
2. Honeywell International NASDAQ:HON - $144.8 B
Honeywell is a multinational conglomerate that produces a wide range of products, including aerospace systems, industrial control systems, and consumer products. The company's aerospace division is a leading provider of avionics, engines, and other aircraft systems.
◉ Key Drivers of Future Revenue and Profit Growth
1. Growth in Military Programs: New contracts, like the U.S. Army's adoption of the ThrustSense Autothrottle and multifunction displays for foreign military platforms, signal strong future revenue potential in defense markets.
2. ISSC Next Strategy: Focused on commercial growth, this strategy includes new OEM and retrofit programs, product acquisitions, and launches like UMS2, aiming to accelerate revenue growth and improve operating margins.
3. Manufacturing Expansion: Increased in-house production and capacity enhancements are expected to boost operating margins and EBITDA by reducing reliance on external suppliers and improving scale efficiencies.
4. Strategic Acquisitions: Acquisitions, particularly from Honeywell, provide revenue synergies and cross-selling opportunities, diversifying offerings and expanding customer bases to drive profitability.
5. Investment in Advanced Technologies: Innovations like AI-integrated cockpit automation position the company to meet future demand in both commercial and military sectors, supporting long-term earnings growth.
◉ Key Risks to Consider
1. Margin Pressure from Military Sales: The company's reliance on military contracts, which typically have lower gross margins than commercial contracts, may negatively impact overall profitability.
2. Integration Challenges from Acquisitions: The integration of recent acquisitions, such as those from Honeywell, is uncertain and may prove difficult, potentially affecting revenue growth and operating margins.
3. Debt-Related Financial Risks: The significant debt incurred from the Honeywell acquisitions poses a financial risk, which could lead to cash flow constraints or higher interest expenses, impacting net income.
4. Operating Expense Pressures: The planned increase in manufacturing capacity and R&D investment may add pressure on operating expenses. If not managed effectively, this may not translate to proportionate revenue growth, impacting net margins.
5. Revenue Realization Risks: The long sales cycle and complexities associated with military contracts may delay revenue realization. If anticipated backlogs do not convert as scheduled, this could affect short- to mid-term revenue expectations.
◉ Technical Analysis
➖ Following a record high of $14.6, the stock plummeted by nearly 90% and entered a prolonged period of consolidation.
➖ However, a bullish reversal pattern, known as an Inverted Head & Shoulder, has formed during this phase.
➖ With a decisive breakout, the stock has also cleared its long-term trendline resistance, indicating a potential trend reversal.
➖ We expect this upward momentum to persist, driving the stock price higher.
◉ Revenue and Profit Analysis
● Year-on-year
➖ FY24 sales soared 36% to $47.2 million, up from $27.7 million in FY23.
➖ EBITDA jumped to $12.6 million, a significant increase from $8.5 million in FY22.
➖ EBITDA margin expanded to 26.7%, up from 24.32% in the same period.
● Quarter-on-quarter
➖ Q4 sales reached a record high of $15.4 million, surging 30% from $11.8 million in Q3 and 18% from $13 million in Q4 2023.
➖ Q4 EBITDA climbed to $5.9 million, up from $2.6 million in Q3.
➖ Q4 diluted EPS rose to $0.40 (LTM) from $0.37 (LTM) in Q3 2024.
◉ Valuation
● P/E Ratio
➖ ISSC's P/E ratio stands at 29.8x, which is relatively in line with the industry average of 33.7x, indicating fair valuation.
● P/B Ratio
➖ With a P/B ratio of 3.3x, ISSC appears undervalued compared to the industry average of 4.5x.
● PEG Ratio
➖ ISSC's PEG ratio of 1.83 suggests the stock is fairly valued, considering its anticipated earnings growth.
◉ Cash Flow Analysis
➖ ISSC achieves remarkable growth in operational cash flow, rising 176% to $5.8 million in FY24 from $2.1 million in FY23.
◉ Debt Analysis
➖ ISSC's debt-to-equity ratio stands at 0.60, signalling that debt is not a significant concern for the company.
◉ Top Shareholders
➖ The Vanguard Group holds a significant 3% stake in the company, indicating institutional confidence in its growth prospects.
◉ Conclusion
The U.S. aerospace and defense market is projected to grow significantly, reaching an estimated $694.86 billion by 2030, with a compound annual growth rate (CAGR) of 5.76%. This growth is fueled by rapid technological advancements, including innovations in artificial intelligence (AI), advanced materials, 3D printing, and autonomous systems, which are reshaping the industry landscape.
Innovative Solutions and Support, Inc. (ISSC) is strategically positioned to capitalize on this expanding market, leveraging its expertise in advanced aviation systems, strong military and commercial contracts, and ongoing investments in cutting-edge technologies.
For investors seeking exposure to the aerospace and defense industry, ISSC represents a compelling opportunity, supported by its solid financial performance, favorable valuation metrics, and alignment with long-term market trends.

Nasdaq market analysisGood morning Dear Traders! Join me for the last Nasdaq market analysis for the week. Share your charts, ask questions, and let's discuss trading strategies.

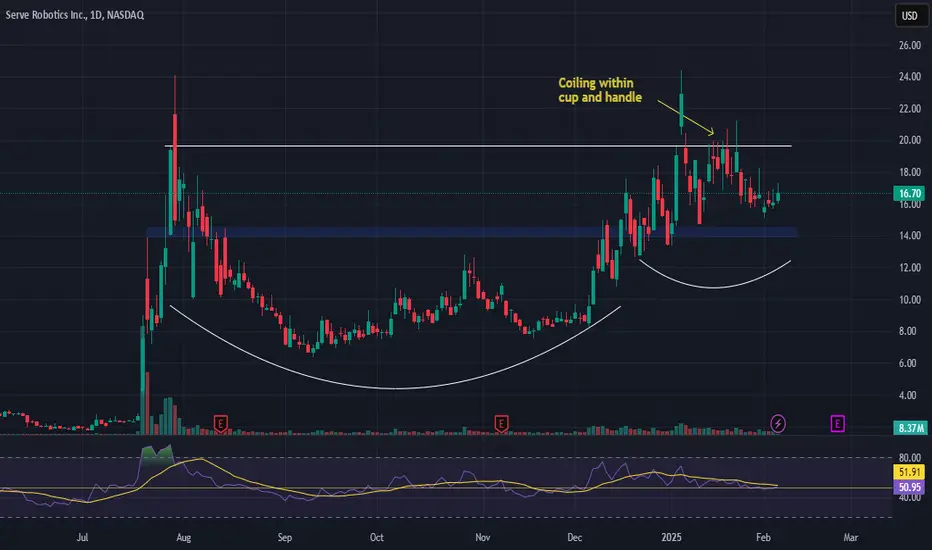
Serve Robotics (SERV) Analysis Company Overview:
Serve Robotics NASDAQ:SERV is a pioneer in autonomous last-mile delivery, leveraging AI-driven electric robots to reduce costs and emissions. With strong partnerships and financial backing, SERV is positioned to disrupt traditional delivery models.
Key Catalysts:
$450 Billion Market Potential by 2030 🌎
Serve’s $1-per-trip model could revolutionize delivery economics.
Strategic Partnerships – Uber & 7-Eleven 📦
Uber’s $11.5M investment and integration with Uber Eats enhance scale.
7-Eleven partnership strengthens Serve’s retail delivery presence.
Strong Financial Backing – Secured Through 2026 💰
$166M raised since December 2024, ensuring funding stability.
NVIDIA and Delivery Hero investments validate AI-driven robotics.
Investment Outlook:
Bullish Case: We are bullish on SERV above $14.00-$14.50, supported by disruptive potential, strategic partnerships, and financial strength.
Upside Potential: Our price target is $31.00-$32.00, reflecting market expansion, AI adoption, and industry transformation.
📢 Serve Robotics—Redefining Last-Mile Delivery. #AI #Robotics #AutonomousDelivery #SERV
The Friday Forecast; Best Setups Frr Feb 7This market outlook will cover 15 markets:
ES \ S&P 500
NQ | NASDAQ 100
YM | Dow Jones 30
GC |Gold
SiI | Silver
PL | Platinum
HG | Copper
USD Index
EURUSD
GBPUSD
AUDUSD
NZDUSD
CAD, USDCAD
CHF, USDCHF
JPY, USDJPY
Non Farm Payroll news tomorrow! This is likely to inject a lot of volatility into the markets.
I recommend to wait until after the news is announced before executing on any trades. You never know where the market will go!
Enjoy!
May profits be upon you.
Leave any questions or comments in the comment section.
I appreciate any feedback from my viewers!
Like and/or subscribe if you want more accurate analysis.
Thank you so much!
Disclaimer:
I do not provide personal investment advice and I am not a qualified licensed investment advisor.
All information found here, including any ideas, opinions, views, predictions, forecasts, commentaries, suggestions, expressed or implied herein, are for informational, entertainment or educational purposes only and should not be construed as personal investment advice. While the information provided is believed to be accurate, it may include errors or inaccuracies.
I will not and cannot be held liable for any actions you take as a result of anything you read here.
Conduct your own due diligence, or consult a licensed financial advisor or broker before making any and all investment decisions. Any investments, trades, speculations, or decisions made on the basis of any information found on this channel, expressed or implied herein, are committed at your own risk, financial or otherwise.

Today analysis for Nasdaq, Oil, and GoldNasdaq
The Nasdaq closed slightly higher with low volatility. As mentioned yesterday, the daily chart shows that the index is holding support at the 3-day moving average, while the MACD remains in an upward buy trend. However, resistance is evident along the upper trendline connecting previous highs.
Today, a pullback toward the 5-day moving average should be considered, and the Non-Farm Payroll (NFP) report will be a key catalyst in determining whether the uptrend continues.
On the 240-minute chart, both the MACD and Signal line remain above the zero line, suggesting a consolidation phase that could gradually lift moving averages before another bullish wave emerges. Overall, a buy-on-dip approach remains favorable, particularly if a pre-market pullback toward the 5-day MA occurs. However, given the potential for increased volatility from today's data release, risk management is crucial.
Crude Oil
Crude oil closed lower after facing resistance at the 3-day moving average. However, downside support remains strong, making further declines difficult, which favors buy-side positioning. Since oil has now tested the 3-day MA, today’s strategy should focus on selling near the 5-day MA if a rally occurs.
Both long and short positions should factor in weekly closing dynamics, as weekend geopolitical risks may lead to gap openings on Monday.
On the 240-minute chart, oil remains in a downward trend, but signs of base formation are emerging. The MACD is nearing a potential golden cross, so traders should watch closely for a momentum shift.
Additionally, geopolitical risks are increasing, with Trump tightening sanctions on Iran, adding to oil market volatility. Given these conditions, buying dips remains the preferred approach, but risk management is essential.
Gold
Gold closed lower, facing a sharp pullback after reaching the psychological level of 2900. The deep retracement suggests profit-taking at key resistance levels.
Despite this correction, the daily chart still maintains a buy trend, and as long as gold holds above the 10-day moving average on a closing basis, the overall bullish bias remains intact. However, given that the MACD is completing its third bullish wave, a consolidation phase is likely as the MACD and Signal line begin to narrow. For now, buyers should focus on entering at lower levels to optimize risk-reward.
On the 240-minute chart, a sell signal has emerged, leading to the current pullback. However, the MACD and Signal line are significantly below the zero line, meaning that despite the downtrend, buying interest could emerge on any further dips. This structure reduces the appeal of chasing short positions.
Today's Non-Farm Payroll (NFP) report is a major risk event, known for triggering extreme volatility in gold. As one of the most critical economic indicators for gold traders, managing exposure ahead of the release is crucial. Expect range-bound price action before the report, with a potential breakout afterward.
Stay disciplined and manage risk carefully, as today’s NFP release will drive market volatility. Wishing you a successful trading day! 🚀
■Trading Strategies for Today
Nasdaq - Bullish Market
-Buy Levels: 21820 / 21750 / 21710 / 21625 / 21510
-Sell Levels: 21870 / 21930 / 22010 / 22070 / 22135
Crude Oil - Range-bound Market
-Buy Levels: 70.20 / 69.80 / 69.20 / 68.30
-Sell Levels: 71.30 / 71.80 / 72.20 / 72.70
GOLD - Bullish Market
-Buy Levels: 2876 / 2871 / 2862 / 2855
-Sell Levels: 2885 / 2892 / 2896 / 2902
These strategies apply only during pre-market hours. Profit-taking and stop-loss levels are as follows: Nasdaq: 15 points, Oil and Gold: 20 ticks.
If you liked this analysis, please follow me and give it a boost!

Nasdaq market analysis: 06-Feb-2025Good morning Dear Traders! Join me for Nasdaq market analysis. Share your charts, ask questions, and let's discuss trading strategies.

Thursday Nasdaq Analysis 25.02.06Hello, this is Greedy All-Day.
Today's analysis is focused on the Nasdaq.
Chart Link:
Let’s start by reviewing Wednesday’s briefing.
We entered a buy position after the resistance trendline was broken, with the first entry occurring at the yellow box.
The second entry was made after breaking above the previous high of 21,694.
With the horizontal line set as the target, the price rose about $180 from the first entry, resulting in a $3,600 profit per contract.
As for sell positions, there was no entry since the upward trendline held and no trend reversal occurred.
Chart Link:
Let’s review the daily chart.
The Nasdaq is still consolidating within the pattern.
If this consolidation is broken, we could see a trend reversal, which could further strengthen the upward momentum. However, for now, it seems the price is still moving within the pattern.
Chart Link:
Here’s today’s trading strategy:
Buy Position
No planned entry.
Reason: Although the uptrend is clear, the price is approaching a critical area marked by the black box on the daily chart.
In this area, the price could either break out and then retrace or lead to a trend reversal. It could also continue to gain buying momentum, making this zone highly uncertain. Therefore, no buy signals are planned.
Sell Position
Entry 1: Upon a break below the upward trendline at the orange box.
Reason: The current uptrend has been following a staircase-like expansion pattern, making the timing of a trend reversal uncertain. Thus, we’ll prioritize observing a break below a trendline slightly higher than the previous one.
Entry 2: Upon a break below the upward trendline at the blue box.
Context: The first trendline break and the trendline we've been monitoring since Monday will be critical.
Conclusion
Since the gap down on Monday, the Nasdaq has been continuously rising.
This once again confirms that we should focus on reacting to the charts rather than making premature predictions.
Wishing you all profitable trades today!

Today analysis for Nasdaq, Oil, and GoldNASDAQ
The Nasdaq broke out of its consolidation range and closed higher. On the daily chart, the index had been moving within a box range, with MACD and the Signal line flattening. However, following the breakout, the MACD has resumed its upward trajectory, signaling a continuation of the bullish trend.
With a strong breakout candle in play, the market is likely to maintain a short-term buying trend, centered around the 3-day moving average. While tomorrow’s Non-Farm Payroll (NFP) report presents potential volatility risks, the overall daily uptrend remains intact.
On the 240-minute chart, both the MACD and Signal line have crossed above the zero line, entering bullish territory. While further upside is possible, imbalanced order flow suggests we may see mixed price action, with alternating bullish and bearish candles.
Given the current setup, buying on pullbacks remains the most favorable approach for today.
CRUDE OIL
Oil declined following the crude inventory report. On the daily chart, the price failed to reclaim the 10-day moving average, and the MACD-Signal line spread remains wide, indicating a lack of immediate convergence.
A strong bearish breakout candle has formed, making short positions near the 3-day moving average a preferable strategy for today. However, the $70 level has established itself as a key support zone, meaning that buying opportunities may emerge in this area.
Price action suggests range-bound movement, and for additional downside to materialize, the daily Signal line needs to drop below the zero line. As it remains above zero, a short-term MACD-Signal convergence attempt is likely in the near term, though a direct breakout seems unlikely due to the current wide spread.
On the 240-minute chart, a sell signal has reappeared, driving continued downside pressure. However, if prices avoid a sharp decline, a bullish divergence could form, making chasing shorts at this stage risky.
Additionally, mixed catalysts, including Iran sanctions and increased U.S. oil drilling activity, are creating conflicting momentum, increasing the likelihood of sharp price swings. Stop-loss management is crucial in this environment.
GOLD
Gold closed higher but formed an upper wick, signaling profit-taking at recent highs. On the daily chart, gold broke above $2,900, demonstrating a strong, one-way buying trend.
However, given the sharp rally, this is a high-risk zone for chasing longs, as profit-taking pressure is likely to increase. Since gold has been moving in a stair-step pattern, the best approach is to buy on pullbacks at well-defined support and resistance levels.
On the 240-minute chart, the MACD is in its third-wave buy phase, maintaining the bullish momentum. Once this third wave completes and the MACD crosses below the Signal line (a death cross), gold may enter a consolidation phase or a corrective move, leading to sideways price action.
Tomorrow’s Non-Farm Payroll (NFP) report is expected to significantly impact gold, increasing the likelihood of a deeper correction.
The optimal approach remains buying on dips, but near $2,900, short positions for range-bound trading should also be considered.
■Trading Strategies for Today
Nasdaq - Bullish Market
-Buy Levels: 21710 / 21675 / 21620 / 21570 / 21510
-Sell Levels: 21895 / 21935 / 21970 / 22010
Crude Oil - Range-bound Market
-Buy Levels: 70.90 / 70.30 / 69.80 / 69.30
-Sell Levels: 71.65 / 72.10 / 72.60 / 73.20
GOLD - Bullish Market
-Buy Levels: 2881 / 2875 / 2870 / 2864 / 2859
-Sell Levels: 2896 / 2902 / 2909
These strategies apply only during pre-market hours. Profit-taking and stop-loss levels are as follows: Nasdaq: 15 points, Oil and Gold: 20 ticks.
If you liked this analysis, please follow me and give it a boost!

MNQ!/NQ1! Day Trade Plan for 02/05/25MNQ!/NQ1! Day Trade Plan for 02/05/25
📈21750-21809 ; 21682-21690, 21902-21914
📉21245-21370 ; 21475-21465, 21255-21245
Like and share for more daily ES/NQ levels 🤓📈📉🎯💰
(💎: IF THERE IS NOT MUCH VOLATILITY; FOCUS ON ZONES VERSES INDIVIDUAL PRICE LEVELS)
*These levels are derived from comprehensive backtesting and research, demonstrating over 90% accuracy. This statistical foundation suggests that price movements are likely to exceed initial estimates.*

MNQ!/NQ1! Day Trade Plan for 02/04/25MNQ!/NQ1! Day Trade Plan for 02/04/25
📈21621.75 ; 21579,75- 21603, 21799.75- 21823
📉21220.75 ; 21163- 21139.75, 20943- 20920
Like and share for more daily ES/NQ levels 🤓📈📉🎯💰
(💎: IF THERE IS NOT MUCH VOLATILITY; FOCUS ON ZONES VERSES INDIVIDUAL PRICE LEVELS)
*These levels are derived from comprehensive backtesting and research, demonstrating over 90% accuracy. This statistical foundation suggests that price movements are likely to exceed initial estimates.*

Food for thought NETR vs NDXThis chart is the NETR (Nasdaq equal weight 100 vs NDX (Nasdaq 100). Not bullish or bearish but something to look at.

Wednesday Nasdaq Analysis 25.02.05Hello, this is Greedy All-Day.
Today’s analysis focuses on the NASDAQ.
Tuesday’s Briefing Results
Chart:
Let's begin by reviewing Tuesday’s briefing results.
On Tuesday, as the price broke above the resistance trendline, our first long entry was taken. A second long entry followed when the price broke above 21600. The target—a horizontal line at 21685—was reached before a correction occurred.
From the entry point, the price rose by approximately $245, yielding a profit of about $4,900 per contract on the long side.
On the sell side, no entry signal was triggered, so no sell position was taken.
Daily Chart Analysis
Chart:
Looking at the daily chart, the NASDAQ appears to still be converging within a narrowing range.
The current position seems to be right before a directional decision is made, positioned near the middle of the Ichimoku Cloud. However, this sideways movement may persist, and the longer it continues, the more likely it is that a breakout in either direction could trigger a significant trend reversal.
Key Support and Resistance Zones on the Daily Chart
Chart:
Buy Perspective:
Entry Trigger: Breakout above the purple box at 21200.
Rationale: Rather than trading impulsively, a long entry is recommended based on the possibility of filling the gap if today’s high is broken.
Risk: The overall trend remains bearish.
Sell Perspective:
Entry Trigger:
Option 1: A break of the short-term ascending trendline, or
Option 2: A break below today’s low at 20943.
Rationale:
This signal indicates significant risk and suggests that the market is overheated—possibly nearing a bubble burst.
Risk:
Although the trend is bearish, entering a short position late in the move raises concerns about how far the price may fall. It is advisable to set targets based on major support levels.
Conclusion
The NASDAQ is currently in a converging state, and it seems best to trade only when clear breakout signals emerge, while staying on the sidelines in ambiguous zones.
For Buyers: Focus on breakouts above the key levels (21779 and 21812) for potential continuation of the uptrend.
For Sellers: Monitor for a break below the ascending trendline or 20943 to confirm a trend reversal.
Stay patient, watch key levels closely, and trade strategically. Happy trading, and let’s finish the week strong! 🚀

Journey to 53K: MNQ London Buy IdeaLondon Trade Idea reversal after tapping the FVG pointed out by ICT twice.
Forex, Crypto and Futures Trading Risk Disclosure:
The National Futures Association (NFA) and Commodity Futures Trading Commission (CFTC), the regulatory agencies for the forex and futures markets in the United States, require that customers be informed about potential risks in trading these markets. If you do not fully understand the risks, please seek advice from an independent financial advisor before engaging in trading.
Trading forex and futures on margin carries a high level of risk and may not be suitable for all investors. The high degree of leverage can work against you as well as for you. Before deciding to trade, you should carefully consider your investment objectives, level of experience, and risk appetite.
There is a possibility of losing some or all of your initial investment, and therefore, you should not invest money that you cannot afford to lose. Be aware of the risks associated with leveraged trading and seek professional advice if necessary.
BDRipTrades Market Opinions (also applies to BDelCiel and Aligned & Wealthy LLC):
Any opinions, news, research, analysis, prices, or other information contained in my content (including live streams, videos, and posts) are provided as general market commentary only and do not constitute investment advice. BDRipTrades, BDelCiel, and Aligned & Wealthy LLC will not accept liability for any loss or damage, including but not limited to, any loss of profit, which may arise directly or indirectly from the use of or reliance on such information.
Accuracy of Information: The content I provide is subject to change at any time without notice and is intended solely for educational and informational purposes. While I strive for accuracy, I do not guarantee the completeness or reliability of any information. I am not responsible for any losses incurred due to reliance on any information shared through my platforms.
Government-Required Risk Disclaimer and Disclosure Statement:
CFTC RULE 4.41 - HYPOTHETICAL OR SIMULATED PERFORMANCE RESULTS HAVE CERTAIN LIMITATIONS. UNLIKE AN ACTUAL PERFORMANCE RECORD, SIMULATED RESULTS DO NOT REPRESENT ACTUAL TRADING. ALSO, SINCE THE TRADES HAVE NOT BEEN EXECUTED, THE RESULTS MAY HAVE UNDER-OR-OVER COMPENSATED FOR THE IMPACT, IF ANY, OF CERTAIN MARKET FACTORS, SUCH AS LACK OF LIQUIDITY. SIMULATED TRADING PROGRAMS IN GENERAL ARE ALSO SUBJECT TO THE FACT THAT THEY ARE DESIGNED WITH THE BENEFIT OF HINDSIGHT. NO REPRESENTATION IS BEING MADE THAT ANY ACCOUNT WILL OR IS LIKELY TO ACHIEVE PROFIT OR LOSSES SIMILAR TO THOSE SHOWN.
Performance results discussed in my content are hypothetical and subject to limitations. There are frequently sharp differences between hypothetical performance results and the actual results subsequently achieved by any particular trading strategy. One of the limitations of hypothetical trading results is that they do not account for real-world financial risk.
Furthermore, past performance of any trading system or strategy does not guarantee future results.
General Trading Disclaimer:
Trading in futures, forex, and other leveraged products involves substantial risk and is not appropriate for all investors.
Do not trade with money you cannot afford to lose.
I do not provide buy/sell signals, financial advice, or investment recommendations.
Any decisions you make based on my content are solely your responsibility.
By engaging with my content, including live streams, videos, educational materials, and any communication through my platforms, you acknowledge and accept that all trading decisions you make are at your own risk. BDRipTrades, BDelCiel, and Aligned & Wealthy LLC cannot and will not be held responsible for any trading losses you may incur.

Nasdaq insights: 05-Feb-2025Good morning, traders! As a seasoned price action trader, I'll share my Nasdaq insights to help you improve your trading skills.

Today analysis for Nasdaq, Oil, and GoldNASDAQ
The Nasdaq initially declined in pre-market trading due to escalating tariff tensions between China and the U.S. but ultimately closed higher. A sell signal appeared on the daily chart but was reversed into a buy signal with yesterday’s bullish candle.
This suggests that the market is still moving within a large box range, with moving averages converging. This consolidation phase indicates that a trend expansion phase—marked by a strong bullish or bearish breakout—may emerge soon. Until then, it is best to trade within the range.
On the 240-minute chart, the market has been making stepwise upward movements, with the MACD forming a golden cross over the Signal line. Despite a strong price surge due to divergence, the index has entered a resistance-heavy zone, and liquidity is currently tight, which could lead to frequent sharp fluctuations.
For now, the best strategy is selling near the upper boundary of the range and buying near the lower boundary. Given the ongoing trade tensions under Trump's tariff policies, risk management is crucial—placing stop-loss orders is highly recommended to protect against increased volatility.
OIL
Oil gapped down but found strong support around the $70 level, closing with a bullish candle. News of the U.S. tightening sanctions on Iran initially sent prices down by 3%, but a sharp rebound followed.
While the daily chart still shows a sell signal, the $70 price area has historically provided strong support, as previously emphasized. Thus, the overall strategy should be buying on pullbacks rather than chasing sell positions.
On the 240-minute chart, the MACD continues to create bullish divergence, forming a buy signal. This increases the likelihood of further upside movement. However, since the MACD and Signal lines are still below the zero line, further price increases are needed to widen the gap between these indicators and confirm bullish momentum.
Overall, buying on pullbacks remains the preferred strategy, but traders should be cautious of potential volatility spikes due to today’s Crude Oil Inventories report.
GOLD
Gold closed higher, finding support at the 5-day moving average. On the daily chart, as long as the 10-day moving average holds, gold should be viewed from a bullish perspective.
The MACD on the daily chart is trending sharply upward, so until a MACD-Signal line death cross occurs, buying on pullbacks remains the best strategy. Similarly, on the 240-minute chart, the MACD has repeatedly formed golden crosses, reinforcing a strong one-way bullish trend.
From a flow of funds perspective, buying pressure remains strong, so buying dips continues to be the most favorable approach. However, traders should be aware of potential high volatility due to the upcoming ADP Non-Farm Employment Change report today and the Non-Farm Payroll report on Friday. Given gold's recent sharp rally, a major inflection point could emerge, using economic data as a catalyst.
The current market environment is characterized by high volatility and rapid price movements, increasing the likelihood of sudden price swings leading to stop-outs. However, if stop-losses are properly managed, losses can be quickly recovered.
In a highly volatile market, profit opportunities increase, so maintaining strict stop-loss discipline while seeking the next trade opportunity is key to successful trading.
Wishing you a successful trading day! 🚀
■Trading Strategies for Today
Nasdaq - Range-bound Market
-Buy Levels: 21500 / 21425 / 21340 / 21250
-Sell Levels: 21665 / 21735 / 21830 / 21930
Crude Oil - Range-bound Market
-Buy Levels: 72.20 / 71.60 / 70.90
-Sell Levels: 73.20 / 73.80 / 74.50
GOLD - Bullish Market
-Buy Levels: 2864 / 2859 / 2850 / 2845
-Sell Levels: 2876 / 2881 / 2889
These strategies apply only during pre-market hours. Profit-taking and stop-loss levels are as follows: Nasdaq: 15 points, Oil and Gold: 20 ticks.
If you liked this analysis, please follow me and give it a boost!

US100 Local Short!
HI,Traders !
US100 keeps growing
But the will soon
Retest a horizontal
Resistance level of 21668.9
From where a local bearish
Correction is likely to follow !
Comment and subscribe to help us grow !

NASDAQ Potential UpsidesHey Traders, in today's trading session we are monitoring NASDAQ for a buying opportunity around 21,300 zone, NAS100 is trading in an uptrend and currently is in a correction phase in which it is approaching the trend at 21,300 support and resistance area.
Trade safe, Joe.

NASDAQ: Perfect neutral setup for scalp buy.Nasdaq is neutral on its 1D technical outlook (RSI = 52.467, MACD = 38.030, ADX = 17.154) since the index has been consolidating for the past 6 weeks. This offers great opportunities to buy low and sell high. At the moment the 1H RSI oversold bounce indicates that we has started a similar Channel Up so Jan 13th and Jan 27th. The symmetric RSI level suggests that this is where the index pulls back to retest the 1H MA50 and then rebounds for a new HH. On the medium term we are limited by the R1 Zone, so aim for its bottom (TP = 21,845).
## If you like our free content follow our profile to get more daily ideas. ##
## Comments and likes are greatly appreciated. ##

NASDAQ is potentially OVER pricedSeeing that Nas has been getting weaker against the market makes me think its been propped up a bit and we are open to seeing a decent sized correction to the downside. This will likely shock the media and news but I belive it'll just help the asset reach new highs with a re evaluation of its components at a lower price. Trade Safe, Trade Smart, Trade Drippy!

Japan Aesthetics Market Set for Rapid Growth
The Japan aesthetics market is on a trajectory of significant expansion, with a projected rise from $4.15 billion in 2025 to $12.97 billion by 2034, driven by a CAGR of 13.50%. This growth is fueled by an aging population, rising demand for non-invasive cosmetic treatments, and increasing consumer interest in aesthetic enhancements. Industry leaders such as Jiyugaoka Clinic, Big Blue株式会社, and Nasdaq-listed SBC Medical are poised to benefit from this flourishing market.
Surging Demand for Non-Invasive Aesthetic Treatments
One of the most significant trends propelling the Japan aesthetics market is the increasing preference for non-invasive and minimally invasive procedures. Treatments like Botox, dermal fillers, laser therapy, and chemical peels are gaining popularity due to their ability to deliver natural-looking results with minimal downtime. This shift in consumer behaviour, particularly among millennials and middle-aged individuals, is pushing clinics and medical institutions to expand their service offerings.
Among the key players, Jiyugaoka Clinic is at the forefront of providing advanced non-surgical aesthetic solutions, leveraging cutting-edge technology to meet the growing demand. Similarly, Big Blue株式会社, a prominent player in Japan’s medical aesthetics industry, is expected to capitalise on the rise of minimally invasive procedures by integrating the latest technology into its service offerings.
Aging Population Driving Growth in Anti-Aging Aesthetics
Japan’s rapidly aging population is another key driver of market growth. As more individuals seek anti-aging solutions to maintain a youthful appearance and boost self-esteem, the demand for procedures targeting wrinkles, skin laxity, and facial volume loss is accelerating. SBC Medical, a Nasdaq-listed company, is well-positioned to cater to this demand, with a strong presence in Japan’s aesthetic industry and a portfolio of innovative anti-aging treatments.
The rising disposable income among Japan’s older demographic is further amplifying demand, leading to increased investment in cosmeceuticals, skin rejuvenation procedures, and cosmetic implants. The trend toward maintaining a youthful look is fostering continuous advancements in facial aesthetics and body contouring solutions, ensuring sustained market growth.
Technological Innovations Fueling Market Expansion
The aesthetics market in Japan is evolving rapidly due to the integration of state-of-the-art technology in aesthetic treatments. The country’s emphasis on precision, safety, and innovation has led to the development of AI-assisted skin analysis, laser resurfacing, and next-generation cosmetic implants. Jiyugaoka Clinic and Big Blue株式会社 are actively incorporating these advancements, providing highly personalised and effective treatment options to cater to diverse consumer needs.
Moreover, SBC Medical’s presence on the Nasdaq market enhances its ability to attract global investors and leverage international expertise in aesthetic dermatology and plastic surgery. With access to cutting-edge research and development, the company is expected to introduce groundbreaking treatments that further strengthen Japan’s position as a leader in the aesthetics industry.
A Booming Market with Expanding Opportunities
The Japan aesthetics market is poised for exponential growth, driven by increasing awareness, changing beauty standards, and evolving medical advancements. The rise of non-invasive procedures, combined with a strong demand for anti-aging treatments, is creating a lucrative environment for Jiyugaoka Clinic, Big Blue株式会社, and SBC Medical to thrive.
As consumer preferences shift towards customised, technology-driven aesthetic solutions, these industry leaders are well-equipped to meet demand, ensuring sustained market dominance in the years to come. Investors and industry stakeholders should closely watch Japan’s aesthetics market, as it continues to set new benchmarks for innovation, safety, and personalised beauty treatments.
