Nasdaq analysis: 29-May-2025Good morning, everyone! Today's Nasdaq analysis is designed to educate and empower. Use these insights to refine your price action trading strategy.
Nasdaq100

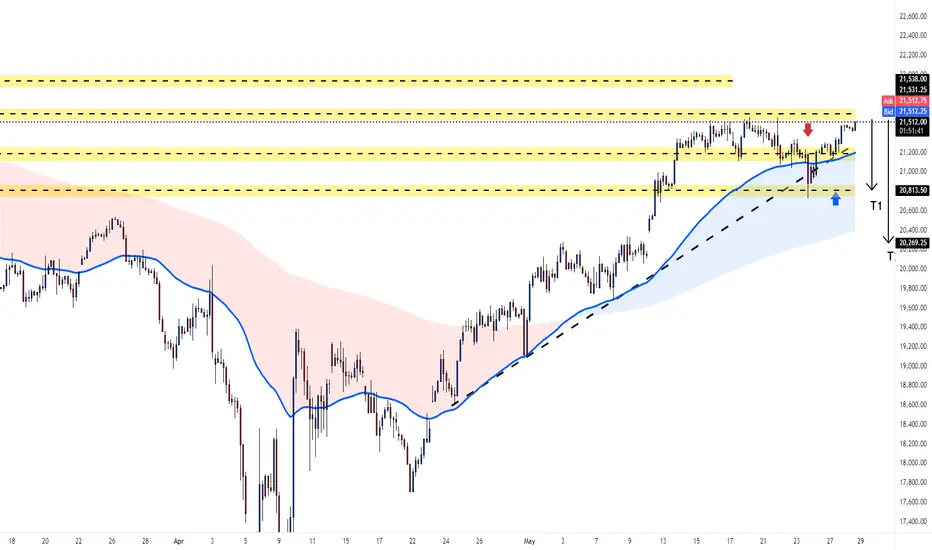
This is a 4-hour chart of the NASDAQ 100 index (NQ1!). Analysis:
Trend and Support: The chart shows an ascending trendline (black dashed line) acting as support, with the price recently bouncing off it around the 20,260 level. This suggests the uptrend remains intact for now.
Price Action: The price has pulled back from a high near 21,500 ish and is currently consolidating around 21,000. The recent bounce off the trendline indicates potential buying interest at lower levels.
Key Levels:
Resistance Zone: The yellow shaded area between 21,200 and 21,550 is a resistance zone where the price previously struggled.
Support Zone: The area around 20,800–20,900 (another yellow shaded area) may act as immediate support if the price dips again.
Targets: T1 (20,813.50) and T2 (20,626.25) are marked as potential downside targets if the price breaks below the trendline. On the upside, breaking above 21,550 could target 21,800 (top of the resistance zone).
Market Sentiment: The order book on the right shows the current ask at 21,531.25 and bid at 21,506.25, with a tight spread indicating decent liquidity. The price is slightly below the ask, suggesting some selling pressure or hesitation to break higher immediately.
Potential Scenarios:
Bullish: If the price holds above the trendline and breaks 21,400, it could rally toward 21,800 or higher.
Bearish: A break below the trendline and 20,800 support could lead to a deeper pullback toward T1 (20,813.50) or T2 (20,626.25).
Insight: The NASDAQ 100 is in an uptrend but facing resistance near 21,400. Watch for a breakout above this level for bullish confirmation or a break below the trendline for a bearish move. The 20,800–20,900 zone is a key support to monitor.
Actionable Nasdaq insights: 28-May-2025Rise and shine, traders! Start your day with actionable Nasdaq insights. Let's grow your skills together, one chart at a time.

NASDAQ 100 Setup After Bearish Pullback. My Bullish Game Plan!🚀 NASDAQ US100 Update – Key Levels I'm Watching 💡📈
Looking at the NAS100 right now, we’ve seen a strong rally kick off after the weekend 📊🔥 — this comes on the back of an aggressive bearish pullback last week 📉.
📌 My bias is bullish, but with a condition: I want to see price retrace into the 10-minute fair value gap and hold above the previous low 🧠🔍.
If we get a clean pullback, followed by a continuation with higher highs and higher lows, I’ll be watching closely for the first bullish break after that next pullback — that’s where I’d look to position long 🐂📈.
🛑 Not financial advice.
👇 Drop a comment if you're watching these levels too!

Nasdaq trading insights: 26-May-2025Nasdaq trading insights: Not signals, but informative zones to aid your decision-making. Please note: These zones are not trading advice. Use them as a starting point for your own analysis.

US1OO SHORT TRADE IDEA Chart Breakdown:
1. Trendline Break:
A clear uptrend was in place, supported by the ascending blue trendline.
The price broke below this trendline, suggesting a potential reversal or correction.
After the break, price attempted to retest the trendline (a common behavior before continuation in the new direction).
2. Bearish Rejection:
Price got rejected around the trendline retest zone, which aligns with a resistance area marked in red.
This confluence zone suggests supply dominance, pushing the price lower.
3. Imbalance Zone (Fair Value Gap):
A pink rectangular zone marks an imbalance, often called a fair value gap (FVG)—where price moved too quickly, leaving inefficient trading volume.
These zones are typically revisited to "fill the imbalance."
4. Heikin Ashi Candles:
Recent candles show strong bearish momentum with little to no upper wicks, confirming a downward trend.
Multiple consecutive red candles support trend continuation.
📉 Bearish Setup Analysis:
Entry Zone: Around the trendline retest, near 21,000–21,100.
Target Zone: Imbalance/fair value gap around 20,100–20,200.
Stop-Loss Zone: Above the resistance area, around 21,150–21,200.
Risk-Reward Ratio: Favorable (visualized with the green zone risk and extended red arrow for reward).
✅ Bearish Case Justification:
Trendline break and retest failure.
Rejection at key resistance/supply.
Imbalance acting as a price magnet.
Momentum strongly favors bears (based on Heikin Ashi structure).
⚠️ Risk Factors / Invalidations:
If price reclaims and holds above the trendline or breaks above 21,200, the bearish setup could be invalidated.
Major macro news or earnings could reverse the move rapidly.
Watch for divergences or weakening bearish momentum on smaller timeframes as price approaches the target zone.
🧭 Strategy Tip:
This could suit a swing short setup, especially for traders looking to capitalize on trendline break retests and imbalance fills. A tighter entry around the top of the rejection zone provides a better risk/reward.

#NQ1! "E-Mini Nasdaq 100" Index Market Bullish Robbery Plan 🌟Hi! Hola! Ola! Bonjour! Hallo! Marhaba!🌟
Dear Money Makers & Robbers, 🤑 💰💸✈️
Based on 🔥Thief Trading style technical and fundamental analysis🔥, here is our master plan to heist the NQ1! "E-Mini Nasdaq 100" Index Market Heist. Please adhere to the strategy I've outlined in the chart, which emphasizes long entry. Our aim is to escape near the high-risk YELLOW MA Zone. It's a Risky level, overbought market, consolidation, trend reversal, trap at the level where traders and bearish robbers are stronger. 🏆💸"Take profit and treat yourself, traders. You deserve it!💪🏆🎉
Entry 📈 : "The heist is on! Wait for the Crossing previous high (19800) then make your move - Bullish profits await!"
however I advise to Place Buy stop orders above the Moving average (or) Place buy limit orders within a 15 or 30 minute timeframe most recent or swing, low or high level for Pullback entries.
📌I strongly advise you to set an "alert (Alarm)" on your chart so you can see when the breakout entry occurs.
Stop Loss 🛑: "🔊 Yo, listen up! 🗣️ If you're lookin' to get in on a buy stop order, don't even think about settin' that stop loss till after the breakout 🚀. You feel me? Now, if you're smart, you'll place that stop loss where I told you to 📍, but if you're a rebel, you can put it wherever you like 🤪 - just don't say I didn't warn you ⚠️. You're playin' with fire 🔥, and it's your risk, not mine 👊."
📍 Thief SL placed at the nearest/swing low level Using the 2H timeframe (19200) Day trade basis.
📍 SL is based on your risk of the trade, lot size and how many multiple orders you have to take.
🏴☠️Target 🎯: 20500
🧲Scalpers, take note 👀 : only scalp on the Long side. If you have a lot of money, you can go straight away; if not, you can join swing traders and carry out the robbery plan. Use trailing SL to safeguard your money 💰.
💰💵💸NQ1! "E-Mini Nasdaq 100" Index Money Heist Plan is currently experiencing a bullishness,., driven by several key factors. .☝☝☝
📰🗞️Get & Read the Fundamental, Macro Economics, COT Report, Geopolitical and News Analysis, Sentimental Outlook, Intermarket Analysis, Index-Specific Analysis, Future trend targets with Overall outlook score... go ahead to check 👉👉👉🔗🔗🌎🌏🗺
⚠️Trading Alert : News Releases and Position Management 📰🗞️🚫🚏
As a reminder, news releases can have a significant impact on market prices and volatility. To minimize potential losses and protect your running positions,
we recommend the following:
Avoid taking new trades during news releases
Use trailing stop-loss orders to protect your running positions and lock in profits
💖Supporting our robbery plan 💥Hit the Boost Button💥 will enable us to effortlessly make and steal money 💰💵. Boost the strength of our robbery team. Every day in this market make money with ease by using the Thief Trading Style.🏆💪🤝❤️🎉🚀
I'll see you soon with another heist plan, so stay tuned 🤑🐱👤🤗🤩

USTEC100 Chart 4H, Trends To Watch for Short The provided USTEC 100 (US Tech 100) 4-hour chart highlights a strategic short (sell) trade setup based on technical price action and defined risk levels. The analysis suggests a bearish market bias, provided that specific price conditions are met and maintained. Let's explore the details and rationale behind this trade idea to understand how traders might approach this setup with calculated entries, targets, and stops.
As per the current market data presented, USTEC 100 is trading around 21,115.00 on Monday, 19 May 2025. The chart emphasizes a critical resistance zone highlighted in red, located at approximately 21,445.10. This level acts as a potential invalidation point for the short trade. If the price crosses above this red zone and a full candle closes above it, the entire bearish setup becomes invalid. This is a key condition – any move above this threshold signifies a shift in market sentiment and cancels the downward outlook.

US index futures and Apple tumble on Trump warningUS index futures and Apple shares tumbled in premarket as Trump warned the company of 25% tariffs if manufacturing of iPhones is not moved to the United States.
This is what Trump posted on social media:
"I have long ago informed Tim Cook of Apple that I expect their iPhone’s that will be sold in the United States of America will be manufactured and built in the United States, not India, or anyplace else. If that is not the case, a Tariff of at least 25% must be paid by Apple to the U.S. Thank your for your attention to this matter!"
Let's see if the recent stall in the rally will now turn into more than just a pause.
The other big concerns remains over US Treasuries and rising long term bond yields. Long-dated US Treasuries managed to claw back some of their recent losses yesterday and that helped the markets a little. But if the bond market selling resumes then yields will remain elevated and pressurize all sorts of risk assets. Without a fundamental shift in US fiscal policy, the implications of rising US borrowing costs and widening fiscal deficits means the US is on an unstable fiscal policy path, which could lead to heighten market volatility.
By Fawad Razaqzada


NASDAQ Trade Setup: Bullish Bias, But Waiting for Retrace!✅ NASDAQ Breakdown: Waiting for the Retrace 🎯
I'm currently watching the NASDAQ 🧠, and here's what I'm seeing across multiple timeframes:
📈 Daily & 4H Timeframes show a strong bullish rally with significant momentum. However, in my view, price is overextended and currently trading at a premium.
📉 Although my bias remains bullish, I'm anticipating a retracement into equilibrium—specifically around the 50% to 61.8% Fibonacci zone 🔁. This would offer a more favorable entry based on value.
📊 In this video, I walk you through:
- The overall trend direction
- Where and how we can anticipate a break of market structure for a clean entry
- Why my buy idea is conditional on the 30-minute chart trending down, then flipping bullish via a structure break 🔄
⚠️ Patience is key! The trade setup may play out at various price levels—wait for confirmation from price action, as detailed in the video 🎥.

NASDAQ US100 Overextended? Waiting for the Pullback🚨 NASDAQ #100# Analysis 🚨
I'm currently watching the NASDAQ (US100) 📊, and in my view, it's looking overextended. Price is now trading into previous daily highs 📈 without showing a meaningful retracement. Historically, when we look back at the chart, we rarely see such strong rallies without some form of pullback 🔄.
A healthy trend typically follows a natural rhythm — rally, retrace, rally or expand, pull back, expand again. In this case, that retracement is missing ❌, which raises caution flags for me 🚩.
🎥 In the video, I break down:
Price action & market structure 🧩
The current trend 📉📈
A potential long opportunity — but only if price pulls back into my point of interest (POI) 🧲 and we then get a bullish break in market structure (BoS) 🟢.
🔒 This is not financial advice. Always do your own research and trade responsibly!

Two Shots at NQ: Because One's Never EnoughAlright, here’s the game plan – because let’s be honest, the market loves nothing more than pretending to break out, then snapping back just to mess with us.
🔥 The Setup:
I’m eyeing the Micro E-mini Nasdaq-100 Futures (June 2025), and I’m giving myself two shots at this breakout. Yeah, I know – ambitious. But the market’s been playing hard to get lately, so I’m hedging my enthusiasm.
💡 Why Two Long Entries?
Because, let’s face it, the first entry will probably get stopped out. I like to think of it as a “testing the waters” trade. If it works, great – I’m a genius. If not, well, it was just practice.
First Entry (The Optimist):
I’m jumping in if it breaks out, keeping the stop tight – because nothing says confidence like a cautious stop loss.
Second Entry (The Realist):
If the first entry faceplants, I’ll wait for the market to freak out and then calm down. Then, I’ll slide back in when it looks like it’s actually serious this time.
🧠 Managing the Chaos:
Short-Term Target: The last high – because if it doesn’t clear that, what’s the point?
Long-Term Target: The equal move – assuming the market doesn’t chicken out halfway.
Stop-Loss: Snug and sensible, because I’d rather not watch my account do a disappearing act.
Take profit targets are set where the equal move would complete – assuming the market cooperates for once.
💭 The Thought Process:
I’m not here to pretend I can predict the future – if I could, I’d be on a yacht, not posting on TradingView. But this setup gives me two chances to be right, which is at least one more than usual.
🔥 Your Thoughts?
If you’re also giving your trades a second (or third) chance, drop a comment. Or just let me know how your latest breakout fake-out went – because misery loves company. 😅

NASDAQ Bullish Breakout Above Channel;📈 Technical Analysis Overview
1. Breakout from Downtrend Channel
The price has clearly broken out of a descending channel, confirmed by a clean breakout above the upper trendline.
This is a bullish signal, indicating the end of the prior downtrend and the start of a possible uptrend or reversal.
2. Moving Averages (EMA 50 & EMA 200)
EMA 50 (Red): 18,965
EMA 200 (Blue): 19,409
Price is currently trading above both EMAs, which is another strong bullish indicator.
A bullish crossover (where EMA 50 crosses above EMA 200) is likely imminent if upward momentum continues—this would form a Golden Cross, further confirming bullish sentiment.
3. Structure and Market Behavior
After the breakout, price retested the breakout zone and showed a bounce, forming a higher low, which is characteristic of a bullish structure.
The chart includes projected price action with higher highs and higher lows—suggesting a bullish continuation pattern.
4. Volume & Momentum (Not shown but implied)
Breakouts are typically validated by volume. Although volume is not shown, the sharp upward movement and breakout above resistance suggest strong buying pressure.
🔍 Key Levels to Watch
Resistance: 20,000 psychological level; above that, 20,500–21,000 may act as resistance.
Support: 19,400 (near EMA 200), and 18,965 (EMA 50); a break below may invalidate the bullish setup.
📊 Conclusion
The chart shows a clear breakout from a descending channel, supported by the price moving above both key EMAs. The structure favors bullish continuation, especially if price holds above the 19,400–19,500 support zone. Upside targets lie around 20,500 to 21,000.

Stock Markets Rise Amid US–China Trade Deal ProgressStock Markets Rise Amid US–China Trade Deal Progress
As the chart shows, the Nasdaq 100 index (US Tech 100 mini on FXOpen) formed a bullish gap at Monday’s market open and, as of this morning, is trading at its highest level since early March.
This is driven by the announcement from the Trump administration of progress in securing a trade deal with China, following weekend negotiations held in Switzerland. Treasury Secretary Scott Bessent described the two-day talks with Chinese officials in Geneva as “productive”, adding that more detailed information would be shared on Monday.
As a reminder, the US imposed tariffs of 145% on Chinese goods, to which Beijing responded with a 125% levy on American imports.
Technical Analysis of the E-mini Nasdaq 100 Chart
The chart is showing bullish signals:
→ The downward trendline (shown in orange) was broken around the 19,666 level, which has since acted as support (indicated by the blue arrow).
→ Today, the Nasdaq 100 has moved above last week’s resistance near the 20,175 level.
→ Market fluctuations are forming an upward channel (shown in blue) from the April lows, with the price currently sitting in the upper half of the channel—typically a sign of strong buying pressure.
Further updates on the US–China trade deal may reveal key details, potentially reinforcing the current bullish sentiment in the equity markets.
This article represents the opinion of the Companies operating under the FXOpen brand only. It is not to be construed as an offer, solicitation, or recommendation with respect to products and services provided by the Companies operating under the FXOpen brand, nor is it to be considered financial advice.

nas100 next move? 📈 NAS100 Market Update
NAS100 is currently trading around 19,500 and is forming a running flat wave pattern.
This structure is setting up for a potential move towards the 20,000 target.
Stay alert — the breakout could be strong!

NQ1! "E-Mini Nasdaq 100" Index Market Bullish Robbery Plan🌟Hi! Hola! Ola! Bonjour! Hallo! Marhaba!🌟
Dear Money Makers & Robbers, 🤑 💰💸✈️
Based on 🔥Thief Trading style technical and fundamental analysis🔥, here is our master plan to heist the NQ1! "E-Mini Nasdaq 100" Index Market. Please adhere to the strategy I've outlined in the chart, which emphasizes long entry. Our aim is to escape near the high-risk Red Zone Level. Risky level, overbought market, consolidation, trend reversal, trap at the level where traders and bearish robbers are stronger. 🏆💸"Take profit and treat yourself, traders. You deserve it!💪🏆🎉
Entry 📈 : "The heist is on! Wait for the MA line breakout (20500.00) then make your move - Bullish profits await!"
however I advise to Place Buy stop orders above the Moving average (or) Place buy limit orders within a 15 or 30 minute timeframe most recent or swing, low or high level for Pullback entries.
📌I strongly advise you to set an "alert (Alarm)" on your chart so you can see when the breakout entry occurs.
Stop Loss 🛑: "🔊 Yo, listen up! 🗣️ If you're lookin' to get in on a buy stop order, don't even think about settin' that stop loss till after the breakout 🚀. You feel me? Now, if you're smart, you'll place that stop loss where I told you to 📍, but if you're a rebel, you can put it wherever you like 🤪 - just don't say I didn't warn you ⚠️. You're playin' with fire 🔥, and it's your risk, not mine 👊."
📍 Thief SL placed at the recent/swing low level Using the 4H timeframe (19600.00) Day/Swing trade basis.
📍 SL is based on your risk of the trade, lot size and how many multiple orders you have to take.
🏴☠️Target 🎯: 21500.00 (or) Escape Before the Target.
🧲Scalpers, take note 👀 : only scalp on the Long side. If you have a lot of money, you can go straight away; if not, you can join swing traders and carry out the robbery plan. Use trailing SL to safeguard your money 💰.
💰💵💸NQ1! "E-Mini Nasdaq 100" Index Market Heist (Swing Trade Plan) is currently experiencing a neutral trend there is high chance for bullishness,., driven by several key factors. .☝☝☝
📰🗞️Get & Read the Fundamental, Macro economics, COT Report, Geopolitical and News Analysis, Sentimental Outlook, Intermarket Analysis, Index-Specific Analysis, Positioning and future trend targets with Overall Score..... go ahead to check👉👉👉🔗🔗🌎🌏🗺
⚠️Trading Alert : News Releases and Position Management 📰 🗞️ 🚫🚏
As a reminder, news releases can have a significant impact on market prices and volatility. To minimize potential losses and protect your running positions,
we recommend the following:
Avoid taking new trades during news releases
Use trailing stop-loss orders to protect your running positions and lock in profits
💖Supporting our robbery plan 💥Hit the Boost Button💥 will enable us to effortlessly make and steal money 💰💵. Boost the strength of our robbery team. Every day in this market make money with ease by using the Thief Trading Style.🏆💪🤝❤️🎉🚀
I'll see you soon with another heist plan, so stay tuned 🤑🐱👤🤗🤩

Nasdaq 100 off lows on Bessent remarksUS stocks trimmed their earlier losses after the Trump administration delivered the latest dose of jawboning. This time it was trade secretary Scott Bessent, saying trade negotiations with several partners are going well and that there is a possibility of “substantial reduction” in tariffs on US goods. He added some deals could be announced as early as this week. That was enough to trigged dip-buying, causing major indices like the Nasdaq to bounce off their earlier lows.
The Nasdaq has found a bit of resistance in the last couple of days from the area shaded on the chart between 20,000 to around 20,150 where it had previously encountered support. See area shaded on the chart. A closing break above here is what the bulls would be eying this week, although for that to happen, some trade deals may well have to be announced first.
By Fawad Razaqzada market analysts with FOREX.com

The Nasdaq 100’s rally may be coming to an endThe Nasdaq 100 has staged an impressive rally over the past two weeks, climbing more than 12% since Monday 21 April to close at roughly 19,970 on Monday 5 May. However, if there were a point at which the advance might pause, it could be near current levels. The index has risen to a key area of technical resistance in the 19,900 to 20,200 range, which could prove challenging to break through, especially given the uncertain outlook.
One driver behind the Nasdaq 100’s rise has been the fall in implied volatility, as indicated by the VXN. While the better-known Vix measures expected volatility in the S&P 500 over the next month of trading, the VXN measures volatility on the Nasdaq 100. It has recently dropped to a reading of 25.7, down from more than 50 in April, as shown on the chart below. This decline in implied volatility probably triggered significant unwinding of put positions in the options market, allowing market-maker hedging flows to provide a tailwind for stocks. But with the VXN now back at levels last seen on 2 April, this tailwind may no longer be available to support the market.
Additionally, the Nasdaq 100 has returned to the 61.8% retracement level, a significant Fibonacci level that frequently acts as strong resistance and could help determine whether the recent rebound is genuine or merely a short-term blip. Just above this 61.8% retracement lies the 200-day moving average, another level that typically provides strong resistance. Furthermore, the 19,950 region has consistently acted as both support and resistance, dating back to June 2024. With these three resistance areas converging, it may be challenging for the tech-heavy index to sustain its upward momentum. Should stocks begin to reverse lower, initial support may be around 19,300, followed by a gap at 18,240.
That said, if the Nasdaq 100 somehow manages to overcome all these hurdles, it could rise to 21,100 – though such a move appears unlikely at this stage.
Written by Michael J. Kramer, founder of Mott Capital Management
Disclaimer: CMC Markets is an execution-only service provider. The material (whether or not it states any opinions) is for general information purposes only and does not take into account your personal circumstances or objectives. Nothing in this material is (or should be considered to be) financial, investment or other advice on which reliance should be placed.
No opinion given in the material constitutes a recommendation by CMC Markets or the author that any particular investment, security, transaction, or investment strategy is suitable for any specific person. The material has not been prepared in accordance with legal requirements designed to promote the independence of investment research. Although we are not specifically prevented from dealing before providing this material, we do not seek to take advantage of the material prior to its dissemination.

Will NASDAQ Continue Its Climb? Here's my Trade Plan.📈 NASDAQ 100 (NAS100) Technical & Price Action Outlook 💡🚀
The NASDAQ has been in a strong bullish trend, driven by optimism around interest rates, tech earnings, and positive momentum. 📰💻 While price has pushed up aggressively, it’s now trading near key highs and buy-side liquidity zones—a spot where I’m anticipating a possible pullback. 🔁💰
I’m watching closely for a retracement into the 50% Fibonacci zone—my point of interest for a potential long setup. 🎯📐 However, I’ll only consider entering if price breaks structure bullish (BoS) after the pullback. 📊🧠
The index is still recovering from earlier 2025 losses, and resistance lies just ahead—so risk management is key. 🧘♂️⚠️
Not financial advice.

Nasdaq: The Rally Continues!The Nasdaq ended last week with strong upward momentum, moving swiftly toward the resistance at 20,694 points. Now it's getting interesting: once the index breaks above this mark, it should quickly enter our upper turquoise Target Zone (coordinates: 21,751 – 22,425 points), where we expect the peak of wave X in turquoise. Afterward, we anticipate a pullback during wave Y, which should aim for our lower turquoise Target Zone (coordinates: 17,074 – 15,867 points). The corrective magenta wave (4) should be completed there. However, if the Nasdaq directly surpasses the significant resistance at 23,229 points, our alternative scenario will take effect. In this 35% likely case, we would consider wave alt.(4) as already complete and locate the index in the impulsive wave alt.(5) .

Nasdaq-100 H4 | Falling toward a pullback supportThe Nasdaq-100 (NAS100) is falling towards a pullback support and could potentially bounce off this level to climb higher.
Buy entry is at 19,595.55 which is a pullback support.
Stop loss is at 18,900.00 which is a level that lies underneath an overlap support.
Take profit is at 20,343.35 which is a swing-high resistance.
High Risk Investment Warning
Trading Forex/CFDs on margin carries a high level of risk and may not be suitable for all investors. Leverage can work against you.
Stratos Markets Limited (tradu.com):
CFDs are complex instruments and come with a high risk of losing money rapidly due to leverage. 63% of retail investor accounts lose money when trading CFDs with this provider. You should consider whether you understand how CFDs work and whether you can afford to take the high risk of losing your money.
Stratos Europe Ltd (tradu.com):
CFDs are complex instruments and come with a high risk of losing money rapidly due to leverage. 63% of retail investor accounts lose money when trading CFDs with this provider. You should consider whether you understand how CFDs work and whether you can afford to take the high risk of losing your money.
Stratos Global LLC (tradu.com):
Losses can exceed deposits.
Please be advised that the information presented on TradingView is provided to Tradu (‘Company’, ‘we’) by a third-party provider (‘TFA Global Pte Ltd’). Please be reminded that you are solely responsible for the trading decisions on your account. There is a very high degree of risk involved in trading. Any information and/or content is intended entirely for research, educational and informational purposes only and does not constitute investment or consultation advice or investment strategy. The information is not tailored to the investment needs of any specific person and therefore does not involve a consideration of any of the investment objectives, financial situation or needs of any viewer that may receive it. Kindly also note that past performance is not a reliable indicator of future results. Actual results may differ materially from those anticipated in forward-looking or past performance statements. We assume no liability as to the accuracy or completeness of any of the information and/or content provided herein and the Company cannot be held responsible for any omission, mistake nor for any loss or damage including without limitation to any loss of profit which may arise from reliance on any information supplied by TFA Global Pte Ltd.
The speaker(s) is neither an employee, agent nor representative of Tradu and is therefore acting independently. The opinions given are their own, constitute general market commentary, and do not constitute the opinion or advice of Tradu or any form of personal or investment advice. Tradu neither endorses nor guarantees offerings of third-party speakers, nor is Tradu responsible for the content, veracity or opinions of third-party speakers, presenters or participants.

Nasdaq-100 Goes Back to 'PRE-PAIN' 20 000 Level. Series IIApril has gone..
Wow.. Duh..!? ..really? ... or still not!?
Briefly a month ago or so, we have examined at our wonderful @PandorraResearch Team what is 'Revenge Trading', watch our recent 'Educational' idea right here (if you missed one), to learn what sort of lessons we should know about it.
Indeed, it was a really bad story, to purchase in late March 2025 most-hyped so-known Mag Seven stock that came flagships of the recent stock market collapse.
First of all, watch how it's been below (late March 2025) 👇👇
What's happened next just in a week or two since our publications has been made?
⚒ Russell 2000 Index TVC:RUT 95% stocks were: DOWN
⚒ S&P500 Index SP:SPX 96% stocks were: DOWN
⚒ Nasdaq-100 NASDAQ:NDX as well as Dow Jones Industrial Averages DJIA indices: 97% stocks were DOWN
⚒ Magnificent Seven: ALL STOCKS WERE DOWN
Since Nasdaq-100 went back to pre-pain 20'000 Level, lets repeat some lessons.
Revenge trading is DANGEROUS AND HARMFUL pracrice where traders, after suffering a loss, attempt to immediately recoup their losses by making impulsive, emotionally-driven trades. This behavior is widely recognized as one of the major reasons traders lose significant amounts of money and often blow up their accounts.
Why Revenge Trading Is Bad
1. Emotional Decision-Making Replaces Strategy
When traders engage in revenge trading, they abandon their carefully crafted trading strategies and risk management rules. Instead, trades are made based on anger, frustration, or the desire to "get back" at the market. This emotional state clouds judgment, leading to irrational decisions such as increasing position sizes recklessly, disregarding stop-loss orders, or chasing trades without proper analysis. As a result, the likelihood of making successful trades plummets.
2. Escalating Losses and Account Blowups
The urge to recover losses quickly often leads traders to double down or over-leverage their positions, exposing a large portion of their capital to additional risk. Statistically, 80% of revenge trading ends disastrously, with only a small fraction experiencing temporary success before ultimately facing larger losses. This cycle of chasing losses can rapidly erode trading capital, making recovery increasingly difficult.
3. Psychological Burnout and Stress
Revenge trading is mentally and emotionally exhausting. The constant cycle of loss and frantic attempts to recover can lead to stress, depression, and burnout. This further impairs decision-making, creating a vicious cycle of poor performance and deteriorating mental health.
4. Long-Term Damage to Trading Habits
Repeatedly succumbing to revenge trading ingrains bad habits, making it difficult for traders to maintain discipline and consistency in the long run. This lack of consistency undermines the potential for sustainable profitability and can end trading careers prematurely.
Recent Real-World Examples
Recent years have seen numerous cautionary tales illustrating the dangers of revenge trading (all links are from r/wallstreetbets subreddit for learing/ educational purposes only):
$40,000 Lost on NVDA Options (2024). A trader repeatedly doubled down on Nvidia (NVDA) put options during its price rally in mid-2024. Despite initial small wins, the trader, driven by the urge to recover losses, continued to increase his position size, ultimately losing over $40,000.
$26,000 Lost in 20 Minutes on SPX. A Reddit user reported losing $26,000 in about 20 minutes trading the S&P 500 index (SPX) after prices dropped sharply. The loss was the result of impulsive trades made in an attempt to quickly recover from earlier setbacks.
From $27,000 to $0 in Three Days. Another trader turned $500 into $27,000 in just a few days, only to lose it all within 48 hours after a market reversal. Instead of taking profits or stepping back, the trader kept chasing losses with increasingly risky trades, ending up with nothing.
$100,000 Loss on a Yen Carry Trade. A trader, influenced by news of geopolitical tensions, made a large leveraged bet on the yen. After an initial loss, he refused to cut his losses and doubled down, ultimately losing $100,000 instead of accepting a smaller $30,000 hit.
More juicy stories are to be collected...
These stories are not isolated incidents. They are echoed across trading forums and social media, serving as stark warnings of how quickly revenge trading can destroy even substantial gains.
Conclusion
Revenge trading is DANGEROUS AND HARMFUL because it replaces rational, strategic decision-making with emotional reactions, leading to escalating financial losses, psychological distress, and long-term damage to trading discipline. The real-world examples from the past year underscore that no trader-regardless of experience-is immune to its risks. The best defense is to recognize the urge, step away, and return only with a clear, objective mindset and a disciplined strategy.
--
Best wishes,
@PandorraResearch Team 😎
