NAS100 Analysis: Reversal Predictions Based on Trading MathDear Trader,
Please find attached my analysis of $Subject, which uses mathematical calculations to identify potential reversal times and price levels.
The analysis details projected south and north price targets (horizontal lines on the chart), along with estimated time frames for possible reversals (vertical lines on the chart, accurate to within +/- 1-2 candles). Please note that all times indicated on the chart, including the vertical lines representing potential reversal times, are based on the UTC+4 time zone.
To increase the probability of these analysis, I recommend monitoring the 5-minute and 15-minute charts for the following key reversal candlestick patterns:
Doji’s
Hammer/Inverted Hammer
Double/Triple Bottom/Top
Shooting Star
Morning Star
Hanging Man
I welcome your feedback on this analysis, as it will inform and enhance my future research.
Regards,
Shunya Trade
⚠️ Disclaimer: This post is educational content and does not constitute investment advice, financial advice, or trading recommendations. The views expressed here are based on technical analysis and are shared solely for informational purposes. The stock market is subject to risks, including capital loss, and readers should exercise due diligence before investing. We do not take responsibility for decisions made based on this content. Consult a certified financial advisor for personalized guidance.
Nasdaq100

Nasdaq market analysis: 03-APRIL-2025Good morning Dear Traders! Join me for Nasdaq market analysis for the today. Share your charts, ask questions, and let's discuss trading strategies.

Today analysis for Nasdaq, Oil, and GoldNasdaq
The Nasdaq closed higher on the daily chart. However, following the announcement of mutual tariffs after the previous session’s close, the index experienced a significant gap-down. On the daily chart, the MACD has crossed below the signal line, generating a sell signal, though confirmation is still pending. If today's session closes with a bearish candle, we must monitor whether this leads to a third wave of selling, signaling further downside.
Due to the gap-down, the price is now significantly distanced from the 3-day and 5-day moving averages (MAs), making it crucial to observe whether the price rebounds intraday or continues to decline further. With the first support level at 19,000 now breached, the next key support is around 18,500. When considering buy positions, it is essential to manage stop-loss risk carefully.
On the 240-minute chart, a sell signal has appeared but is not yet confirmed. If confirmed, it could trigger a third wave of selling pressure, potentially leading to further declines. Given the increased market volatility, a cautious approach is recommended—reducing leverage and only trading at key price levels to minimize potential losses.
Crude Oil
Crude oil closed higher while maintaining a range-bound movement around $72. On the daily chart, the MACD has moved above the signal line and the zero line, establishing a bullish trend. However, following the mutual tariff announcement, the price gapped down, dropping below $70. The strongest support zone lies around $68, making it crucial to observe whether the MACD adjusts and aligns with the signal line before rebounding from this support level to resume the bullish trend.
On the 240-minute chart, a sell signal has appeared, but with multiple support levels nearby and both MACD and the signal line still above the zero line, the market is likely to attempt rebounds. A buy-the-dip approach remains favorable, but caution is necessary given today’s OPEC meeting, which could lead to increased volatility.
Gold
Gold closed higher, finding support at the 5-day MA. Following the mutual tariff announcement, the price initially gapped up to around 3,200, before pulling back. As previously mentioned, the upward target for this wave is around 3,216, with strong buying momentum continuing. On the daily chart, gold is trading between the 5-day MA and the upper Bollinger Band, maintaining a one-way bullish structure.
A bullish strategy remains favorable unless the daily close falls below the 10-day MA. On the 240-minute chart, the MACD remains above the zero line and previously attempted to break above the signal line but has since pulled back. Since buying momentum is still present, if the price finds support at a key supply zone, another leg higher could occur, potentially triggering a golden cross in the MACD and leading to a third wave of buying pressure.
Short positions should be approached with caution, and given the increased market volatility, risk management is crucial. Whether buying or selling, stop-loss discipline is essential to manage potential risks.
Market volatility has surged since the pre-market session due to Trump’s mutual tariff policies. Volatility is both an opportunity and a risk for traders. Do not let greed lead to losses in a market that doesn’t match your trading style. Adjust position sizes accordingly and only trade within your comfort zone. The market is always open. Do not focus solely on today—take a steady and stable approach to trading.
Wishing you a successful trading day!
If you like my analysis, please follow me and give it a boost!
For additional strategies for today, check out my profile. Thank you!

MON100 : Going long for about 5% of the net capitalTook two positions of 2.5% of the net capital each, at various levels, summing up the total holding in the scrip for about 5% of the net capital. Will be targeting the all time high for a percentage move of about 20% from the current average entry price.
Might consider adding on to the position if price dips and reaches the next critical buying zone, after evaluating the fundamental and sentimental scenarios prevailing globally at the time.
📢📢📢
If my perspective changes or if I gather additional fundamental data that influences my views, I will provide updates accordingly.
Thank you for following along with this journey, and I remain committed to sharing insights and updates as my trading strategy evolves. As always, please feel free to reach out with any questions or comments.
Other posts related to this particular position and scrip, if any, will be attached underneath. Do check those out too.
Disclaimer : The analysis shared here is for informational purposes only and should not be considered as financial advice. Trading in all markets carries inherent risks, and past performance is not indicative of future results. It’s essential to conduct your own research and assess your risk tolerance before making any investment decisions. The views expressed in this analysis are solely mine. It’s important to note that I am not a SEBI registered analyst, so the analysis provided does not constitute formal investment advice under SEBI regulations.

Nasdaq trading zones: 02-APRIL-2025Discover today's Nasdaq trading zones and refine your market analysis skills.

Today analysis for Nasdaq, Oil, and GoldNasdaq
The Nasdaq closed higher on the daily chart. Although a sell signal briefly appeared in the previous session, the MACD failed to form a bearish crossover with the signal line, instead finding support and rebounding. The index strongly bounced from its low, reaching the 5-day moving average (MA) before closing with an upper wick.
Since the MACD is supporting the signal line and potentially resuming an upward trend, the key level to watch is whether the price can break through the strong resistance at 19,625–19,675. As long as the MACD does not confirm a bearish crossover, it is advisable to trade within the range.
On the 240-minute chart, the index rebounded from the bottom while generating a buy signal. However, with strong resistance around 19,675, if the price pulls back once more, it could either form a double bottom or resume a strong upward move from a single-bottom structure.
Although the MACD has crossed above the signal line (golden cross) on the 240-minute chart, it is still far from the zero line, suggesting that further pullbacks may occur after additional gains. It is important to avoid chasing the price and instead focus on buying dips at key support levels while maintaining a range-trading approach.
Crude Oil
Oil closed flat, facing resistance at $72. On the daily chart, the price broke above the 240-day MA and is now testing resistance from a previous supply zone. It is likely to consolidate within a range while pulling up the short-term moving averages.
The daily MACD has moved above the zero line, lifting the signal line as well. If the price remains in a range-bound consolidation, the signal line will eventually rise above the zero line, further supporting a bullish structure.
Key upcoming events include today’s oil inventory report and tomorrow’s OPEC meeting, which could act as catalysts for either a continuation of the rally or a pullback. Since there is still a gap between the 3-day and 5-day MAs, range trading remains the best approach.
On the 240-minute chart, strong buying momentum continues, but given the heavy supply at previous resistance levels, a period of sideways movement or a pullback is likely.
If a bearish crossover occurs on the 240-minute chart, oil could drop below $70. For now, monitor whether the uptrend can hold, and if it does, consider trading within the range while managing downside risks.
Gold
Gold closed lower after an overshoot to the upside. On the daily chart, the price was in an overextended high position, with a significant gap from the 3-day and 5-day MAs. After a brief rally, selling pressure emerged, leading to a bearish close.
Since gold has yet to properly test the 5-day MA, a pullback to this level remains a possibility. However, the daily MACD is still trending upward, and liquidity remains strong, increasing the likelihood of a one-way rally unless the 10-day MA is broken. Short positions should be approached with caution.
On the 240-minute chart, a bearish crossover has occurred, leading to a pullback from the high. However, since the uptrend remains intact, even if the MACD crosses below the signal line, the fact that it is still above the zero line suggests a potential rebound.
The best strategy is to focus on buying dips at key support levels, as the market is likely to consolidate before resuming a trend move. Be cautious when trading within a range-bound market.
With Friday’s U.S. employment report approaching, market volatility remains elevated. Trump’s tariff policies are increasing concerns about inflation and a potential economic slowdown. The interpretation of upcoming economic data will be crucial in determining market direction.
Risk management remains essential, so trade cautiously and stay prepared.
Wishing you a successful trading day!
If you like my analysis, please follow me and give it a boost!
For additional strategies for today, check out my profile. Thank you!

Nasdaq market analysis: 01-APRIL-2025Good morning! Happy New Day! Here's your daily Nasdaq market analysis. Learn, grow, and trade wisely.

Today analysis for Nasdaq, Oil, and GoldNasdaq
The Nasdaq closed lower with a gap-down amid growing recession fears. Although it did not reach the 20-month moving average (MA) on the monthly chart, last month’s long bearish candlestick has resulted in a sell signal on the monthly futures chart—the first time in three years since February 2022. From a monthly perspective, the 16,900–17,500 range appears to be a good buying zone, but it is important to monitor whether the index reaches this level within this month’s candle. The 20-month MA is likely to be briefly breached, even if a lower wick forms.
On the weekly chart, the Nasdaq is currently finding short-term support around 19,000, but given the large gap between the 3-week and 5-week MAs, a rebound remains a possibility. On the daily chart, a sell signal has not yet been confirmed. If further declines confirm a bearish crossover, the Nasdaq could enter a third wave of selling, with a target of 17,300. The key question is whether the market experiences another sharp drop.
However, given the significant distance from the 5-day MA, the more likely scenario is sideways movement for a few days, allowing the moving averages to catch up before a potential further decline. In this case, it is advisable to trade within the range but always use stop-losses. The 240-minute chart also shows strong downward movement. While the market is in oversold territory, making short-selling more favorable, there is also the possibility of a range-bound pattern forming on the daily chart. If taking buy positions at the lows, strict stop-loss management is essential.
Crude Oil
Oil closed higher following news of tariffs imposed on Russian oil. The price successfully broke above the key resistance at $70, also surpassing the 240-day MA. On the monthly chart, oil has now entered a range where further upside potential exists, and there is a possibility that the MACD could attempt a bullish crossover with the signal line.
On the daily chart, the MACD has moved above the zero line, pulling the signal line upward. If the price stays above the 240-day MA, it may form a strong trend reversal pattern with accelerated gains. On the 240-minute chart, the MACD remains above the zero line and is crossing above the signal line, indicating continued buying momentum.
Overall, it is best to focus on buying dips, as April’s first trading session could see the price gapping above the 240-day MA. Holding overnight short positions carries risk, so caution is advised.
Gold
Gold closed higher, driven by strong demand for safe-haven assets. On the monthly chart, gold formed a long bullish candlestick. However, given the large gap between the price and the 3-month & 5-month MAs, a pullback remains a possibility. The key question is whether gold will continue rising before a correction or correct first before resuming its uptrend. It is best to monitor the price action closely.
On the daily chart, the MACD is forming a third wave of buying pressure, opening the possibility for a price target around 3,216. Thus, it is advisable to focus on buying dips, while being cautious about chasing highs due to potential volatility. The 240-minute chart indicates that strong buying momentum continues, as gold remains in overbought territory.
Since this is the beginning of a new month, key economic reports—including the ISM Manufacturing PMI and the U.S. Jobs Report—could significantly impact gold’s volatility. For both buy and sell positions, it is essential to set stop-loss levels, as increased volatility is expected.
With Trump’s tariff policies increasing the risk of a global recession, liquidity in global equity markets is drying up, reducing the attractiveness of stocks. The clear contrast between Nasdaq and gold’s performance is likely to persist for some time.
As we enter April’s first trading session, trade cautiously and adapt to market conditions.
Wishing you a successful trading day!
If you like my analysis, please follow me and give it a boost!
For additional strategies for today, check out my profile. Thank you!

NASDAQ 100: Bear Market in Sight?The NASDAQ 100 has officially entered correction territory, now trading more than -10% below its most recent high. Even more concerning: it's just 5% away from a full-blown bear market, which is defined as a drop of -20% or more.
As seen in the chart, we’ve broken below the -15% threshold and are rapidly approaching the critical 18,113 level, which would mark the -20% mark. If price action fails to hold the current level and momentum continues downward, we could be on the verge of a major shift in market sentiment.
If the bear market threshold is crossed, it may trigger panic selling or forced liquidation.
We should prepare for increased volatility and monitor this level closely. A bounce here could be a buying opportunity — but a breakdown could open the door to a deeper downturn.
Will buyers step in... or are we heading deeper into bearish territory?

Nasdaq 100 Opens the Door to a New Bearish TrendThe Nasdaq has been one of the indices showing the strongest selling bias in recent sessions. Over the past four trading days, it has fallen by more than 7% , as the market remains gripped by uncertainty surrounding White House trade policies and the threat of a new trade war. The proposed 25% tariffs on several countries are expected to take effect on April 2, and so far, there has been no official indication of a change in schedule. This has increased fears of a potential global economic slowdown, and if these conditions persist, it could further pressure equity indices, especially those already showing strong short-term bearish momentum.
New Potential Downtrend
Since February 20, the Nasdaq has been experiencing consistent selling pressure, driving the index below the 19,000-point level. Recent bullish attempts have so far failed to break through this new downward trendline, which now stands as the dominant technical structure for the index. If selling pressure remains intact, the current bearish trend could extend over the coming sessions.
ADX Indicator
Although the ADX line remains above the 20 level—generally considered the threshold for trend strength—it has been sloping downward, suggesting that the recent buying momentum may be losing strength, potentially leading to a short-term pause in market activity.
RSI Indicator
The Relative Strength Index (RSI) shows a similar picture. The RSI is hovering near the oversold zone at 30, and a bullish divergence has formed, as the Nasdaq has made lower lows, while the RSI has posted higher lows. This could indicate that selling momentum may be weakening, potentially paving the way for a short-term bullish correction.
Key Levels:
20,500 points – Distant resistance: This level aligns with the 200-period moving average. Price action approaching this area could revive bullish sentiment and potentially invalidate the current downtrend visible on the chart.
19,700 points – Near resistance: This level marks the upper boundary of the short-term descending trendline. It may serve as a tentative area for corrective upward movements in the upcoming sessions.
18,800 points – Key support: This level corresponds to 2024’s neutral price zone. If the price breaks below it, it could reinforce the current bearish trend and lead to further downside.
By Julian Pineda, CFA – Market Analyst

Today analysis for Nasdaq, Oil, and GoldNasdaq
The Nasdaq closed sharply lower, forming a long bearish candlestick, as recession fears intensified. The index fell toward the lower Bollinger Band on the daily chart, while the MACD moved closer to the signal line, indicating a correction.
On the weekly chart, the Nasdaq faced resistance slightly above the 5-week MA, forming an upper wick and closing lower. The MACD is falling steeply, and the signal line is also in a downtrend, suggesting the potential for an overshooting move downward before forming a bottom. From a daily perspective, key support zones to watch are around 19,000 (first level) and 18,500 (second level). The MACD has not yet crossed below the signal line, but if a bearish crossover (death cross) occurs, a strong third wave of selling pressure could emerge. Therefore, caution is advised for long positions. However, since the MACD has not yet confirmed a bearish crossover, there is also the possibility of a rebound off the signal line. It is crucial to wait for a confirmed trend reversal before taking long positions.
On the 240-minute chart, strong sell signals have emerged, leading to a steep decline. The current price action resembles the movement seen on February 21, but since the bottom is not yet clear, it is best to adopt a conservative approach. For short positions, the 3-day moving average can be used as a reference level. For long positions, the lower Bollinger Band may provide a short-term buying opportunity. As today marks the last trading day of the month, watch closely to see if the Nasdaq reaches the 20-month MA or ends the month with a lower wick.
Crude Oil
Oil closed lower, facing resistance at $70. It has fallen back below the 5-day MA, trapping the price within a range-bound structure. On the weekly chart, oil was rejected at the 10-week MA, and since the MACD has not yet formed a bullish crossover, there is a chance that oil could retest its previous double-bottom level. A consolidation phase between the 5-week and 10-week MAs appears likely.
On the daily chart, as the price corrected, the MACD began converging with the signal line. If oil retraces to around $68, a short-term buying opportunity may arise. For oil to resume its uptrend, it needs to pull back toward $68, rebound, and break above $70 with strong momentum. However, this move would likely require a global catalyst. On the 240-minute chart, both the MACD and signal line remain above the zero line, suggesting a higher probability of a rebound and a golden cross formation. Overall, the best approach is to focus on dip-buying opportunities during this phase.
Gold
Gold closed higher, breaking to a new all-time high on the daily chart. Last week, there was a possibility of a pullback toward the 5-week MA, but the MACD has turned upward, surpassing its previous high, reducing the likelihood of a bearish divergence and increasing the probability of further upside. However, since gold has not yet tested the 5-week MA, a short-term correction remains a possibility. On the daily chart, buying opportunities were available at the 3-day MA following a strong bullish candle. A pullback to the 5-day MA within the next few days remains possible, and if this happens, it could present another dip-buying opportunity. Based on wave analysis, gold could target around 3,216. To confirm this upside scenario, the daily chart must show stronger bullish momentum, eliminating the risk of MACD divergence.
On the 240-minute chart, gold has been experiencing strong upward momentum, making it a buy-on-dips market. However, for a more comfortable long position, the MACD needs to exceed its previous peak. Overall, a long-only strategy remains preferable. For short positions, it is difficult to pinpoint the exact peak, so strict stop-loss management is essential. This week, key economic events include the ISM Manufacturing & Services PMIs and Friday's U.S. jobs report, which could increase gold's volatility. Stay cautious.
Today marks the final trading session of March. Tariff-related news and gold’s record highs indicate rising market volatility. Stay adaptive to the market’s movements and trade safely as we close the monthly candle.
Wishing you a successful trading day!
If you like my analysis, please follow me and give it a boost!
For additional strategies for today, check out my profile. Thank you!

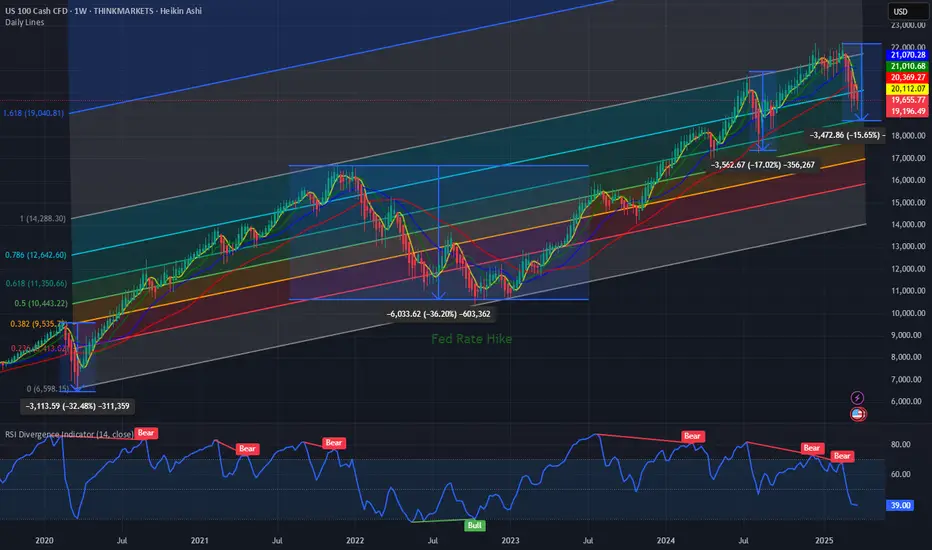
$NAS100 in correction mode. Is a bounce coming?Market experts will say 10% is a correction 20% is a bear market. In the last 5 years NASDAQ100 has been in the bear market 2 times. Once during COVID19 and another time during the FED Rate hike cycle. And it has been in correction mode in Aug 2024 when the Yen carry trade unwound.
Since Aug 2024 PEPPERSTONE:NAS100 has shown great strength with higher highs and higher lows and perfectly within the upward slopping Fib Retracement channel as shown in the chart below respecting the major fib levels and bouncing off from the 0.618 Fib retracement level every time it had a drawdown. The current correction in PEPPERSTONE:NAS100 is very close to the 0.618 Fib retracement level which is currently at 18700. This will indicate another potential downside of 2-3 % and if the Fib levels are supposed to holds then we will see a bottom @ 18700 and a bounce back from those levels. This will also bring down the RSI to low 30s which will indicate an oversold position.
Verdict: Start DCA into $ NAS100 and go long 18700.
TESLA: Key Days! NASDAQ Bottoms and TESLA Breaking Out!!Everyone is thinking about today, about how difficult it is to know whether a stock will rise or fall since Trump came to power!!! :-). On April 2nd, many things will become clear after the official publication of the tariffs, but it's true that with a person like Trump in power, ANYTHING CAN HAPPEN in the future!!
As with any investment, you have to analyze all the variables that could affect its performance. Today we'll analyze TESLA!! , one of the hardest hit in the American market, mainly due to TRUMP!!! , FOR BEING TRUMP'S FRIEND!! :-).
--> What does TESLA have AGAINST IT?
1) TARIFFS: If Trump punishes countries around the world with tariffs, they (mainly China) will fight back!! , and the one that WILL BE PUNISHED THE MOST will be TESLA for Elon Musk being in power alongside Trump.
2) CHINESE ELECTRIC CARS: The competition is clear! There are Chinese vehicle companies that will compete strongly with Tesla, mainly due to price, although from my point of view, Tesla will win because Tesla is a brand of reliability, while Chinese companies are not.
3) NASDAQ: If the US enters a recession or decline, all technology will fall sharply, and with it, obviously, Tesla.
--> But what STRENGTHS does it have?
1) ELON MUSK IN POWER IN THE USA: We all know Elon Musk! And once in power, he will take full advantage of it to strengthen his companies in the coming months/years.
2) TESLA: New Tesla models and the world's most efficient batteries, in addition to the release of its first line of MOBILE PHONES, which we're all sure will be IMPRESSIVE!!
3) 40% YEAR-ROUND DROP: The sharp decline accumulated through 2025 makes this a company with GREAT appreciation potential, and at the slightest bit of good news, it will rise sharply.
With these PROS and CONS, we now have the variables outside of mathematics that could affect the value. Now it's time for TECHNICAL ANALYSIS, and for that, I've published two charts: the one above for TESLA on a H1 timeframe and the one below for the NASDAQ on a H4 timeframe. Why the one for the NASDAQ? Because you always have to analyze the direction of the INDEX, since a global drop in technology would drag down the company even if the technicals were favorable.
---> How do you view the NASDAQ?
The Nasdaq is clearly bearish in a key support zone for its future. It must not lose its current zone, and in the event of an upward rebound, it will form a bottom and signal a bullish (bullish) signal for the index in the coming weeks/months, causing all technology to rise sharply.
--> How is Tesla doing?
Tesla's outlook is better than the NASDAQ's, as it is entering a zone with intentions of breaking out higher! If Tesla surpasses 293, it will end the bearish phase it has been in since the beginning of the year and begin a bullish recovery phase. Therefore, if the NASDAQ bottoms out! When Tesla surpasses 293, we will go long without hesitation!
--------------------------------------
Strategy to follow:
ENTRY: We will open 2 long positions if the H4 candle closes above 293.
POSITION 1 (TP1): We close the first position in the 325 zone (+11%)
--> Stop Loss at 242 (-17%).
POSITION 2 (TP2): We open a Trailing Stop position.
--> Initial trailing stop loss at (-17%) (coinciding with the 242 level of position 1).
--> We modify the trailing stop loss to (-1%) when the price reaches TP1 (293).
-------------------------------------------
SETUP EXPLANATIONS
*** How do I know which 2 long positions to open? Let's take an example: If we want to invest €2,000 in the stock, we divide that amount by 2, and instead of opening one position of €2,000, we'll open two positions of €1,000 each.
*** What is a Trailing Stop? A Trailing Stop allows a trade to continue gaining value when the market price moves in a favorable direction, but it automatically closes the trade if the market price suddenly moves in an unfavorable direction by a specified distance. This specified distance is the trailing Stop Loss.
--> Example: If the trailing Stop Loss is at -1%, it means that if the price drops by -1%, the position will be closed. If the price rises, the Stop Loss also rises to maintain that -1% during increases. Therefore, the risk decreases until the position enters a profit. This way, you can take advantage of very strong and stable price trends, maximizing profits.

Nasdaq100 Update: Another Leg Down Likely After Recent Reversal?For quite some time, I have been highlighting the possibility of a strong correction in the Nasdaq 100 ( TRADENATION:USTEC ), with the 17,500 level remaining a realistic downside target.
In my more recent analyses, I argued that while a reversal from the 19,100 support zone was likely, it was merely a dead cat bounce , and the index could decline further from the 20,300-20,500 resistance zone. The lower boundary of this range was tested, and as expected, the index has started to fall again.
Although a temporary rally above 20,000 cannot be ruled out, my overall outlook remains unchanged—I still anticipate another leg down.
In conclusion, selling into rallies continues to be my preferred strategy, with 17,500 as the medium-term target.
Disclosure: I am part of Trade Nation's Influencer program and receive a monthly fee for using their TradingView charts in my analyses and educational articles.

Nasdaq analysis: 28-MAR-2025Good morning, traders! Today's Nasdaq analysis will help you achieve your trading goals. Let's work together towards success.

Trend Reversal in Play?After a strong bearish channel that lasted several weeks, the market has finally broken out of the resistance level — a key technical signal. This breakout was followed by higher lows and higher highs, suggesting a possible shift in momentum. 📈
Volume has also increased noticeably around the breakout zone, which can signal stronger conviction from buyers. The question now is: Are we entering a new uptrend?
As long as the price holds above the broken resistance (now acting as support), bulls could take control. Traders should keep an eye on key support zones and potential continuation patterns to confirm the trend reversal.
👉 What do you think — new rally or a bull trap?

Breaking: Alvotech Shares Dips 5% On Earnings Report Shares of Alvotech (NASDAQ: NASDAQ:ALVO ) saw a noteworthy downtick of 5% amidst earnings report yesterday after market close. Alvotech, through its subsidiaries, develops and manufactures biosimilar medicines for patients worldwide. It offers biosimilar products in the therapeutic areas of autoimmune, eye, and bone disorders, as well as cancer.
Financial Performance
In 2024, Alvotech's revenue was $491.98 million, an increase of 426.84% compared to the previous year's $93.38 million. Losses were -$231.86 million, -57.98% less than in 2023.
Highlights of the Financial Results for 2024 Full Year
Cash position and sources of liquidity: As of December 31, 2024, the Company had cash and cash equivalents of $51.4 million.
Product Revenue: Product revenue was $273.5 million for the year ended December 31, 2024, compared to $48.7 million for the same period in the prior year.
License and Other Revenue: License and other revenue was $216.2 million for the year ended December 31, 2024, compared to $42.7 million for the same period in the prior year. The license and other revenue of $216.2 million was primarily attributable to the achievement of key research and development milestones during 2024:
Cost of product revenue: Cost of product revenue was $185.3 million for the year ended December 31, 2024, compared to $160.9 million for the same period in the prior year.
Research and development (R&D) expenses: R&D expenses were $171.3 million for the year ended December 31, 2024, compared to $210.8 million for the same period in the prior year.
General and administrative (G&A) expenses: G&A expenses were $65.7 million for the year ended December 31, 2024, compared to $76.6 million for the same period in the prior year.
Operating profit: Operating profit was $69.6 million for the year ended December 31, 2024, compared to ($354.9) million for the same period in the prior year.
Share of net loss of joint venture and loss on sale of interest in joint venture: In June 2024, the Company sold its share in the joint venture for gross proceeds of $18.0 million (less $1.3 million in transaction costs). The sale resulted in a net loss of $3.0 million during the year ended December 31, 2024.
Finance income: Finance income was $80.1 million for the year ended December 31, 2024, compared to $4.8 million for the same period in the prior year.
Finance costs: Finance costs were $303.2 million for the year ended December 31, 2024, compared to $267.2 million for the same period in the prior year.
Loss on extinguishment of financial liabilities: On June 7, 2024, the Company entered into a $965.0 million Senior Loan Facility, maturing in July 2029 that was funded in July 2024. Upon the closing of the Senior Loan Facility, the Company was required to settle its existing debt obligations.
Income tax (expense) / benefit: Income tax expense was $14.3 million for the year ended December 31, 2024, compared to a benefit of $99.3 million for the same period in the prior year.
Loss for the Year: Reported net loss was $231.9 million, or ($0.87) per share on a basic and diluted basis, for the year ended December 31, 2024, compared to a reported net loss of $551.8 million, or ($2.42) per share on a basic and diluted basis, for the same period in the prior year.

US100 NASDAQ100 Long Market turns!U.S. stocks ended higher on Tuesday on optimism that President Donald Trump’s reciprocal tariffs, which go into effect from April 2, will be less aggressive than previously expected
Therefor as traders we are very flexible and have to react fast,because a lot of people say a lot of things, and that makes the markest move faster and turning back more quickly.
Also its essential to take profits immediately as the markets move fast and turning, before giving that money gained back to the market.
Below the red line Bearish setups.
Rockets:Conservative(near of support) AND AGGRESSIVE ENTRIES.
Risk and money management is essential.Think about your stops!

$NASDAQ420 May Be Set for 1000% Surge Amidst Falling Wedge The price of Nasdaq420 ($NASDAQ420) coin may be gearing up for a massive price surge amidst a steep falling wedge pattern. The token Nasdaq420 ($NASDAQ420) created on the Ethereum blockchain is a metaphysical evolution of the Nasdaq100, harnessing vibrational energy to manifest the community's truest desires.
The asset since creation surge to $15.51 million in market cap before consolidating to $1.59 Million in market cap. Albeit not listed on any CEX, the token's price chart depicts a bullish reversal is brewing with a 1000% surge in sight. With the tokens immediate competitor $SPX6900 performing brilliantly well, Nasdaq420 ($NASDAQ420) will be poised to mirror such moves and bring light to its project and the community.
With the Relative Strength Index (RSI) at 53 Nasdaq420 ($NASDAQ420) has been holding the bears for long in the $1 million market cap support zone. With an active community of 2600 on Telegram, 2972 on X (formerly Twitter), Nasdaq420 ($NASDAQ420) might just be the next gem in the Ethereum memecoinomy.
Nasdaq420 Price Live Data
The live Nasdaq420 price today is $0.001593 USD with a 24-hour trading volume of $14,041.94 USD. Nasdaq420 is down 2.82% in the last 24 hours, with a live market cap of $1,593,336.2. The circulating supply is 1,000,000,000 NASDAQ420 and the max. supply is 1,000,000,000 NASDAQ420.

Today analysis for Nasdaq, Oil, and GoldNasdaq
The Nasdaq closed lower, facing resistance at the 240-day moving average on the daily chart. With a significant gap between the price and the 5-day moving average, a pullback toward the 5-day MA was anticipated. The index did find support at the 5-day MA, closing with a lower wick. The key question now is whether the current correction wave will fill the gap created on Monday, as it faced resistance at the 240-day line. If you’re looking to buy on dips, it’s best to focus on the gap area as a potential support zone. The MACD remains in a golden cross, and with a noticeable spread from the signal line, the market is likely to stay range-bound unless a bearish crossover occurs.
On the 240-minute chart, a bearish crossover (death cross) has formed, suggesting the potential for further downside. However, the price is approaching a strong support zone where buying interest previously emerged. Thus, buying on dips in lower zones may be favorable. In the short term, both the MACD and the signal line remain above the zero line, indicating a possible short-term rebound. Be cautious with chasing short positions and monitor lower time frames.
Also, don’t forget: Today’s GDP release may influence market direction.
Crude Oil
Oil closed higher, reaching $70 on the daily chart. Since the $70–71 range is a major resistance zone, it’s likely the trend may consolidate in this area. The daily MACD is rising sharply, and buying pressure appears strong and one-sided. Despite the resistance at $70–71, if oil gaps up over the weekend, there’s a chance this resistance could be broken by a gap-up move on Monday. Keep an open mind to this possibility, but also be cautious over the weekend (over-the-weekend risk).
On the 240-minute chart, the MACD is bouncing off the signal line, with strong renewed buying pressure. However, if oil fails to break higher, a MACD divergence could develop, so avoid chasing longs at elevated levels. Overall, it’s safer to treat the $71 level as the upper boundary of a range, favoring short-term selling strategies. Watch the lower timeframes for signs of trend reversal.
Gold
Gold ended the day flat within a narrow range, forming a small consolidation box ahead of today’s GDP release and tomorrow’s PCE data. The daily MACD is converging with the signal line, suggesting we are approaching a turning point — either a new leg up or a bearish crossover. Both bullish and bearish scenarios remain open, so it’s important to monitor how the market reacts to upcoming data. If gold fails to push higher, a bearish divergence may form, opening the door to a pullback toward the 5-week MA on the weekly chart.
On the 240-minute chart, both MACD and the signal line are hovering near the zero line, indicating sideways movement. Since the signal line remains above zero, the buy side still holds a slight edge, but confirmation via a strong bullish or bearish candle is needed to establish a trend. Any MACD signal triggered at the zero line could lead to a larger directional move, so keep that in mind. Until data is released, continue range-bound trading, and avoid premature long or short positions, as today’s trend may remain undecided.
March is coming to an end. Make sure to keep a close eye on today and tomorrow's data releases and aim to close the month with solid results.
Wishing you a successful trading day!
If you like my analysis, please follow me and give it a boost!
For additional strategies for today, check out my profile. Thank you!

Nasdaq analysis: 27-MAR-2025Good morning, traders! Today's Nasdaq analysis will help you achieve your trading goals. Let's work together towards success.

I'll be honest here friends it's not looking good...I'll be honest here friends it's not looking good...
This may have been a Dead Cat Bounce on the NASDAQ:QQQ and AMEX:SPY friends.
GAP fills in both names lead to Bear Flag Breakdowns which in my mind leads to the next leg down.
Rejecting 200DMA on the NASDAQ:QQQ and losing control on the AMEX:SPY
Markets are hanging on slightly, lets see what happens the rest of the week.
Not financial advice

Nasdaq-100 H4 | Potential bullish bounceNasdaq-100 (NAS100) is falling towards a pullback support and could potentially bounce off this level to climb higher.
Buy entry is at 20,090.40 which is a pullback support.
Stop loss is at 19,800.00 which is a level that lies underneath a pullback support.
Take profit is at 21,044.20 which is an overlap resistance that aligns with the 61.8% Fibonacci retracement.
High Risk Investment Warning
Trading Forex/CFDs on margin carries a high level of risk and may not be suitable for all investors. Leverage can work against you.
Stratos Markets Limited (www.fxcm.com):
CFDs are complex instruments and come with a high risk of losing money rapidly due to leverage. 63% of retail investor accounts lose money when trading CFDs with this provider. You should consider whether you understand how CFDs work and whether you can afford to take the high risk of losing your money.
Stratos Europe Ltd (www.fxcm.com):
CFDs are complex instruments and come with a high risk of losing money rapidly due to leverage. 63% of retail investor accounts lose money when trading CFDs with this provider. You should consider whether you understand how CFDs work and whether you can afford to take the high risk of losing your money.
Stratos Trading Pty. Limited (www.fxcm.com):
Trading FX/CFDs carries significant risks. FXCM AU (AFSL 309763), please read the Financial Services Guide, Product Disclosure Statement, Target Market Determination and Terms of Business at www.fxcm.com
Stratos Global LLC (www.fxcm.com):
Losses can exceed deposits.
Please be advised that the information presented on TradingView is provided to FXCM (‘Company’, ‘we’) by a third-party provider (‘TFA Global Pte Ltd’). Please be reminded that you are solely responsible for the trading decisions on your account. There is a very high degree of risk involved in trading. Any information and/or content is intended entirely for research, educational and informational purposes only and does not constitute investment or consultation advice or investment strategy. The information is not tailored to the investment needs of any specific person and therefore does not involve a consideration of any of the investment objectives, financial situation or needs of any viewer that may receive it. Kindly also note that past performance is not a reliable indicator of future results. Actual results may differ materially from those anticipated in forward-looking or past performance statements. We assume no liability as to the accuracy or completeness of any of the information and/or content provided herein and the Company cannot be held responsible for any omission, mistake nor for any loss or damage including without limitation to any loss of profit which may arise from reliance on any information supplied by TFA Global Pte Ltd.
The speaker(s) is neither an employee, agent nor representative of FXCM and is therefore acting independently. The opinions given are their own, constitute general market commentary, and do not constitute the opinion or advice of FXCM or any form of personal or investment advice. FXCM neither endorses nor guarantees offerings of third-party speakers, nor is FXCM responsible for the content, veracity or opinions of third-party speakers, presenters or participants.
