Nasdaq-100 H4 | Bullish momentum to extend further?Nasdaq-100 (NAS100) is falling towards a pullback support and could potentially bounce off this level to climb higher.
Buy entry is at 19,873.89 which is a pullback support.
Stop loss is at 19,370.00 which is a level that lies underneath a multi-swing-low support.
Take profit is at 20,971.93 which is a swing-high resistance that aligns close to the 61.8% Fibonacci retracement.
High Risk Investment Warning
Trading Forex/CFDs on margin carries a high level of risk and may not be suitable for all investors. Leverage can work against you.
Stratos Markets Limited (www.fxcm.com):
CFDs are complex instruments and come with a high risk of losing money rapidly due to leverage. 63% of retail investor accounts lose money when trading CFDs with this provider. You should consider whether you understand how CFDs work and whether you can afford to take the high risk of losing your money.
Stratos Europe Ltd (www.fxcm.com):
CFDs are complex instruments and come with a high risk of losing money rapidly due to leverage. 63% of retail investor accounts lose money when trading CFDs with this provider. You should consider whether you understand how CFDs work and whether you can afford to take the high risk of losing your money.
Stratos Trading Pty. Limited (www.fxcm.com):
Trading FX/CFDs carries significant risks. FXCM AU (AFSL 309763), please read the Financial Services Guide, Product Disclosure Statement, Target Market Determination and Terms of Business at www.fxcm.com
Stratos Global LLC (www.fxcm.com):
Losses can exceed deposits.
Please be advised that the information presented on TradingView is provided to FXCM (‘Company’, ‘we’) by a third-party provider (‘TFA Global Pte Ltd’). Please be reminded that you are solely responsible for the trading decisions on your account. There is a very high degree of risk involved in trading. Any information and/or content is intended entirely for research, educational and informational purposes only and does not constitute investment or consultation advice or investment strategy. The information is not tailored to the investment needs of any specific person and therefore does not involve a consideration of any of the investment objectives, financial situation or needs of any viewer that may receive it. Kindly also note that past performance is not a reliable indicator of future results. Actual results may differ materially from those anticipated in forward-looking or past performance statements. We assume no liability as to the accuracy or completeness of any of the information and/or content provided herein and the Company cannot be held responsible for any omission, mistake nor for any loss or damage including without limitation to any loss of profit which may arise from reliance on any information supplied by TFA Global Pte Ltd.
The speaker(s) is neither an employee, agent nor representative of FXCM and is therefore acting independently. The opinions given are their own, constitute general market commentary, and do not constitute the opinion or advice of FXCM or any form of personal or investment advice. FXCM neither endorses nor guarantees offerings of third-party speakers, nor is FXCM responsible for the content, veracity or opinions of third-party speakers, presenters or participants.
Nasdaq100

Nasdaq analysis: 25-MAR-2025Good morning, trading community! Today's Nasdaq analysis is for you. Share your thoughts, ask questions, and let me help you grow.

Today analysis for Nasdaq, Oil, and GoldNasdaq
The Nasdaq closed higher, forming a gap up on the daily chart. It showed a strong, one-directional rebound up to the 5-week moving average on the weekly chart.
Since the 5-week MA overlaps with the 60-week MA, it's unlikely to break through easily without a short-term correction.
On the daily chart, the MACD has formed a golden cross, meaning that even if a pullback occurs, the strategy should remain buy-on-dip oriented.
There is still an open gap down to 19,960, which could be filled at any time—so it's important to consider the possibility of a retest of that level. If the gap is filled, that area could be a good support zone to buy from.
On the 240-minute chart, strong buying momentum entered around the zero line, confirming a breakout after basing in a range. Therefore, buying on pullbacks remains the preferred approach in this structure.
Crude Oil
Crude oil continued its upward move, closing higher on the daily chart.
With strong support around the $68 level, the market could potentially rise toward the $70 zone, and possibly test resistance between $70–$71, which is a key area to watch closely.
Overall, traders should continue to buy on dips, but be cautious with chasing long positions above $70. If taking short positions, they should be managed with tight stop-losses.
On the 240-minute chart, oil appears to be in the midst of a third wave rally, so any short positions should be considered above $70, while buying pullbacks remains valid.
Current Middle East tensions and U.S. sanctions on Venezuelan oil are contributing to a supply risk premium in oil prices.
Since the market is recovering from the lows and showing a positive technical setup, short trades should be managed carefully with proper risk control.
Gold
Gold closed lower, remaining within its range-bound structure. On the daily chart, gold is currently trading between the 3-day and 5-day MAs above, and the 10-day MA below, forming a narrow consolidation zone. This makes sell-at-highs and buy-at-lows strategies effective.
Since there's room for a pullback to the 5-week MA on the weekly chart, chasing longs is not advised. If the MACD crosses below the signal line, this could create a bearish divergence, leading to potential sharp downside, so caution is warranted.
On the 240-minute chart, the MACD is failing to break above the signal line and continues to decline. However, since the signal line remains above the zero line, a rebound attempt is likely, even if the MACD dips below zero.
Given the current slope and distance, it's unlikely that a golden cross will form soon. Also, traders should keep in mind that major economic data such as GDP and PCE reports are scheduled later this week, which could influence market direction.
If you can understand the daily chart structure, you can better anticipate intraday high/low ranges and potential wave patterns. Make it a habit to perform thorough daily chart analysis each day, and prepare a trading scenario that suits the market’s behavior. As always, questions are welcome.
Wishing you a successful trading day!
If you like my analysis, please follow me and give it a boost!
For additional strategies for today, check out my profile. Thank you!
Nasdaq market analysis: 24-MAR-2025Good morning! Happy New Week! Happy New Day! Here's your daily Nasdaq market analysis. Learn, grow, and trade wisely.

US100/NASDAQ100/QQQ same thing, failed to reclaim the trendlineSame trendline retest failed on the US100/QQQ after 3 attempts. I suspect lower low will be happening before we bounce.

MASSIVE $QQQ BOUNCE INCOMING!MASSIVE NASDAQ:QQQ BOUNCE INCOMING!🚀
I believe we are setting up for a run to the 200DMA around $494ish🎯
- Wr% is uptrending after breaking out of Bearish WCB
- MACD is uptrending with the histogram rising
- RSI uptrending and broke out of bearish box
- Stochastic uptrending into the sweet spot after
breaking out of bearish box
We keep rejecting off the H5_S by wicking off it, which is bearish, but all other indicator show bullishness...
I could be wrong, but it's what the probabilities of everything and my GUT tell me.
Not financial advice

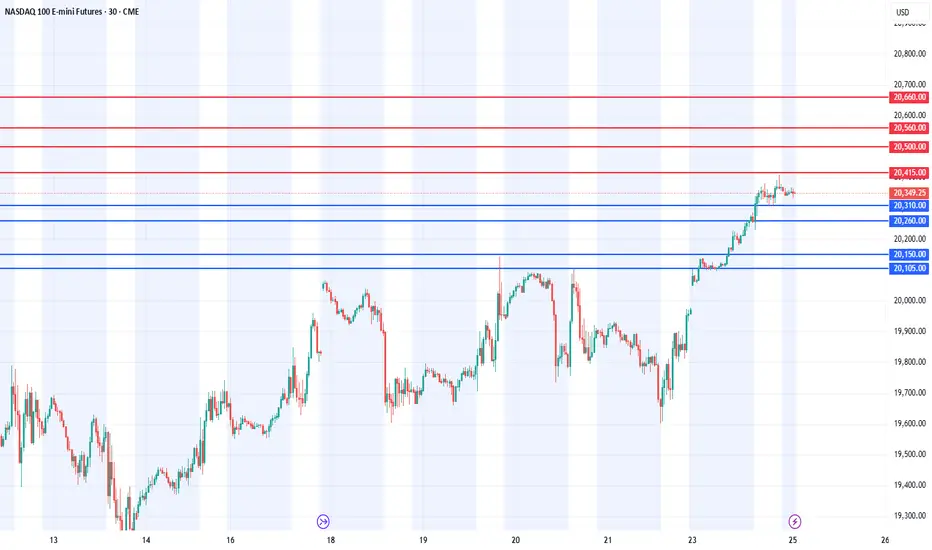
NAS100 Bullish Trend H4 confirms the change of character to bullish. Long here. Turn to bearish if the price is below 19.100.
The next target is 20.400–20.600.
Good luck!

Microsoft (MSFT): The "Can’t Go Wrong" Stock... Until It DoesAh, Microsoft—the tech titan that could probably survive a meteor impact. 🌍☄️ With a market cap so large it could buy entire countries and still have spare change for a few yachts, MSFT is the stock that everyone loves... even when it’s overvalued. But hey, let’s take a look at the "genius" behind the current price action. 🔍💰
📊 The Almighty Stock Performance (Because Fundamentals Don’t Matter Anymore?)
📉 Price: $385.76 (up a whole 0.00584%! Call the champagne guy! 🍾)
📊 Intraday High: $387.88
📉 Intraday Low: $383.27 (because even Microsoft has bad days, right? 😅)
🔮 200-day moving average: $423.98 (oh look, it's trading below that... bearish much? 🐻)
So, let me get this straight. MSFT is 7.80% down year-to-date, but analysts are still screaming “BUY! 🚀.” Sure, because blindly trusting price targets has always worked out well for retail investors. 🤑
💰 Valuation: Overpriced? Who Cares, It’s Microsoft!
📢 Intrinsic Value Estimate: $316.34
😬 Current Price: $385.76
💰 Overvaluation? About 18%
But let’s be honest—does valuation even matter anymore? If people are throwing money at meme coins, why not pay a premium for MSFT? 🤷♂️ It’s basically a subscription service at this point—you pay every month, and the stock just keeps draining your wallet. 💸
🤖 AI Goldmine or Just Another Buzzword?
Microsoft has been riding the AI hype train harder than a teenager with ChatGPT. 🚂💨 Their enterprise AI growth is over 100%, and they’re pulling in a $13 billion annual run rate from AI services. But sure, let’s pretend that no one remembers the last time “the next big thing” crashed and burned. (cough dot-com bubble cough). 💀💾
Evercore analysts claim MSFT will dominate AI for enterprises. Well, duh. If you’re an enterprise and don’t buy Microsoft AI services, Satya Nadella himself might show up at your office and force you to install Windows 11. 🏢💻
📉 Risk Factors? No Way! MSFT is Invincible... Right?
🦅 Hawkish Fed = Potential Market Sell-Off (But don’t worry, just HODL, right? 🤡)
🚀 Tech Bubble Concerns (Microsoft will totally be the exception… like every overhyped stock before it. 😬)
🧐 Overvaluation? Pfft, who cares? (People said the same about Tesla at $400. Look how that turned out. 🪦)
📢 Analyst Hot Takes (Because They’re Always Right 😂)
📊 D.A. Davidson: Upgraded to Buy with a price target of $450. (Ah yes, let’s just throw numbers out there. Why not $500? $600? 🚀)
🔮 UBS: Predicts $3,200 for gold, but Microsoft will somehow go even higher. (Probably. Because… reasons. 🤷♂️)
🎭 Final Thoughts: Buy? Sell? Just Panic?
Microsoft is basically the “safe” tech stock everyone clings to while pretending that the market isn’t built on dreams and overleveraged hedge funds. 🏦💰 If you believe in the power of monopolies, overpriced AI services, and analysts pulling price targets out of thin air, then MSFT is your golden ticket. 🎟️💎
Otherwise, maybe—just maybe—waiting for a dip below fair value isn’t the worst idea in the world. But what do I know? I’m just some guy on the internet. 🤷♂️
🚀💸 Good luck, traders. You’ll need it. 😈📉
💬 What do you think? Drop your thoughts below! 👇🔥

NASDAQ 100: Moon Mission or Reality Check? Ah, the NASDAQ 100—our favorite rollercoaster 🎢 where tech dreams are either made ✨ or brutally crushed 😵💫. Right now, it’s hovering around 19,500, and traders are debating: "Is this the launchpad to new highs or just a dead-cat bounce in disguise?" 🐱💀
Let’s break it down 👇
🚀 The Bullish Hopefuls: "We're Going to Valhalla, Boys!"
✅ Rebound Mode ON 🎯: After a nasty selloff, the market has found some footing and is showing signs of recovery 📈. Maybe the worst is over? (Yeah, sure, we've heard that before... 🙃)
✅ Fed to the Rescue? 🏦: With the FOMC meeting on deck, traders are hoping for some dovish magic dust ✨ to send tech stocks flying again. Because why rely on solid fundamentals when you have the Fed, right? 🤡
😨 The Bearish Doom-Sayers: "Brace for Impact!"
❌ Big Tech = Too Crowded 🚶♂️🚶♂️🚶♂️🚶♂️: Asset managers are side-eyeing Big Tech, calling it "overcrowded" 🙄. Translation? Expect a nasty rug pull soon.
❌ Healthy Correction... or the Start of Something Worse? 🚑: The S&P 500 dropped 10%, the NASDAQ fell 11%, and Treasury Secretary Scott Bessent is calling it a "healthy correction" 🤡. Yeah, just like how falling down the stairs is a “healthy adjustment” for your spine.
🤔 The Fence-Sitters: "We're Just Watching the Chaos 🍿"
🔮 Multiple Futures Await 🔮: Analysts are juggling four possible scenarios for the NASDAQ—ranging from "moon mission" 🚀 to "welcome to the abyss" 🕳️. Basically, flip a coin.
So... Where Are We Headed? 🤷♂️
Are we strapping in for another ride to the stratosphere 🚀, or is this just a perfectly orchestrated bull trap 🐂🔫? Either way, buckle up, folks—volatility is the only guarantee 🎢😵💫.
💬 What do you think? Drop your thoughts below! 👇🔥
(Disclaimer: This isn't financial advice. Do your own research before yeeting into the market. 🚀📉)

Nasdaq insights: 19-MAR-2025Good morning, traders! As a seasoned price action trader, I'll share my Nasdaq insights to help you improve your trading skills.

D-Wave Quantum (QBTS): Seeking New All-Time Highs!
Stocks such as Rigetti Computing Inc., Quantum Computing Inc., D-Wave Quantum Inc., and IonQ Inc. have all seen triple-digit gains over the past six months and over the past year. The exchange-traded fund that tracks these stocks, the Defiance Quantum ETF, increased 26.29% over the past six months and 53.69% over the past year. Specifically, D-Wave Quantum Inc. (NYSE: QBTS) increased 405.22% over the past six months and 718.31% over the past year.
Since these quantum computing companies are still in their growth phase and currently have negative earnings, it is not possible to use the price-earnings ratio to estimate their valuation. However, the price-to-sales ratio, which is found by dividing a company's market capitalization by its total sales, can be used to value these companies.
According to Bloomberg data, QBTS's P/S ratio is 104.63.
---> What is the company's technical outlook?
Looking at the table, the company is CLEARLY BULLISH on its main timeframes. Today, it stopped right at a VERY IMPORTANT RESISTANCE level located at 11.97, which also coincided with the day's PIVOT POINT R2.
If it breaks above the 12 level, it would directly test the 13.26 level, its all-time high reached on August 8, 2022.
--> What risks do we face?
The biggest risks observed are:
1) Bad news that may come out about the company or its sector (quantum computing).
2) The high appreciation they have experienced over the last year.
3) That today it reached its first major resistance to overcome and could begin a pullback to attack the zone again.
--> What happens if it starts to pull back?
I've drawn the Fibonacci retracements on the chart to give us an idea of the areas the price could fall to if it were to start a pullback, but as long as it doesn't lose the 7 zone, its upward trend will remain intact.
Best regards and good trading to all.
----------------------------------------------------------------------
**** The small chart above is the WEEKLY timeframe to get a global view of the price.
----------------------------------------------------------------------

Nasdaq 100 key levels to watch as index tries to extend recoveryMarkets have been grappling to establish a definitive bottom in recent sessions, before finally the bulls showed up on Friday to stage a strong rebound from oversold levels. Could the Nasdaq 100 now be poised for a more substantial recovery?
After Friday’s recovery, the big question now is whether we are witnessing the early stages of another rally or just a pause before deeper losses.
Last week, the Nasdaq 100 found some footing in the 19,115-19,240 zone, which coincides with a prior support/resistance region and the 61.8% Fibonacci retracement of the August rally. With the daily RSI firmly entrenched in oversold territory, the index was able to find dip buyers yet again.
The key technical factor to watch today is to see whether the index will show follow-through after Friday’s sharp recovery. A positive close would further erode the bears’ control, while a negative close would suggest there is more selling to come.
A few nearby resistance barriers are in focus now. The first of these hurdles is at 19,735—the low from Friday that was breached in Monday’s sharp sell-off. This level also marks the underside of a broken trendline stretching back to January 2023. A decisive break above this area could open the door to additional upside, targeting psychological resistance at 20,000, followed by the 200-day moving average near 20,340. Should dip buyers regain control, these levels could soon come into focus.
On the flip side, if renewed selling pressure emerges, downside targets include 18,800 and potentially the 78.6% Fibonacci retracement near 18,310.
Taking everything into account, my Nasdaq 100 forecast has shifted. Where I previously leaned towards further correction—now largely realised—I am now inclined to anticipate a recovery.
By Fawad Razaqzada, market analyst with FOREX.com

Breaking: $SAIC Surged 6% In Premarket Amidst Q4 ReportsScience Applications International Corporation (NASDAQ: NASDAQ:SAIC ) surged 6% in premarket trading on Monday amidst Fourth Quarter and Full Fiscal Year 2025 Results.
Fourth Quarter Earnings Highlights
Q4 FY25 revenues of $1.84 billion, 5.8% organic growth(1); FY25 revenues of $7.48 billion, 3.1% organic growth(1); organic growth adjusted for divestitures
Q4 FY25 net income of $98 million, adjusted EBITDA(1) of $177 million or 9.6% of revenue; FY25 net income of $362 million, adjusted EBITDA(1) of $710 million or 9.5% of revenue.
Q4 FY25 diluted earnings per share of $2.00, adjusted diluted earnings per share(1) of $2.57; FY25 diluted earnings per share of $7.17, adjusted diluted earnings per share(1) of $9.13.
Q4 FY25 cash flows provided by operating activities of $115 million, free cash flow(1) and transaction-adjusted free cash flow(1) of $236 million; FY25 cash flows provided by operating activities of $494 million, free cash flow(1) of $499 million, transaction-adjusted free cash flow(1) of $507 million.
Q4 FY25 net bookings of $1.3 billion; book-to-bill ratio of 0.7; trailing twelve months book-to-bill ratio of 0.9
FY26 guidance introduced above prior targets for revenues, adjusted EBITDA(1), adjusted EBITDA margin(1), and adjusted diluted EPS(1).
Technical Outlook
As of the time of writing, NASDAQ:SAIC stock is up 6% in Monday's premarket trading, with the asset closing Friday's session with an RSI of 47 giving the stock more room to capitalize on this medium momentum to surge to new highs and possibly break the 1-month high pivot.

Nas100 buy anticipation Yo! It's a new week. I'm assuming this week is going to be bullish. Let's see what price is going to do.
ToWhomItMayConcern 🫴

Nasdaq market analysis: 17-MAR-2025Good morning! Happy New Week! Happy New Day! Here's your daily Nasdaq market analysis. Learn, grow, and trade wisely.

TESLA: Is there light at the end of the tunnel? Attention!As we've all seen in recent weeks, the markets have taken a huge hit due to Mr. Trump's tariff policy, but if we have to single out any company in particular, it's undoubtedly TESLA. TESLA has clearly suffered a BOYCOTT as punishment for the tariffs. The punishment is so severe that it has already come to light that ELON MUSK HAS PRESSURED TRUMP on the tariff issue because they are seriously affecting his companies, TESLA and SPACEX.
--> Will ELON MUSK be able to convince Trump that he's not on the right path?
I think so, because Trump himself isn't interested in watching the American market continue to fall while Europe continues to skyrocket. Therefore, it's VERY PROBABLE that we'll start to see positive messages for the American market coming directly from the White House.
--> And TESLA? What is the company's technical outlook?
To analyze the company, we will use the H1 chart and the SUMMARY TABLE above. I have also added the Daily chart to get a general overview of its situation. If we analyze the table, we see the following:
1) Weekly: BULLISH (losing strength), meaning its trend remains BULLISH despite its declines, but it is losing strength.
2) Daily: NEUTRAL. The trend is NOT DEFINED on the daily chart, and therefore, we must look at another timeframe to be able to predict whether it will turn bullish or bearish at some point.
3) H4: BEARISH (losing strength). Its trend is BEARISH, but it is LOSING STRENGTH, meaning it is beginning to gain bullish momentum.
4) H1: BEARISH (retracement). The trend on H1 is DOWNWARD, but it's in a RECOVERY PHASE; it's RISING, as can be seen on the chart that has marked the BULL signal.
Therefore, looking at the H1 chart, let's see what key areas we need to monitor to know when to go long or short at some point.
1) On the downside, 200 is a very important support that SHOULD NOT BE LOST, because if it does, the fall could be much greater.
2) And on the upside, we have the 262 and 303 zones. If it clearly breaks through this last zone, it would be the START of a TREND CHANGE on the H1 TIME FRAME and therefore could be a good entry point, considering it could reach the year's highs again.
In short, we are still in a bullish trend in the long term and a bearish trend in the short term, BUT the H1 chart is starting to gain BULLISH STRENGTH. We'll be on the lookout for a possible long entry when the H1 chart shows an uptrend again. And ALL with TRUMP's permission!!!
Best regards and good luck in the markets!!

NASDAQ about to nuke?In my previous ideas and posts i told you about #nasdaq chart structure' s weaknesses. Well, it has already made the extended rally and the time has likely come.
In lower time frame, nasdaq, spx and dji already started dumps and broke the local supports.
In monthly candle stick size, i mean higher time frame, #nasdaq100 chart:
- Formed a huge bearish divergence
- Stoch RSI made bearish triple top
- MACD is warning about the trend reversal (Bullish to bearish)
The strong support zones in HTF are:
Monthly EMA Ribbon at 15000
Monthly İchimoku Cloud bottom at 12000
The stronghold the historical trendline support at 6000.
This strategy is NOT a SHORT TERM strategy and NOT FINANCIAL ADVICE. Dyor.
Just avoid being over greedy.

Appetite For Risk Through the Lens of Nasdaq and BitcoinBitcoin tends to track Wall Street sentiment well, particularly compared to the Nasdaq. Growing concerns that Trump's policies will tip the US (and therefore the global economy) into a recession, which currently has the Nasdaq on the ropes and bitcoin getting dragged along for the ride. And there could be further losses to follow, though a cheeky bounce at a minimum could be due first.
Matt Simpson, Market Analyst and City Index and Forex.com

META: Key support! Watch out for a possible opportunity!For a few weeks now we have been experiencing PANIC in the markets due to Trump's AGGRESSION with tariffs. The question we all have to ask ourselves is whether the USA will enter a RECESSION and ALL COMPANIES will continue to fall sharply, or on the contrary, if Trump will negotiate and therefore the markets will RECOVER.
From my point of view, TRUMP has become too aggressive and IS ALREADY STARTING TO WORRY ABOUT SOME COMMENTS OF THE LAST FEW DAYS, and HE WILL NEGOTIATE!! Regardless of this, there are companies that despite the great fall suffered, REMAIN BULLISH AND POSITIVE in the year, as is the case of META, which has risen by +2% in 2025.
The graph above SHOWS YEAR BY YEAR the trend and WHEN a CHANGE IN TREND occurs, in this way we will see more clearly the current situation of the company this year. In the graph below with H4 time frame we see a ZOOM of the current situation to know more precisely when a floor is formed and the retreat phase in which it is immersed ends.
If we look at this year 2025, its TREND is still BULLISH in a RECOIL PHASE and at this moment it is in A VERY IMPORTANT SUPPORT that it should respect (zone 580) in order NOT TO START A CHANGE IN TREND.
If the zone respects it and a BOTTOM is formed, the price will quickly rise towards its first resistance at 641, which if it is surpassed WE WILL SEE NEW MAXIMUMS in the value.
---> What do we do?
1) If our PROFILE is AGGRESSIVE, we enter LONG IN THE CURRENT ZONE.
2) If our PROFILE is CONSERVATIVE, WE WAIT for a floor to form or for the price to surpass the 641 zone.
-------------------------------------
Strategy to follow IF OUR PROFILE IS AGGRESSIVE:
ENTRY: We will open 2 long positions in the current zone of 610
POSITION 1 (TP1): We close the first position in the 640 zone (+5.5%)
--> Stop Loss at 568 (-6%).
POSITION 2 (TP2): We open a Trailing Stop type position.
--> Initial dynamic Stop Loss at (-6%) (coinciding with the 568 of position 1).
---We modify the dynamic Stop Loss to (-1%) when the price reaches TP1 (640).
-------------------------------------------
SET UP EXPLANATIONS
*** How do we know which 2 long positions to open? Let's take an example: If we want to invest 2,000 euros in the stock, what we do is divide that amount by 2, and instead of opening 1 position of 2,000, we will open 2 positions of 1,000 each.
*** What is a Trailing Stop? A Trailing Stop allows a trade to continue gaining value when the market price moves in a favorable direction, but automatically closes the trade if the market price suddenly moves in an unfavorable direction by a certain distance. That certain distance is the dynamic Stop Loss.
-->Example: If the dynamic Stop Loss is at -1%, it means that if the price drops by -1%, the position will be closed. If the price rises, the Stop Loss also rises to maintain that -1% during increases, therefore, the risk is increasingly lower until the position becomes profitable. In this way, very solid and stable price trends can be taken advantage of.

18 Times, +2000%, 5800 Days - All About NASDAQ100 Corrections!Hi, all!
I need to repost some of my recent ideas on TradingView due to issues with the platform's moderation. Let's start! The most up-to-date post is coming right away - one that serves as a timely reminder during these interesting times: never forget history.
From November 2008 to February 2025, the Nasdaq 100 (NDX) index has grown by over 2000%! Yes, that’s a 20x increase! This tech giant, made up of the 100 leading technology stocks, has shown impressive strength.
For comparison, the S&P 500 has risen about 820% in the same period. A great performance but Nasdaq 100 leaves it far behind.
Has this been a straight-line rise? Not really. Looking back, it may seem like the perfect investment. But the road was not smooth. Nasdaq 100’s success came with painful drops, investor panic, and moments when it felt like the market would never recover.
From the outside, everything looks great. But would you sit through a 30% drop, while the news is screaming about the "end of the world"?
So, I decided to analyze every correction of 10% or more since the market bottom in 2008.
- How long do corrections and recoveries last?
- How often do they happen?
- What should investors know?
- Can this help you in any way?
DATA ANALYSIS - 18 corrections in Nasdaq 100 (2008–2025), -10% or more.
Retracement Stats:
- Average drop: -15%
- Median drop: -13%
- Biggest drop: -37.72%
- Smallest drop: -10%
Correction Length (17 completed corrections): How many days does a correction last from the peak to the bottom?
- Average: 60 days
- Median: 35 days
- Longest: 325 days
- Shortest: 14 days
Recovery Time: From bottom back to new highs.
- Average: 165 days (~5.5 months)
- Median: 119 days (~4 months)
- Longest: 752 days (over 2 years)
- Shortest: 42 days (~1.5 months)
Correction Frequency
If we take a rough estimate, in 5800 days, there were 18 corrections, which means a correction happens every 322 days (~10.5 months) on average.
Total Time Spent in Corrections vs. Rising Markets
- Corrections lasted 1016 days
- Recoveries lasted 2801 days
- Total time spent in "work mode": 3817 days
- Total "smooth uptrend" days: 1983 days (~5.4 years)
Basically, like a hardworking employee – the market spends more time struggling than rising!
What Can Investors Learn from This?
1. Accept Volatility
Knowing that market swings are normal, investors can keep a long-term perspective and avoid panic-selling during downturns.
2. Nasdaq 100 Has Always Recovered
In the long run, Nasdaq 100 has always bounced back to new highs. Each recovery has been different, but so far, making new all-time highs has never been a problem.
3. Make Better Decisions
Understanding psychological biases helps investors make rational choices and manage risks better.
4. Market Drops = Opportunities, Not Threats
Most big market rallies started when most investors were too scared to buy.
"A simple rule dictates my buying: Be fearful when others are greedy, and be greedy when others are fearful." – Warren Buffett
Market drops always feel unique and scary but history shows they follow repeating patterns. And those who keep their emotions in check have the best opportunities.
"The time to buy is when there's blood in the streets." – Baron Rothschild
Final Thoughts: Is the current retracement a buying opportunity? No one knows for sure but history suggests - stay calm!
So, that's all. Like & Boost if you find this useful! 🚀
Have great day,
Vaido
💬 Before you leave... What’s your take on the current Nasdaq 100 correction? Drop your thoughts in the comments 👇
Nasdaq 100 Enters CorrectionNasdaq 100 Enters Correction
As shown on the Nasdaq 100 (US Tech 100 mini on FXOpen) index chart today:
→ The index has fallen below the psychological 20,000-point level, reaching its lowest in approximately six months.
→ The decline from the December peak now exceeds 10%, officially marking the start of a correction.
Why the Nasdaq 100 Is Falling Today
Bearish sentiment stems from a combination of factors, including (according to Zacks analysts):
→ The Trump administration’s tariff policies and their potential economic impact. Concerns increased after the latest jobs report showed unemployment rising from 4.0% to 4.1%.
→ Worries about AI investment costs and their long-term profitability.
→ Market anticipation of tomorrow’s Consumer Price Index (CPI) release at 15:30 GMT+3.
Technical Analysis of the Nasdaq 100 Chart
Price movements indicate that the steeper growth channel (marked in black), which had been in place since last August, has lost relevance. A broader view of the chart reveals that the index has now approached the lower boundary of a long-term channel (marked in blue), which has been forming since early 2024. Key price formations that helped define this channel are highlighted in orange.
Given that the index is at the lower boundary of the blue channel and the RSI indicator on the daily chart has dropped to multi-year lows, a short-term recovery may be likely. However, the fundamental backdrop will play a decisive role—clear signs of U.S. economic stability could support a rebound, while extreme fear (as reflected in CNN’s Fear & Greed Index) may continue to weigh on sentiment.
This article represents the opinion of the Companies operating under the FXOpen brand only. It is not to be construed as an offer, solicitation, or recommendation with respect to products and services provided by the Companies operating under the FXOpen brand, nor is it to be considered financial advice.

$NAS100 may settle around 17300 @ 0.382 Fib Retracement PEPPERSTONE:NAS100 is already in the correction territory with down more than 10%. If this bear market holds grip, then we might get into the bear market territory with 20% or more correction. This might be coincidental. Let’s get to the numbers behind this reasoning.
The lows on Aug 5th carry trade set back was 17300.
The Trump 1.0 tariff also send the PEPPERSTONE:NAS100 down by 23% before the market started a meaningful bounce. If we have a 23% drawdown from the top of PEPPERSTONE:NAS100 then we will be back @ 17300.
If you plot the upward sloping Fib retracement levels on PEPPERSTONE:NAS100 which we discussed in this blog on 01 March when I sounded bearish predicting a 10% downturn in the near term. Link here. The 0.382 Fib retracement level in this long term upward sloping channel lies around 17300.
Tell me coincidence but all these 3 indicators align at 17300. Will the PEPPERSTONE:NAS100 settle at 17300 before this bear market correction is done and dusted? No one knows.
Buy PEPPERSTONE:NAS100 from here till 17300.

NASDAQ 100 Elliott Wave Analysis – A High-Probability Setup in P📌 Is the NASDAQ 100 in a Bearish Impulse Wave?
Based on Elliott Wave analysis, NASDAQ 100 appears to be in Wave 3 of an ongoing bearish impulse (Wave A or 1). This setup suggests that after the current downward move, we might see a corrective structure before another leg down.
Key Insights:
🔹 Wave Structure: The first wave of this move was a leading diagonal, followed by a pullback. Now, we are likely in Wave 3, which could extend further before a corrective phase begins.
🔹 Retracement Zones: After Wave 3 completes, we expect a corrective structure (Wave 4), which typically retraces between 38.2% and 50% of Wave 3 before Wave 5 resumes.
🔹 Trading Strategy: The most favorable entry zone would be during Wave 5 of A (or 1), ideally in lower timeframes such as H1, H4, or even M15. Before entering a trade, we need to confirm a three-wave corrective structure—whether it forms a sideways correction or a complex zigzag.
📌 Critical Levels to Watch:
A break into Wave 1 territory could invalidate the impulse structure and shift the outlook.
If the corrective phase is shallow, a deeper drop may still be on the table.
🚀 Patience is key! Once the correction completes, the next move could offer a strong trading opportunity.
#NASDAQ100 #ElliottWave #StockMarket #TradingSetup #BearishImpulse
💬 What’s your take? Are we heading lower, or will the market surprise us?
