$NQ CorrectionPrice clearly is going towards Sellside Liquidity.
The standard deviation shows -2 to -2.5 is where price would reverse from and its also aligned with Sellside liquidity.
Idea: Bearish.
Nasdaqidea

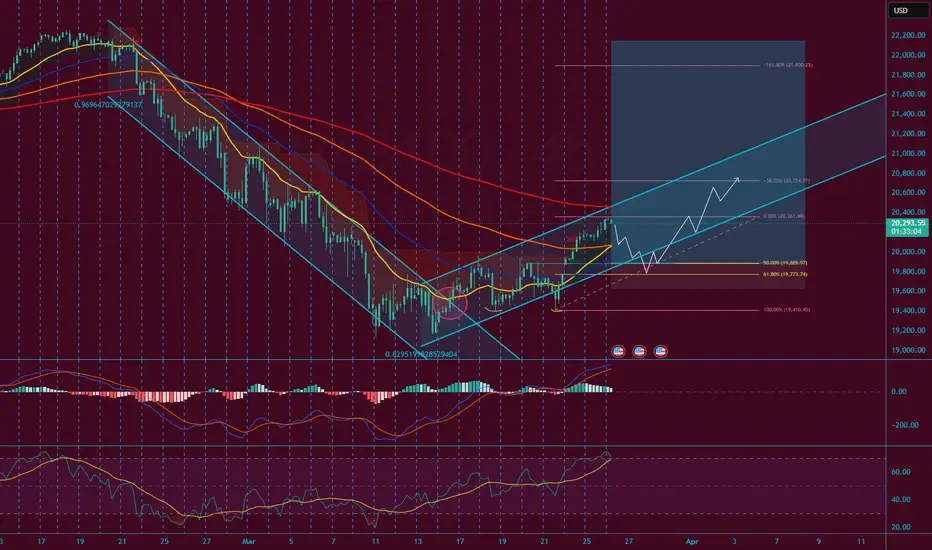
My NQ Long Idea 26/03/2025There is a big technical area that has taken the spotlight in NQ and it is around the 50% fib level with a gap opening.
US economy has seen some strengthening recently with the FED looking neutral-dovish. A price correction may not even occur here it can keep going up continuously the moment we have a conclusive risk-on environment.
Inflation has cooled down from 3.0 to 2.8 and interest rate was held at 4.50 from 4.50.
We are expecting a rate cut of 0.25 bps by Q2 so the market is looking forward to price that in.
I see a potential "buy the rumor" then "sell the news" scenario here. So during the next fomc meeting we may get a small sell off for a price correction then NQ will continue its up momentum.
Technical setup looks good I expect a turbulent price action which will fill the opening gap at the 50% a consolidation here can be healthy for price action before we get a Wyckoff spring.
We have recently exited a bearish channel and entered a new bullish channel which is still in progress but must pay attention to it as we could start trending in that direction.
I may take a short position (for the short term) since I anticipate a correction to the gap at the 50%.
Tuesday's NQ Trade idea 3.25.25 first trade of the day. SL was hit at $160 profit. We disrespected the bearish FVG level.
Let's see what happens next.
Forex, Crypto and Futures Trading Risk Disclosure:
The National Futures Association (NFA) and Commodity Futures Trading Commission (CFTC), the regulatory agencies for the forex and futures markets in the United States, require that customers be informed about potential risks in trading these markets. If you do not fully understand the risks, please seek advice from an independent financial advisor before engaging in trading.
Trading forex and futures on margin carries a high level of risk and may not be suitable for all investors. The high degree of leverage can work against you as well as for you. Before deciding to trade, you should carefully consider your investment objectives, level of experience, and risk appetite.
There is a possibility of losing some or all of your initial investment, and therefore, you should not invest money that you cannot afford to lose. Be aware of the risks associated with leveraged trading and seek professional advice if necessary.
BDRipTrades Market Opinions (also applies to BDelCiel and Aligned & Wealthy LLC):
Any opinions, news, research, analysis, prices, or other information contained in my content (including live streams, videos, and posts) are provided as general market commentary only and do not constitute investment advice. BDRipTrades, BDelCiel, and Aligned & Wealthy LLC will not accept liability for any loss or damage, including but not limited to, any loss of profit, which may arise directly or indirectly from the use of or reliance on such information.
Accuracy of Information: The content I provide is subject to change at any time without notice and is intended solely for educational and informational purposes. While I strive for accuracy, I do not guarantee the completeness or reliability of any information. I am not responsible for any losses incurred due to reliance on any information shared through my platforms.
Government-Required Risk Disclaimer and Disclosure Statement:
CFTC RULE 4.41 - HYPOTHETICAL OR SIMULATED PERFORMANCE RESULTS HAVE CERTAIN LIMITATIONS. UNLIKE AN ACTUAL PERFORMANCE RECORD, SIMULATED RESULTS DO NOT REPRESENT ACTUAL TRADING. ALSO, SINCE THE TRADES HAVE NOT BEEN EXECUTED, THE RESULTS MAY HAVE UNDER-OR-OVER COMPENSATED FOR THE IMPACT, IF ANY, OF CERTAIN MARKET FACTORS, SUCH AS LACK OF LIQUIDITY. SIMULATED TRADING PROGRAMS IN GENERAL ARE ALSO SUBJECT TO THE FACT THAT THEY ARE DESIGNED WITH THE BENEFIT OF HINDSIGHT. NO REPRESENTATION IS BEING MADE THAT ANY ACCOUNT WILL OR IS LIKELY TO ACHIEVE PROFIT OR LOSSES SIMILAR TO THOSE SHOWN.
Performance results discussed in my content are hypothetical and subject to limitations. There are frequently sharp differences between hypothetical performance results and the actual results subsequently achieved by any particular trading strategy. One of the limitations of hypothetical trading results is that they do not account for real-world financial risk.
Furthermore, past performance of any trading system or strategy does not guarantee future results.
General Trading Disclaimer:
Trading in futures, forex, and other leveraged products involves substantial risk and is not appropriate for all investors.
Do not trade with money you cannot afford to lose.
I do not provide buy/sell signals, financial advice, or investment recommendations.
Any decisions you make based on my content are solely your responsibility.
By engaging with my content, including live streams, videos, educational materials, and any communication through my platforms, you acknowledge and accept that all trading decisions you make are at your own risk. BDRipTrades, BDelCiel, and Aligned & Wealthy LLC cannot and will not be held responsible for any trading losses you may incur.

Bull Trap Confirmed: HOOD's 8% Rally Faces ExhaustionHey Traders after the success of our last month trade on Tesla hitting all targets more than 35%+
With a Similar Trade setup I bring you today the NASDAQ:HOOD
Short opportunity on Hood
Based on Technical + Fundamental View
-Market structure
-Head and shoulder pattern
-Currently will be trading at supply zone which was a recent support and now an ideal place for a reversal to create the right shoulder of the bigger head and shoulder pattern - Daily time frame.
1. Declining User Growth and Transaction-Based Revenue
2. Regulatory and Legal Challenges
3. Rising Costs and Profitability Pressures
4. Intense Industry Competition
5. Macroeconomic and Market Volatility
Technical View
Head and shoulder pattern - Pretty visible. Right shoulder is yet to be formed, Which makes an ideal place to SELL with a great Risk Reward ratio.
Pro Tip
Wait for a bearish candle stick pattern to execute trades on end of the day keeping stop loss somewhere above the supply zone.
Target 1 - 35.52$
Target 2 - 30.81$
Target 3 - 26.26$
Stop Loss - 44.72$
Fundamental View
1. Declining User Growth and Transaction-Based Revenue
Robinhood’s revenue model relies heavily on Payment for Order Flow (PFOF), which makes it vulnerable to fluctuations in trading activity. After a pandemic-driven surge in 2020–2021, user growth stalled, with monthly active users dropping 34% YoY to 14 million by mid-2022. Transaction revenue fell 55% in Q2 2022, and while assets under custody grew to $140 billion by Q2 2024, the platform’s dependence on volatile crypto and meme-stock trading amplified revenue instability.
2. Regulatory and Legal Challenges
The SEC’s scrutiny of PFOF and proposed trading rule changes threaten Robinhood’s core revenue source. In 2022, New York regulators fined Robinhood’s crypto unit $30 million for anti-money laundering violations. Ongoing legal risks, including backlash from the 2021 GameStop trading restrictions, have further eroded institutional trust.
3. Rising Costs and Profitability Pressures
Operating expenses surged due to aggressive marketing, technology upgrades, and compliance investments. Despite workforce reductions (23% layoffs in 2022), profitability remains strained. The company’s shift toward diversified products like retirement accounts and credit cards has yet to offset these costs.
4. Intense Industry Competition
Traditional brokers like Fidelity and Charles Schwab adopted zero-commission trading, neutralizing Robinhood’s initial edge. Newer platforms like Webull and Public.com also captured younger investors with advanced features, while Robinhood’s limited product range (e.g., lack of wealth management services) hindered retention of high-net-worth clients.
5. Macroeconomic and Market Volatility
- Interest Rate Sensitivity: As a growth stock, HOOD declined amid rising rates in 2022–2023 and broader tech-sector sell-offs.
- Recent Market Turmoil: On March 10, 2025, HOOD dropped 18% alongside crypto-linked stocks like Coinbase due to Bitcoin’s price volatility and fears of inflationary tariffs under new U.S. policies.
- Retail Investor Pullback: Reduced discretionary investing and crypto crashes (e.g., Bitcoin’s 71% plunge in 2022) dampened trading activity.
NOT AN INVESTMENT ADVISE

Nasdaq analysis: 25-MAR-2025Good morning, trading community! Today's Nasdaq analysis is for you. Share your thoughts, ask questions, and let me help you grow.

Nasdaq analysis: 21-MAR-2025Good morning, traders! Today's Nasdaq analysis will help you achieve your trading goals. Let's work together towards success.

Nasdaq insights: 19-MAR-2025Good morning, traders! As a seasoned price action trader, I'll share my Nasdaq insights to help you improve your trading skills.

Nasdaq analysis: 18-Mar-2025Good morning, trading community! Today's Nasdaq analysis is for you. Share your thoughts, ask questions, and let me help you grow.

Nasdaq market analysis: 17-MAR-2025Good morning! Happy New Week! Happy New Day! Here's your daily Nasdaq market analysis. Learn, grow, and trade wisely.

US100 Short From Resistance!
HI,Traders !
US100 has retested a
A horizontal resistance
Of 20669.2 from where
A bearish reaction can be
Observed already and so
We will be expecting a
Further bearish correction !
Comment and subscribe to help us grow !

NASDAQ100Hello friends
Our ascending channel had a strong break and considering the negative news, how far do you think the decline will continue?
The support levels identified can help you trade, but we need to see where the price will go with the news that will be announced this week...
*Trade safely with us*

Nasdaq 100 Drops More Than 4.0% Amid Market UncertaintyThe Nasdaq 100 index has already accumulated a loss of over 4.0% during today’s session and has declined more than 12% since its peak on February 18. The strong bearish movement remains intact as the market anticipates that the new 25% tariffs imposed on countries like Mexico and Canada could begin affecting production costs for U.S. companies. In the long run, this may lead to a low-return environment that could be unfavorable for the index.
Additionally, companies such as Amazon, Nvidia, and Microsoft have seen declines between 3% and 5% in recent sessions, reinforcing the bearish pressure on the Nasdaq due to their heavy weighting within the index.
Momentum Accelerates
With the strong downward bias currently present in the chart, selling pressure has been able to break through the support level at 19,700 points. However, the rapid price acceleration is beginning to have a significant impact, which could lead to short-term bullish corrections.
Oversold Indicators
Bollinger Bands: The bearish momentum has broken below the lower Bollinger Band, which could indicate a high acceleration in recent price movements.
RSI (Relative Strength Index): The RSI line continues to decline below the oversold level of 30, suggesting an imbalance between buying and selling forces.
MACD (Moving Average Convergence Divergence): The MACD histogram has dropped to levels not seen since July 2024, indicating a persistent downward acceleration without giving buyers an opportunity to regain control.
The alignment of these indicators suggests a significant acceleration of the bearish trend, which may lead to a standardization of bullish corrections in the short term.
Key Levels:
18,800 points – Near-Term Support: This level corresponds to lows not seen since September 2024. Persistent trading below this level could further accelerate the strong downward bias currently present in the chart.
19,700 points – New Resistance Zone: This level aligns with the lower Bollinger Band, which may serve as the area where potential bullish corrections could take place in the short term.
20,500 points – Distant Resistance: A neutral zone that has been tested by price movements in recent months. A sustained rally back to this level could challenge the current bearish sentiment prevailing in the market.
By Julian Pineda, CFA – Market Analyst

Tesla I Tipping Point: Short Opportunity with Head & Shoulders Short opportunity on Tesla
Based on Technical + Fundamental View
-market structure
-Head and shoulder pattern
-Double top
-Currently trading at supply zone which was a recent support and now an ideal place for a reversal to create the right shoulder of the bigger head and shoulder pattern - Daily time frame
-Product Development Delays
-Margin Pressure
-Decreased average selling price
- Increased Competition
- Flat /Declining Sales
- Leadership Concerns: Elon Musk's polarizing political activities and his divided attention between Tesla and other ventures (such as his involvement with OpenAI) have raised concerns among investors. Some analysts suggest that Musk's public perception may negatively impact consumer sentiment towards Tesla, leading to decreased sales and loyalty among customers.
Technical view
Double top
Unlike the classic double top, where the second peak reaches or exceeds the height of the first peak, the Type III double top fails to reach the previous high. This failure signifies a significant shift in market sentiment and an increase in selling pressure than usal.
Head and shoulder pattern - Pretty visible. Right shoulder is yet to be formed, Which makes an ideal place to SELL with a Risk Reward ratio. (Approx 1:6.4)
Pro Tip
Wait for a bearish candle stick pattern to execute trades on end of the day keeping stop loss somewhere above the supply zone.
Target 1 - 307$
Target 2 - 271$
Target 3 - 237$
Stop Loss - 380.21$
Fundamental View
Valuation Concerns: Tesla's stock is currently viewed as significantly overvalued, with a fair value estimate of $210 per share according to multiple analysts, including Morningstar and Firstrade. This valuation reflects a substantial premium over its current trading price, indicating potential downside risk for investors.
Earnings Performance: Tesla's Q4 2024 earnings are anticipated to show continued improvement, with expectations of gross profit margins exceeding 20%. Analysts believe that the automotive segment's performance has stabilized after a challenging first half of the year, driven by increased deliveries and lower production costs.
Market Dynamics: Despite strong demand for Tesla's vehicles, the company faces pressures from declining average selling prices due to price cuts implemented in 2023. This trend is expected to continue as competition intensifies in the electric vehicle (EV) market.
Product Development: Tesla is set to launch new models, including an affordable SUV (Model Q) aimed at increasing market share in the lower-priced vehicle segment. Additionally, advancements in autonomous driving technology are critical for future growth, with plans to roll out Level 3 Full Self-Driving software in select states and regions.
Analyst Ratings: The consensus among analysts remains mixed, with a combination of "buy," "hold," and "sell" ratings. The average price target reflects a cautious outlook, suggesting that while there is potential for upside, significant risks remain due to valuation concerns and competitive pressures.
Not an investment Advise

Nasdaq market analysis: 10-Mar-2025Good morning! Happy New Week! Happy New Day ! Here's your daily Nasdaq market analysis. Learn, grow, and trade wisely.

My NAS Long Idea 3/10/2025Stocks are very bearish but I think this is a "buy the news" situation since we are having FOMC next week and their decision on interest rate. We are at the 200 MA on the daily but my theory here is we will have some very small correction(s).

Nasdaq market analysis: 07-MAR-2025Let’s dive into today's Nasdaq market analysis. Share insights, and potentially spot opportunities for good pips.

Nasdaq analysis: 06-MAR-2025Good morning, everyone! Today's Nasdaq analysis is designed to educate and empower. Use these insights to refine your price action trading strategy.

NQ - Daily still looks bearishZones of interest - false flags on trendlines. THE purple zone.
Study areas for pre- open analysis.
Targets still valid below. Bearish until proven otherwise.

Nasdaq market analysis: 04-Mar-2025Good morning, traders! Welcome to today's Nasdaq market analysis. Compare my price action insights with your own charts and enhance your trading skills.

Breakout in ADT Inc...Chart is self explanatory. Levels of breakout, possible up-moves (where stock may find resistances) and support (close below which, setup will be invalidated) are clearly defined.
Disclaimer: This is for demonstration and educational purpose only. This is not buying or selling recommendations. Please consult your financial advisor before taking any trade.

Nasdaq market analysis: 26-Feb-2025Good morning! Here's your daily Nasdaq market analysis. Learn, grow, and trade wisely.

Nasdaq analysis: 21-Feb-2025Good morning, everyone! Today's Nasdaq analysis is designed to educate and empower. Use these insights to refine your price action trading strategy.

My NAS Long Scalp IdeaUS stocks and indices are very neutral recently. I however remain slightly bullish and found a small setup. This is pure price action bias but including the fundamental view we are in a neutral state as we are waiting for upcoming economic news. This week has been neutral due to the lack of news. We got a bunch of Trump speech but nothing more.
This idea is meant for short term It could completely reverse on me so do your own research and trade safely.
