NAS100/USDthere were a lot of news and (Nasdaq/us100) has 2 scenarios ether it would start a rest now at the first zone if it got rejected or at the second zone it depends on the news of this week to do your own research and trade safe .
Nasdaqshort


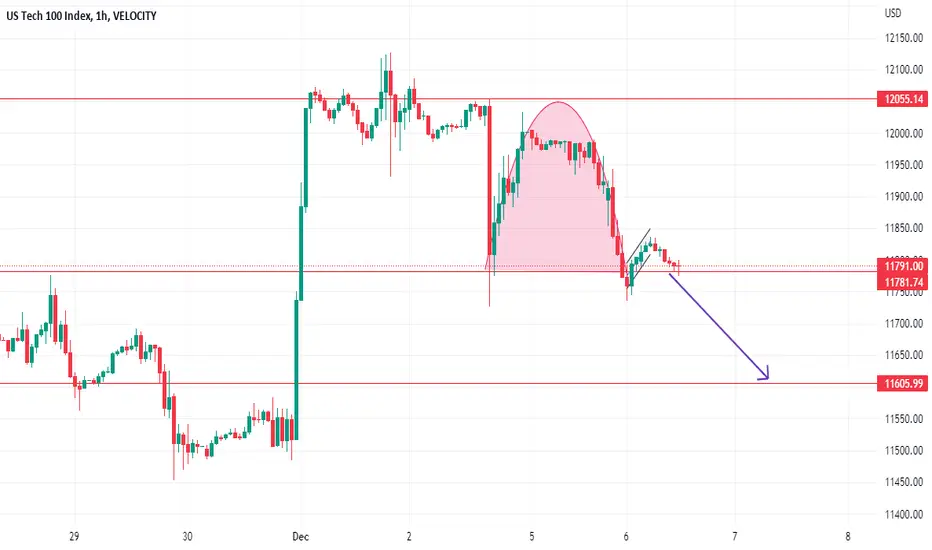
Nasdaq Forming a Bearish pattern . Take a Sell ride Nasdaq making inverted cup and handle formation and after completing its handle retracement it is going down with the major support area of 11605.
Stop loss area should be the 11850 .
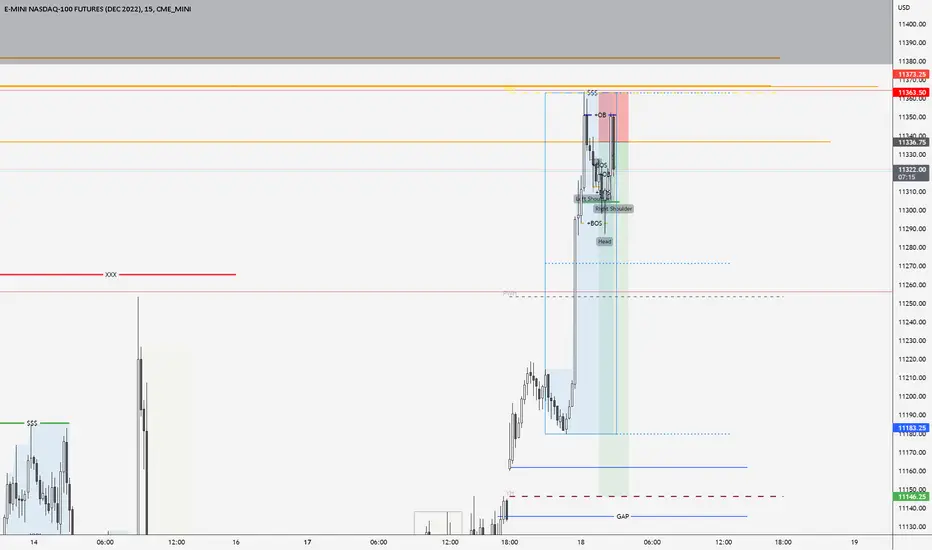
Sell possibility The price will continue with the original move (short) only if the current price goes up to fill the OB area then wait for its reactions with LTF to give us a possible sell signal in the lower time frames M1 to M5. And other reasons would be that the price will mostly reverse up and find an AOI for the central banks to find an area to put their orders in blocks as a potential sell. But its not yet valid let wait for the reaction

Nasdaq 100 Sell ShortOk, my long did not work, waiting way to long and weak move on breaking some area. Going short after analyzing Stocks of NASDAQ 100.

NASDAQ possible short for 10860daily chart forming lower low and lower high. supply zone 11730 & 11840, stop loss: 11940, target: 10860. RR 1:7

NASDAQ EXPECTED BEARISH TURNAlthough the economic indicators in US are positive in general, showing return to growth in July-September period, the heavy weight tech companies like Facebook, Alphabet and Microsoft Corp are expecting slower growth and Amazon Inc reported lower than expected earnings. This took toll on the NASDAQ Index. It plunged and broke the support of the upward channel that it had trading in since 14th of October.
Both technical indicators, MACD and RSI are confirming the bearish trend, with MACD histogram below 0 line and keep decreasing and RSI below the 50 neutral line.
If this trend continues, the instrument might reach its previous low of 10 680. In the opposite scenario, the price might try to test the channel resistance at 11 800.
Risk Disclosure: Trading Foreign Exchange (Forex) and Contracts of Difference (CFD's) carries a high level of risk. By registering and signing up, any client affirms their understanding of their own personal accountability for all transactions performed within their account and recognizes the risks associated with trading on such markets and on such sites. Furthermore, one understands that the company carries zero influence over transactions, markets, and trading signals, therefore, cannot be held liable nor guarantee any profits or losses.

NASDAQ AnalysisThe bullish trend is broken now, so I'll try to short after Lower high formation which is expected to form at the given price range.

NASDAQ -- Quick Asian Scalp IDEATargetting Gap that was created previously -- we also seem to have created the Asian highs -- this was a retracement higher to come lower in my opinion. Not holding on to trade too long as I just wanna take my profits at TP and be done. Will also be going to bed to see if I can create a bias and let it run over night -- I want to let my trades run at night and once in a while take some Asian session trades because I believe it gives my trades room to just be there without me constantly trying to over manage it.. Sometimes I realize I overthink and either take profits too soon or close the trade too early due to fear.
NASDAQ - 1H - SHORTMajor descending channel, along with high momentum in the downward direction and...
After some time, prepare yourself for an unprecedented upward movement in these few years
Golden Dragon

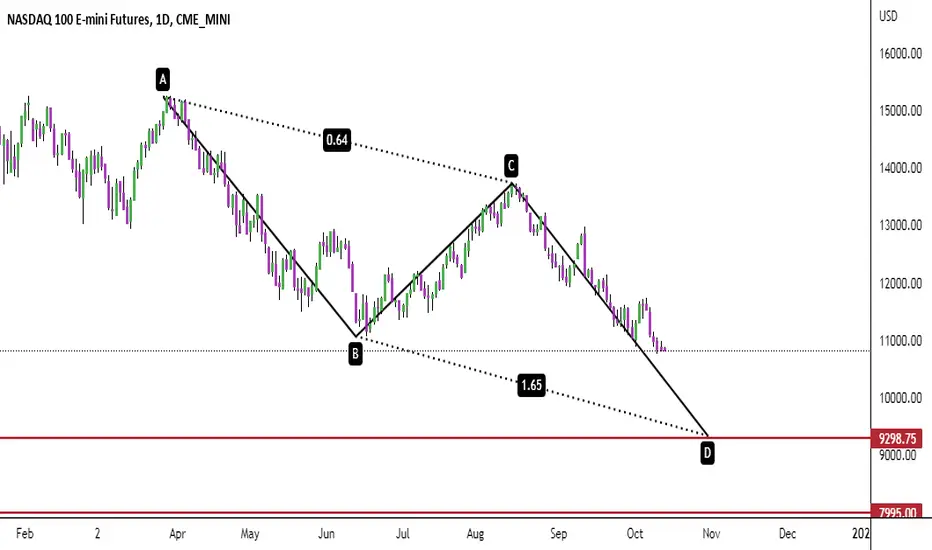
Nasdaq forming ABCD on Daily time frame . we are in berar trendNasdaq forming ABCD on Daily time frame . Nasdaq forming ABCD on Daily time frame . Not a financial advice we are in berar trend
Bearish NASDAQ (US100) to Continue in Longer TermBased on the upcoming fundamental news such as Non-farm Payroll (NFP) today and CPI news next week, I would think NQ would be bearish with higher probability to follow yellow path.
I am hoping i was wrong, but given the recent geo-political news such as OPEC+ is reducing the oil output, it will drive price of goods to continue to go up, giving more pressure for higher inflation, and fed will try to slow inflation down by increasing interest rates more if there were no strategic initiative by US government to relieve the concerning situation.


NASDAQ -1H Analysis- Entry after price actionBullish idea:
If the price breaks the resistance level at FIB 0.236, the TP is set at 11397
Bearish idea:
If the price breaks the rising trendline then the price will move DOWN at 11145

US TECH 100Us nas 100 both upside and downside moves are mentioned on charts ,need good volumes to boos market upside direction otherwise dried volumes can drag market futher downside.

NASDAQ Downtrend Short !!NASDAQ is trading in a downtrend
And the pair broke a local key level
So we are super bearish at the moment
And after the retest of the resistance cluster AT 12756
I think it will go further down

NASDAQ Short Term DropNASDAQ is looking bearish for the rest of today and tomorrow. I believe this drop is part of the bigger trend.
This is not financial advice.
Remember to DYOR!

NASDAD probability short for 126005th & 8th August daily two key reversal bars consecutively formed , made a new highs and closed towards the low. might be possible price may jump more upside to catch stop losses of retails traders. so use low trade size and wider stop loss. 13530 supply zone above key reversal bars which may test before fall. i took short trade with low risk, will add more if price moves upside. target is 12600.

NASDAQ Short Term DropNASDAQ is looking bearish for the rest of today and tomorrow. I believe this drop will only be a pullback and not anything more.
This is not financial advice.
Remember to DYOR!

nasdaq update It's ready to down,
Nd100
Sell @ 12150 and 12200
Tp 1 : 11800
Tp 2: 11700
Tp 3: 11500
Tp 4 :11300
Tp 5 : 10800
SL : 12350

NASDAQ / US100After the data of the American inflation rate, we saw that the rate of inflation is still much higher than before, and this makes the Federal Bank of America raise the bank's profits more than before, so I expect these goals in Nasdaq after breakout

nq100 positionthere are 2 BASES above the price.one of them is marked with a red box which is related to ( DROP BASE DROP IN 4H TF)
AND that one too(white box) but is not very reliable .
also pay attention to the SPIKE and UPTREND ,the BASES can play the role of the ceiling of the TRADING RANGE(TR)

NAS100USD $NAS100USD Initial ShortNAS100USD $NAS100USD Initial Short. TP and SL on chart. Move SL on TP. After TP2, trail with 0.5ATR step and 1.5ATR offset.
