NASDAQ - End Game Waves This latest 5 wave move is the end of an expanded wave 2 correction in the beginning of a major decline in wave C.
This will not make a new all time high.
Elliotticians will mistakenly call this a truncated 5th wave.
If you plan on shorting this then place your stop above 9757.
Please LIKE and FOLLOW to get notification of updates and future posts.
Nasdaqshort

#AAL ANALYSIS.. BEARISH IN LONG TERM.. I think there is not much to say about #AAL.. Due to the pandemic disaster we are experiencing, the air transportation industry has been in a very difficult situation.. The cash flows of the airline companies are seriously disrupted and this situation seems to continue for a while, in this context, we can see much lower levels in the stock price..
Also, if we approach the situation in the technical scope, the symmetrical triangle draws attention on weekly chart, this is very bearish for American Airlines in longterm..
Disclaimer: Please do your own due diligence when it comes to trading.. Invest at your own risk..
I wish you all the best..

Short NASDAQ!Please follow my channel for strong and accurate signal and support the idea by like.
NASDAQ is ramping a bearish momentum trend.

Possible Head and Shoulder Forming Supported by Fib Spiral Looking for a possible head and shoulders to form here. Fib spiral of death also supports this.

#NASDAQ ANALYSIS.. ANOTHER LOW IS COMING.. In my previous analysis, I mentioned that a strong sales wave could come to the markets again, in this context, I expect a structure as I mentioned in the chart.. Markets will be very interesting after 6 months, we will wait and see..


Start of the end for Nas100We had an impulse move downward, followed by a deep correction. Leading the common folk to think that the "recession" or calamity is over, but technicals and my belief is that we are going to see much lower prices on Nasdaq.
This recession that is on the rise is about to hit hard and sting the market real hard. However be aware that price can go up and create a double top, but I'll be keeping an eye out on PA to see what it suggests going forward.
Use this in line with your own analysis and trade safe and smart, always protection your capital in this trying times.

NASDAQ: 2008 Vs. Now. Bull Trap?!The Fibonacci lines up perfectly to 2008.
There are no such thing as coincidences.
We are approaching hard resistance area at .702 retracement.
Be prepared for an incoming -50% drop.
Void if breaks .786 retracement zone.
Comment and Like!

DELL IdeaIdea for dell
It can be seen that there was a failed cup and handle breakout previously
Will this newly formed cup and handle fail also?
Currently sitting at fib resistance, 0.786


why i will sell NASDAQ TO 7900if you follow all my nasdaq signals you will,see we have been killing it ....please follow me for more update right now as i sell nasdaq to 7900 and stop loss at 8230
also see previous analysis i tagged below
Nasdaq - why I wouldn't buy hereAs can be seen on chart Gaussian alligator can be seen to be opening bearishly on the weekly chart, with a possible rejection at the top of the ichimoku cloud, it may seem bullish at the moment but in fact this is very bearish. Short at your own risk, big players tend to take out shorts.

NASDAQ COMPOSITE INDEX (NASDAQ) WeeklyDates in the future with the greatest probability for a price high or price low

NASDAQ bouncyNASDAQ looking bouncy, drop too sharp a bounce is likely. This theory is supported by a hidden bullish divergence on the weekly chart, in which RSI makes lower lows while price makes higher lows. Will probably go lower after, yet still a nice flip opportunity. Pamp it up! PT on chart.

NASDAQ 100 Small Short or Big ShortHey, this one is pretty simple, can be retesting the green line number 1, there will reach a darn good resistance, if breaks and retest should reach near 6395, if go even lower we may see NDX go straight to line 2 like a ball droping out of your hand. Just kidding, but there is a possibility of reaching line 2. So stay sharp seeing these levels. If we have good news about a new vaccine should Stay near line 1 and go up again. Let`s hope for a vaccine. Watch out the fibo levels, there still a great possibility of going to lower levels. Its not a recommendation, so go decide yourself what you should do.

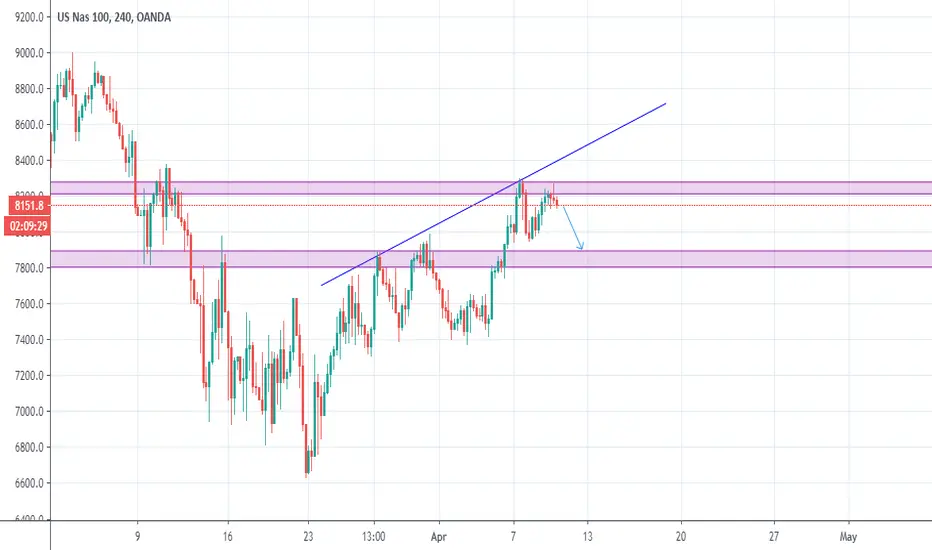
NAS100 Shorts for upcoming weekWe are seeing a good downtrend, we are finding good resistance at the 8100 level . This is where we are expecting the reversal to carry on selling. We will follow along the 15 minute time frame for a trendline break and retest for a confirmation to short.
Expecting a move to 6550.
If we break above the 8100 level we will be looking for a long oppurtunity.


NAS100 (NASDAQ) CONGRATULATIONS AGAIN ON OUR SELLFROM LAST ANALYSIS TAGGED BELOW WE SOLD AND MADE GOOD PIPS NOW WE SHOULD SELL AGAIN TO NEXT SUPPORT AT 8300 REGION
CHECK BELOW TO SEE MY PREVIOUS NAS100 ANALYSIS AND DONT FORGET TO FOLLOWUP AND DROP A COMMENT LET HELP YOU TRADE WELL

Nasdaq 100 enter the VERY Dangerous High valuation zone. Short
Monthly chart from 2009, NDX, nasdaq 100 up about 3700 points the 3rd time to 9600, all time high.
expecting a ~15% adjustment in the first half of 2020. look for rate cut for entering time.

NAS100 Potential Downside Ahead of FOMCNAS100 Potential Downside Ahead of FOMC, Potential Target sees 7500.00

Nasdaq's Route for Short TermWe believe it's time to realize the profits made. So Nasdaq's little crash for now is likely.
Entry: 9180
Stop: 9270
Target: 8940
Have a nice week! Follow for more.

WMT Nasdaq running on steam while fusion is available WMT has been on a parabolic bull run, yet no trend can be observed it seems to be ‘running on steam’ This is supported by the CVI, with less money flowing into the nasdaq composite, hence momentum decreasing. OBV shorts and longs both increasing and volume RSI seemly absent for the past 46 years. The fusion I talk about comes in the form of digital currencies and their ability to alter the industry. Gold can be seen to be steadily increasing which is historically strong within a recession.

