❌A bearish MTR setup has been formed❌Considering the breaking of the upward trend line and the formation of the descending MTR, it is likely that it can continue to fall until the first target, 17500
Nasdaqsignals

SELL NASDAQYesterday I posted to sell NASDAQ, however the market didn’t reach our OB and gave us an BOS, now since the market have reached our OB you can sell and set SL and TP as dat in the chart.

SELL NASDAQI'm shring with you one of my trades for today on NASDAQ.
Sell at 17678.51 with SL at 17752.27 and TP at 17473.59.
For further questions don't hesitate to ask!

S&P500(US500):🔴Is it Bearish...?!🔴(Details on caption)By examining the ES1! 4-hour chart (S&P), we can figure out that, the market structure is bearish, so we looking for a sell position.
In that case, the price had a bearish reaction to all of the bearish Pd Array, so we can expect a bearish reaction on the balance price range (BPR).
In my perspective, sell-side liquidity is a draw on liquidity. Until this sell-side is not purging I don't think about buy position.
💡Wait for the update!
🗓️15/04/2024
🔎 DYOR
💌It is my honor to share your comments with me💌

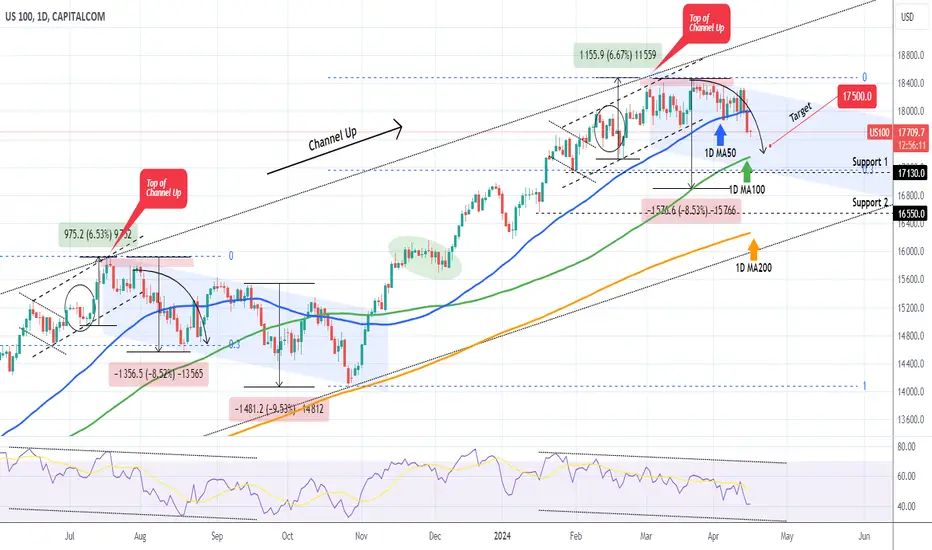
NASDAQ Emphatically below its 1D MA50 after +5 months!Nasdaq (NDX) is on the pull-back process, a correction that we called on our March 12 idea (see chart below) when the index reached the top of its 1 year Channel Up:
Even as recently as last week (see chart below) we called for the ideal sell entry and set a 17500 Target:
As you can see, the index emphatically broke and closed below the 1D MA50 (blue trend-line) yesterday for the first time in more than 5 months (April 04 also closed below it but only marginally). That is technically as strong bearish break-out signal.
The idea now is that we want the index to hit the 1D MA100 (green trend-line), which has been intact since November 06 2023, see how the market reacts and then determine if that is a low or not. Technically if it replicates the August 18 2023 Low, we should be expecting a Low on the 0.3 Fibonacci retracement level at 17,150 at least, which also happens to be just above Support 1.
The decline on the Aug 18 2023 Low was of the -8.52% magnitude, so that gives us a 16900 downside limit. We don't expect the pull-back to go that low though this time. A fair bottom signal can be when the 1D RSI hits 35.00 or the bottom of its Channel Down, similar to what took place on August 18 2023.
-------------------------------------------------------------------------------
** Please LIKE 👍, FOLLOW ✅, SHARE 🙌 and COMMENT ✍ if you enjoy this idea! Also share your ideas and charts in the comments section below! This is best way to keep it relevant, support us, keep the content here free and allow the idea to reach as many people as possible. **
-------------------------------------------------------------------------------
💸💸💸💸💸💸
👇 👇 👇 👇 👇 👇
NAS100 MORE SELLS FOR BUY ATTEMPTSNAS100 gave a beautiful push to the downside after triggering the sell limit shared last week. The 4H SC area from yesterday's NY session looks juicy for sells to take her lower.
Price is currently close to tapping the 4H imb, a pull back off that imb towards the sc during london for sells during NY would be ideal.

Nasdaq Pair : NASDAQ
Description :
Rising Wedge as an Corrective Pattern in Long Time Frame
RSI - Divergence
Break of Structure
Completed " 12345 " Impulsive Waves and " ABC " Corrective Waves
Resistance Level

NADAQ - In bullish trendUS100 taking support at 18000 so we are going to buy here considering the respect of R1 at the 18000 level

ONL LON.gPreferably Buy Below = 3.38
Target 1 = 3.62
Target 2 = 3.86 with trailing stop loss
Stop Loss = 3.14
Just paper trade bitches.
GG.

US100 BULLISH ROBBERY PLANHigh risk Heist Plan,
Ola Chicos Chicas,
This is our Day Trade master plan to Heist Bullish side of US100. my dear Looters U can enter at the any point above my entered area of Green zone, Our target is Red Zone that is Dangerous area. We can escape near the Target area. There is a chance to move opposite direction. Be careful & be rich

NASDAQ Will the 1D MA50 hold or break and start a correction?Nasdaq (NDX) marginally broke and closed a 1D candle below the 1D MA50 (blue trend-line) last week but quickly recovered on Friday and this week has established its price action above it. Still it is under Lower Highs following the March 21 Double Top.
It is a fact that the 1D MA50 hasn't been broken in 5 months (since November 03 2023) so last week is the first bearish sign after much time, but the quick recovery leaves a neutral, to say the least, tone. However, the (dashed) Channel Up is already broken downwards, so we will wait for a final bearish confirmation, with the condition being another 1D candle closing below the 1D MA50.
If that happens, we expect a Channel Down to emerge similar to July - October 2023. In that case, we will be looking on the short-term for a 1D MA100 (green trend-line) test, with a minimum Target at 17500.
-------------------------------------------------------------------------------
** Please LIKE 👍, FOLLOW ✅, SHARE 🙌 and COMMENT ✍ if you enjoy this idea! Also share your ideas and charts in the comments section below! This is best way to keep it relevant, support us, keep the content here free and allow the idea to reach as many people as possible. **
-------------------------------------------------------------------------------
💸💸💸💸💸💸
👇 👇 👇 👇 👇 👇


Nasdaq - In Bearish TrendNasdaq following the Berish Trend making LH and LL also respecting the bearish trendline.

Buy QualcommShort Term Trading Advice by Naranj Capital
Buy Qualcomm
● Buy Range- 168 - 171
● Target- 179 - 181
● StopLoss- 163
● Potential Return- 5-6%
● Duration- 14-15 Trading Days

NASDAQ Short-term Support is failing.Nasdaq has been trading within a Channel Up pattern since late January and as you can see on the chart, every time the Bullish Leg held the 4H MA50 (blue trend-line) halfway (blue ellipse), the price continued the uptrend for a +5% Higher High.
This time, the index closed a 4H candle below the 4H MA50, for the first time before a Higher Highs was priced. It is now probable to see a 1D MA50 (red trend-line) test for the first time since November 03 2023. If not and the index closes today's 1D candle above the 4H MA50, then we will consider it an invalidation and bullish continuation signal and we will buy targeting 18700 (+5.38% rise from the last Higher Low).
If it fails to recover the 4H MA50, you may sell intra day towards the 1D MA50 but a more stable signal is to sell the break-out below the Channel Up, either on the spot or after the price rebounds to test the 1D MA50 as Resistance. In either case, our bearish Target will be 17410 (0.382 Fibonacci retracement level).
-------------------------------------------------------------------------------
** Please LIKE 👍, FOLLOW ✅, SHARE 🙌 and COMMENT ✍ if you enjoy this idea! Also share your ideas and charts in the comments section below! This is best way to keep it relevant, support us, keep the content here free and allow the idea to reach as many people as possible. **
-------------------------------------------------------------------------------
💸💸💸💸💸💸
👇 👇 👇 👇 👇 👇

NASDAQThis Is Another Perspective On The Nasdaq Analysis I Just Shared, What Can Also Happen Is Nasdaq Trading Above Monday's High To Form A Classic Tuesday High Of The Week, We'll See Tomorrow What Is Likely To Happen Between The Two Anticipations.

My NQ 4H Projection
4H short term bearish; medium term bullish; long run bearish so expect dump after all time high this time.

US100/NASDAQ/USTECH Bearish Side Short PlanOla Ola Traders,
This is our master plan to Heist Bearish side of NASDAQ Market. Guys U can enter at my entry area or below the trending candles, Our target is Caution Zone. This is my Intraday Robbery plan. Guys Kindly Loot and escape before the Caution zone bexause trend make Pullback or Sideways so becareful.

Possible sell opportunity on NASDAQwere on a 3rd day of push to the downside, also currently in the golden zone and also in Premium zone. On the 4H & 15 min time frame weve reached order blocks. Id go for a 1:2 RR for this just to keep it light since this still is an uptrend. If it goes beyond the 2nd leg the trade will be invalid

NASDAQ100 ON MAJOR BUYING ZONEThe analysis suggests that NAS 100 (Nasdaq 100 index) is currently within a major buying and demand zone. This zone is a price range where significant buying interest has historically been observed, indicating strong demand for the index. Specifically, the demand zone is identified between 18,200 to 18,300 points on the NAS 100 index.
In technical analysis, demand zones represent areas where buyers outnumber sellers, resulting in increased buying pressure and potential price support. Traders often view demand zones as favorable entry points for long positions, anticipating a bounce in price from these levels.
The target for this trading setup is set at 200 pips, representing the expected upside movement in the NAS 100 index from the demand zone. Traders typically set targets based on technical analysis indicators, historical price movements, and market sentiment. In this case, the target of 200 pips suggests a significant potential gain for traders who enter positions at the demand zone.
Overall, the analysis indicates a favorable trading opportunity in NAS 100, with a major buying and demand zone identified between 18,200 to 18,300 points. Traders may consider entering long positions with the expectation of a 200-pip upside movement, aiming to capitalize on the potential price appreciation from the demand zone.

NASDAQ(US100):🟢Possible scenarios🟢(Details on Caption)
Hello Traders
Outlook:
Daily Chart Summary:
NASDAQ's recent action:
Cleared sell-side liquidity in the daily Fair Value Gap (FVG).
Activated bearish breaker block by closing below 18233.50.
Bullish Scenario:
4-hour chart insights:
Trend line liquidity intact.
Buy-side liquidity remains untouched.
SMT with S&P500 and Dow Jones trend supports upward potential.
Bearish Scenario:
Concerns:
Activation of daily bearish breaker block.
Presence of order block with Fair Value Gap (FVG) on the 4-hour chart.
Explore
By examining the NASDAQ daily chart we can figure out, that the price purged the sell-side liquidity that formed inside the daily FVG. On the other hand, the price activated the bearish breaker block by closing the daily candle body below 18233.50.
Up to this point, I mentioned the primary characteristics of bullish and bearish scenarios, Let's go deeper and continue.
The first scenario (I follow this scenario) is bullish, Here in the NASDAQ (US100) 4-hour chart we can see the created trend line liquidity and left buy-side liquidity untouched. In addition, there is an SMT with S&P500 and Dow Jones. This alignment gives us added confidence in the potential for the price to target the buy-side liquidity.
The second scenario is bearish. As I mentioned the price activated the daily bearish breaker block and also there is an order block with FVG that may push the price lower. The bullish FVG above sell-side liquidity can be our first target in this scenario.
💡Wait for the update!
🗓️17/03/2024
🔎 DYOR
💌It is my honor to share your comments with me💌
