Nasdaq -> Short Squeeze ComingHello Traders,
welcome to this free and educational multi-timeframe technical analysis .
On the weekly timeframe you can see that Nas100 just recently perfectly broke above and with last week's candle already retested and rejected a quite obvious previous weekly resistance area at the HKEX:12 ,800 level.
You can also see that as we are speaking, Nas100 is approaching the next major weekly structure area at the HKEX:13 ,600 level which was acting as quite strong resistance in the past, so from a weekly perspective I am now just waiting for another rally to retest the next resistance before I then do expect a short term correction towards the downside.
On the daily timeframe you can see that with Friday's candle, the Nasdaq perfectly broke and closed above a previous daily resistance area at the HKEX:13 ,100 level - all of this previous resistance is now turned support so I am just waiting for a retest and bullish confirmation before I then do expect another impulse towards the upside.
Thank you for watching and I will see you tomorrow!
You can also check out my previous analysis of this asset:
Nasdaqsignals

Price projection on Nasdaq 100 nas100 us100Nas prolly hitting the 14k levels sooner, similar price on top 500

Us100 shortHi traders, I think the price will bounce from this area, after we saw the triple top inside the bullish flag, I think it is a slight correction before going up and breaking the flag. Trader safe and have à good week-end.

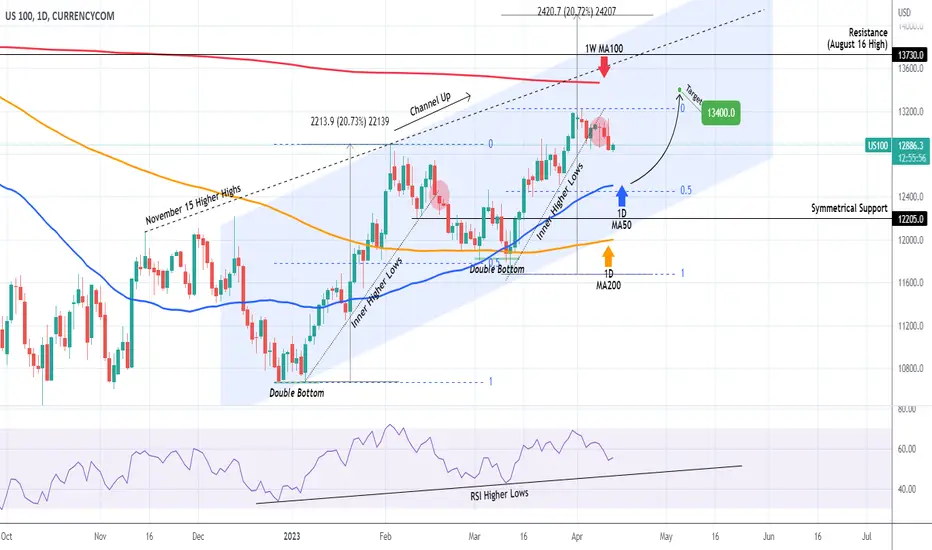
NASDAQ Correction still has some steam left.Almost 2 weeks ago we called for a multi-day correction on Nasdaq (NDX) after the price broke below the Inner Higher Lows trend-line and the 1D RSI got rejected on the 70.00 overbought Resistance:
Our view is unchanged and we see a few more days extending this correction to the 1D MA50 (blue trend-line) at least or the 0.5 Fibonacci retracement level as it happened on the March 13 Low on the long-term Channel Up.
The only probability of this getting invalidated and start rebounding now is the potential buying pressure that the RSI Higher Lows trend-line may apply, which got hit yesterday. However we see more likely the scenario of the RSI transitioning into a Rectangle, having 43.40 as its bottom.
Our target remains 13400, which is a little under the 1W MA100 (red trend-line), that has rejected break-out attempts twice since May 05 2022.
-------------------------------------------------------------------------------
** Please LIKE 👍, FOLLOW ✅, SHARE 🙌 and COMMENT ✍ if you enjoy this idea! Also share your ideas and charts in the comments section below! **
-------------------------------------------------------------------------------
💸💸💸💸💸💸
👇 👇 👇 👇 👇 👇

Nasdaq descending triangle setuphello traders Nasdaq is making a descending triangle we was in a diamond shape on a 4hr we have a break on it lets wait the break of our pattern you can wait a retest to even conform but sometimes no retest

NAS100 DAILYThis IDea base on Supply at daily, Before FOMC we might see a light bullish.
Look only the volume if the price has momentum.
Trade base on your own decissions.
Follow for more

NASDAQ TRADE IDEA MONDAY Beautiful setup today - Nasdaq looks good for a long and a short but the main movement being the sell.
It's our birthday tomorrow - thanks for all the support so far

Nasdaq selling to buy zone!!!From the daily we can spot price in a bearish trend, because of the series of Lower highs (descending slope)... Now this means sellers will be more impulsive than buyers, so bearish setups are highly recommended.
Look out for all bearish continuation flags across all timeframes to capitalize on the impulsive wave and bank dome serious %.
Goodluck to us all!!!

NASDAQ SETUPWe caught a buy from 12950 and now we monitor for a sell close to where we sold off last night or a new high at 13173. Nice tight zone so I will most likely have a few foot soldiers in early.

OBIO , Orchestra BioMed Holding Demand zoneOBIO , Orchestra BioMed Holding Demand zone reaching good demand zone and as depicted in chart
Entry:15.78
SL:13.90
TP:23 , Profit=50%

Nasdaq triangle breakout scalphello traders nas100 looks what is making an ascending triangle but we can play against what we all learn from the text book we will use to short it looks clean nas100 was very rangy but still we can take advantage on a rangy market .overall it is bullish but still we don't fix ourselves in one direction any ways we are buying it from the broker so think both side lets get it /if it is helpful signal like this make sure to like and comment so i keep posting .

NASDAQ TRADE IDEA - A BREAK?Crown Club managed to maximise the sell off yesterday on the Head of the head and shoulders pattern.
The market has been crazy moving sideways - the volatility is mainly caused from earnings and the wait of what the FED will do at the next FOMC meeting in May - remember that all the evidence we can gather now on where interest will be in the next FOMC meeting will influence the markets.
'Fed’s Bostic sees one more quarter-point rate hike, then a hold ‘for quite some time' - As a member of the FED, this statement from CNBC could potentially lead markets further down and with earnings out now we could see a potentially good window for investors and firms to grab profits while stocks are "doing good" - majority of retail traders would follow direction of the market and news, what do I mean by this?
If APPL does good with earnings you would expect price to go through a bull run, all though this is still a possibility I see this as an opportunity for BIG investors to cash in profits - hence the recent volatility and consolidation.
Be prepared for a lot of fake out and sl sweeps this week.

NASDAQ Today D1Here is my view for NASDAQ on D1. The price could go bullish, you can put a pending order on the Order block or find an entry on LTF within OB Zone. Trade Safe!

Nasdaq -> This Is The SetupHello Traders,
welcome to this free and educational multi-timeframe technical analysis .
On the weekly timeframe you can see that nas100 just recently perfectly broke above, retested and already rejected a quite obvious weekly structure area exactly at the HKEX:12 ,000 area.
You can also see that we are approaching another weekly resistance area at the HKEX:13 ,200 level, you can also see that nas100 just had a pump of about 15% towards the upside over the past couple of weeks, so I simply do expect a short term correction back to the HKEX:12 ,800 area and then a next impulse towards the upside from there.
On the daily timeframe you can see that nas100 has been trading in a range over the past couple of days, I am also now just waiting for a deep retest of the next daily support zone at the HKEX:12 ,800 area and then there is a very high chance that we will also see more daily continuation towards the upside from there.
Thank you for watching and I will see you tomorrow!
You can also check out my previous analysis of this asset:

Nasdaq 4Hr TF AnalysisHello,
My previous post I analysed the weekly timeframe and I mentioned how the market has been consolidating and now on the 4 hour chart you can see the build up of the consolidation. We can see we are getting closer and closer for this break. We have had few fake breakouts, which we want to avoid getting caught in.
I would wait for a break of 131200 area or 12840 area to decide to get a safer entry weather you go buy or sell short term.

US100 BuyWith multiple touches on the 12870.00.
and failing to break through the support line.
Im still expecting a bullish momentum
With the bullish hammer on the weekly timeframe,and also on the daily,
I will be monitoring nas and looking for buy triggers on the lower timeframe.M30 /M15

US100 BuyNasdaq was a bit choppy last week, ups and downs with the CPI,
This week im looking forward to buying NAS, With last weeks candle closing as a bullish hammer/kangaroo tail.
I think Nas is set to continue with the bullish momentum


NASDAQ TRADE IDEA + PPI%Hi everyone,
So here is my analysis for NASDAQ today - as we can see yesterday the CPI% was released and the stats were:Actual: Actual: 0.1% - Expected: 0.2% - Previous: 0.4% - natrually you would say stocks would have a positive reaction to this data, correct? Well indeed it did when the stats were released but it instantly reversed and market closed down lower than expected. I call this move a BULL TRAP - All though there was positive news, based off what the FED has to do to battle inflation as well as talks of a potential recession in the U.S.A. gave reasoning why investors would focus on shorting the market.
Same thing today for PPI - I expect a fake breakout up and then a reverse down taking stocks into last weeks range. Nice potential swing trade setup if we get into a good entry.
Be cautious today as there is a lot happening - apply proper risk management and don't see this opportunity as a winning lottery ticket, see it as an opportunity to compound on your current wins to grow into an even more profitable trader.

NASDAQ Correction for few days then buy the dipNasdaq (NDX) has gone a long way since we called for a rebound on the 1D MA200:
The recent rally within this Channel Up pattern that started in December (its second Bullish Wave), came to an end after it broke the Inner Higher Lows trend-line in similar fashion as the first wave did on February 17. That pulled-back to the 0.5 Fibonacci retracement level before rebounding to a Higher High.
The current 0.5 Fib is on 12460, a little under the March 28 Low and the 1D MA50 (blue trend-line), which has been basically supporting since mid-January. If the RSI bounces off its Higher Lows trend-line, then the bottom may come earlier. In any case, we will buy this pull-back and target 13400, a potential contact with the 1W MA100 (red trend-line), which rejected the August 16 High.
The best level to buy during this run is on the Higher Lows trend-line of the RSI. A similar Higher Lows trend-line during the January bullish leg (note that both sequences started on a Double Bottom), gave 5 clear buy entries.
-------------------------------------------------------------------------------
** Please LIKE 👍, FOLLOW ✅, SHARE 🙌 and COMMENT ✍ if you enjoy this idea! Also share your ideas and charts in the comments section below! **
-------------------------------------------------------------------------------
💸💸💸💸💸💸
👇 👇 👇 👇 👇 👇
INVERTED H&S ON NASDAQ Morning everyone,
Looking at this inverted H&S move play out today for Nasdaq - if price breaks the shoulder zone I would I really hold sell positions to 12935 - 12820
If preteen is respected we will look to take some long positions on the formation of the shoulder.

Potential bull flag on the Nasdaq 100 (NDX)The Nasdaq is holding above the February high and forming a potential bull flag pattern, which projects an approximate target around 13,500. A larger flag pattern also remains in play with a target just below 14,000, although the October high and monthly R1 around 13700 provide a likely resistance area. The daily trend is respecting the 10 and 20-day EMA's and the structure favours a break of last week's high.
- Bulls could seek bullish setups around current levels in anticipation of a break higher, or around the monthly pivot point should we see a deeper pullback and invalidation of the smaller flag.
- The bias remains bullish above the monthly pivot
- Targets include the resistance clusters around 13,500 and 14,000

nas100 nasdaq indices nasusd100hello traders nas is setting froming it self for a possible upside can we catch of course it is just being patient to get into our area as far as you know what to look for no fomo no stress wait for session as conflence an execute manage your risk it is a number game good luck with your trading
