NASDAQ One more low to go.Nasdaq (NDX) has been trading within a short-term Channel Down since the December 16 2024 High. So far it has made two Lows and each one bottomed after the 4H RSI made Double Bottom as seen on the chart.
Right now the 4H RSI just turned oversold below 30.00, so technically we still have room for one last Low before we see a rebound. We expect the next Bullish Leg to target at least 21300, which is marginally below the 0.786 Fibonacci retracement, the level that formed the previous two Lower Highs of the Channel Down.
-------------------------------------------------------------------------------
** Please LIKE 👍, FOLLOW ✅, SHARE 🙌 and COMMENT ✍ if you enjoy this idea! Also share your ideas and charts in the comments section below! This is best way to keep it relevant, support us, keep the content here free and allow the idea to reach as many people as possible. **
-------------------------------------------------------------------------------
💸💸💸💸💸💸
👇 👇 👇 👇 👇 👇
Nasdaqsignals

Nasdaq market analysis: 13-Jan-2025Happy new week traders! Join me for the first Nasdaq market analysis for the year 2025. Share your charts, ask questions, and let's discuss trading strategies.

Potential bearish drop?NAS100 has reacted off the support level which is an overlap support that lines up with the 23.6% Fibonacci retracement and could drop from this level to our take profit.
Entry: 20,941.46
Why we like it:
There is an overlap support level.
Stop loss: 21,195.49
Why we like it:
There is a pullback resistance level that lines up with the 50% Fibonacci retracement.
Take profit: 20,573.63
Why we like it:
There is a pullback support level that lines up with the 127.2% Fibonacci retracement.
Enjoying your TradingView experience? Review us!
Please be advised that the information presented on TradingView is provided to Vantage (‘Vantage Global Limited’, ‘we’) by a third-party provider (‘Everest Fortune Group’). Please be reminded that you are solely responsible for the trading decisions on your account. There is a very high degree of risk involved in trading. Any information and/or content is intended entirely for research, educational and informational purposes only and does not constitute investment or consultation advice or investment strategy. The information is not tailored to the investment needs of any specific person and therefore does not involve a consideration of any of the investment objectives, financial situation or needs of any viewer that may receive it. Kindly also note that past performance is not a reliable indicator of future results. Actual results may differ materially from those anticipated in forward-looking or past performance statements. We assume no liability as to the accuracy or completeness of any of the information and/or content provided herein and the Company cannot be held responsible for any omission, mistake nor for any loss or damage including without limitation to any loss of profit which may arise from reliance on any information supplied by Everest Fortune Group.

Nasdaq analysis: 09-Jan-2025Good morning, everyone! Today's Nasdaq analysis is designed to educate and empower. Use these insights to refine your price action trading strategy.

NAS100 - lets focus on recoveryTeam,
Yesterday, we got DOW to hit two targets. and 3 target short for the DAX
We are now entering long at 21076-85 ranges
STOP LOSS at 21035 or extend to 20987
Target 1 at 21112-26 - NOTE: once it hits our first target range, take partial and bring stop loss to BE.
Target 2 - 21187-95 - I would prefer to take this target as confident.
Target 3 - 21286-21332

NAS100 - TIME FOR ENTER THE TRADE LOOKING FOR RECOVERYTeam,
Again, I hope you have a fantastic new year and lets kill the BEAST (market) together
I found a good entry for NAS 100 at 21185-92
STOP LOSS at 21050 or 21105
Target 1 at 21236-57
Target 2 at 21315-45
Target 3 at 21385-21425
NOTE: Please ensure you take your partial once it hits the first target range of 21236-57. Please bring STOP LOSS to BE to secure the trade

NASDAQ rebounding strongly on its 1D MA50. 1 month rally ahead.Nasdaq (NDX) has been trading within a 4-month Channel Up and hit last Tuesday its 1D MA50 (blue trend-line) exactly on the Channel's bottom. Even though it marginally broke it, the 1D candle closed exactly on the 1D MA50, causing a strong bullish Friday reaction.
As today opened equally green, we technically view this sequence as the start of the new Bullish Leg of the pattern, which may be confirmed today if the 1D RSI breaks above its MA (yellow trend-line), as both previous Bullish Legs did.
Our Target is 22600, which represents a +9.00% rise, the minimum a Bullish Leg had within this Channel Up.
-------------------------------------------------------------------------------
** Please LIKE 👍, FOLLOW ✅, SHARE 🙌 and COMMENT ✍ if you enjoy this idea! Also share your ideas and charts in the comments section below! This is best way to keep it relevant, support us, keep the content here free and allow the idea to reach as many people as possible. **
-------------------------------------------------------------------------------
💸💸💸💸💸💸
👇 👇 👇 👇 👇 👇


First Nasdaq market analysis 2025Happy Happy New year traders! Join me for the first Nasdaq market analysis for the year 2025. Share your charts, ask questions, and let's discuss trading strategies.

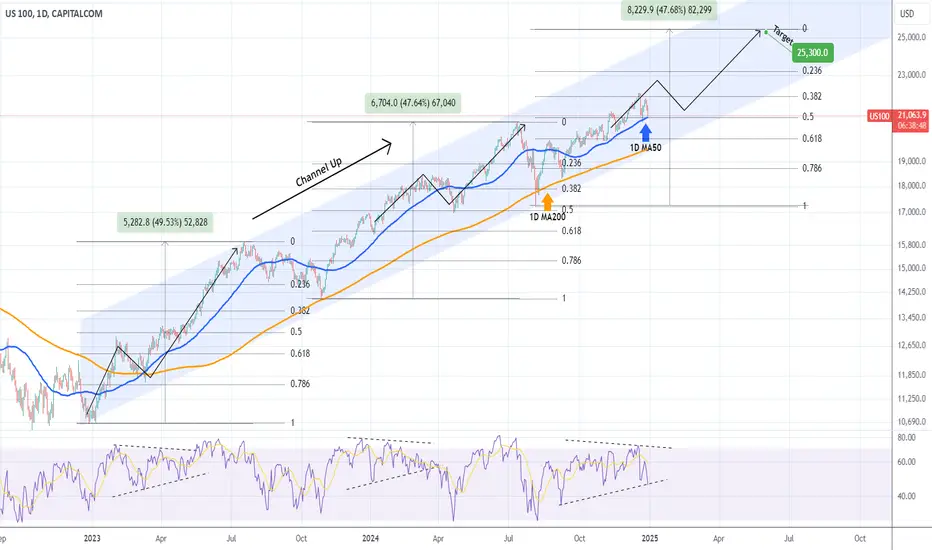
NASDAQ headed into a volatile January but uptrend remains intactNasdaq (NDX) is yet again testing the 1D MA50 (blue trend-line) following the direct hit of December 20. Despite the pull-back, it is technically respecting the 2-year Channel Up that it's been trading in since the December 26 2022 market bottom. Its most recent Higher Low was on the August 05 2024 1W candle, which initiated the Bullish Leg we're currently in.
Until we get a 1W candle closing below the 1D MA200 (orange trend-line), the pattern remains intact and the strategy is to continue buying into the current Bullish Leg. The previous two Bullish Legs had one main pull-back/ correction sequence each and apart from that, the majority of the Leg was technically a straight uptrend. Given that the current Bullish Leg has been trading above its 1D MA50 since September 12, it is not unlikely to see a correction below it.
Technically, it could be similar to the previous Bullish Leg (March 04 - April 15 2024), as we are trading within the 0.382 - 0.5 Fibonacci range. This means that one more rise above the 0.382 Fib is to be expected in the first week of January but it is likely to then see a correction for the rest of the month below the 1D MA50 into the first 2 weeks of February.
If after that, the 0.5 Fib and 1D MA200 levels hold, we expect the Bullish Leg to resume the uptrend and target 25300. That would be a rise of around +48%, which is the % rise of both previous Bullish Legs.
-------------------------------------------------------------------------------
** Please LIKE 👍, FOLLOW ✅, SHARE 🙌 and COMMENT ✍ if you enjoy this idea! Also share your ideas and charts in the comments section below! This is best way to keep it relevant, support us, keep the content here free and allow the idea to reach as many people as possible. **
-------------------------------------------------------------------------------
💸💸💸💸💸💸
👇 👇 👇 👇 👇 👇
"US100 / NASDAQ 100 / US TECH" Indices Market Bullish Heist Plan🌟Hi! Hola! Ola! Bonjour! Hallo!🌟
Dear Money Makers & Robbers, 🤑 💰
Based on 🔥Thief Trading style technical analysis🔥, here is our master plan to heist the "US100 / NASDAQ 500 / US TECH" Indices Market market. Please adhere to the strategy I've outlined in the chart, which emphasizes long entry. Our aim is the high-risk Red Zone. Risky level, overbought market, consolidation, trend reversal, trap at the level where traders and bearish robbers are stronger. 👀 So Be Careful, wealthy and safe trade.💪🏆🎉
Entry 📈 : You can enter a Bull trade at anypoint,
however I advise placing Buy limit orders within a 15 or 30 minute timeframe. Entry from the most recent or closest low or high level should be in retest.
Stop Loss 🛑: Using the 4H period, the recent / nearest low or high level.
Goal 🎯: 22,800.0
Scalpers, take note : only scalp on the Long side. If you have a lot of money, you can go straight away; if not, you can join swing traders and carry out the robbery plan. Use trailing SL to safeguard your money 💰.
Warning⚠️ : Our heist strategy is incompatible with Fundamental Analysis news 📰 🗞️. We'll wreck our plan by smashing the Stop Loss 🚫🚏. Avoid entering the market right after the news release.
Take advantage of the target and get away 🎯 Swing Traders Please reserve the half amount of money and watch for the next dynamic level or order block breakout. Once it is resolved, we can go on to the next new target in our heist plan.
💖Supporting our robbery plan will enable us to effortlessly make and steal money 💰💵 Tell your friends, Colleagues and family to follow, like, and share. Boost the strength of our robbery team. Every day in this market make money with ease by using the Thief Trading Style.🏆💪🤝❤️🎉🚀
I'll see you soon with another heist plan, so stay tuned 🫂

Actionable Nasdaq insights: 30-Dec-2024Rise and shine, traders! Start your day with actionable Nasdaq insights. Let's grow your skills together, one chart at a time.

NAS100 go to 230001. NAS100 has risen for three consecutive days and closed above the midline of the trendline.
2. Resistance is expected near 22140, with a potential pullback. Support during the pullback is still anticipated around the trendline midline. If the daily close fails to hold above this level, the outlook turns bearish toward 20750.
3. If the pullback finds support at the trendline midline (around 21400), the bullish momentum is likely to continue, potentially reaching a new high of 23000 before pulling back toward 20750.
4. The key level to watch is the trendline midline support (or around 21400).

NAS100On NAS100 I am bearish for the longer term, currently I am waiting for price to reach my area of interes where I will be looking for selling opportunities. You will see there are two areas where i will be interested to look for selling opportunities. This is done based on my strategy on specific charts.
Remember, clear charts better vision.

Potential bullish rise?NAS100 has reacted off the support level which is an overlap support that aligns with the 23.6% Fibonacci retracement and could rise from this level to our take profit.
Entry: 21,426.87
Why we like it:
There is an overlap support level that aligns with the 23.6% Fibonacci retracement.
Stop loss: 21,119.53
Why we like it:
There is a pullback support level that lines up with the 61.8% Fibonacci retracement.
Take profit: 21,894.84
Why we like it:
There is a pullback resistance level that aligns with the 78.6% Fibonacci retracement.
Enjoying your TradingView experience? Review us!
Please be advised that the information presented on TradingView is provided to Vantage (‘Vantage Global Limited’, ‘we’) by a third-party provider (‘Everest Fortune Group’). Please be reminded that you are solely responsible for the trading decisions on your account. There is a very high degree of risk involved in trading. Any information and/or content is intended entirely for research, educational and informational purposes only and does not constitute investment or consultation advice or investment strategy. The information is not tailored to the investment needs of any specific person and therefore does not involve a consideration of any of the investment objectives, financial situation or needs of any viewer that may receive it. Kindly also note that past performance is not a reliable indicator of future results. Actual results may differ materially from those anticipated in forward-looking or past performance statements. We assume no liability as to the accuracy or completeness of any of the information and/or content provided herein and the Company cannot be held responsible for any omission, mistake nor for any loss or damage including without limitation to any loss of profit which may arise from reliance on any information supplied by Everest Fortune Group.

NASDAQ Technical buy on this 1D MA50 bounce.Nasdaq (NDX) has been trading within a Channel Up pattern since the September 06 Low and potentially has started the new Bullish Leg as on Friday it hit the 1D MA50 (red trend-line) and rebounded. The 1D MA50 has been holding since the September 12 bullish break-out.
Still, there is no confirmation yet, as the price remains below the 4H MA50 (blue trend-line). As you can see on this chart, every time the index broke above its 4H MA50, it never broke again until the next Higher High of the Channel Up, technically confirming the new Bullish Leg.
With the 4H RSI rebounding also from oversold (<30.00) territory, there are higher probabilities of this being the new Bullish Leg. If the confirmation comes, we expect at least another +9.08% rise from Friday's Low (which was the % rise of the previous Bullish Leg) to target 22500.
-------------------------------------------------------------------------------
** Please LIKE 👍, FOLLOW ✅, SHARE 🙌 and COMMENT ✍ if you enjoy this idea! Also share your ideas and charts in the comments section below! This is best way to keep it relevant, support us, keep the content here free and allow the idea to reach as many people as possible. **
-------------------------------------------------------------------------------
💸💸💸💸💸💸
👇 👇 👇 👇 👇 👇

Nasdaq analysis: 20-Dec-2024Good morning, traders! Today's Nasdaq analysis will help you achieve your trading goals. Let's work together towards success.

Nasdaq market analysis: 19-Dec-2024Good morning! Join me for today's Nasdaq market analysis. Share your charts, ask questions, and let's discuss trading strategies.

Elliott Wave Analysis and Fibonacci Projections for US 100CAPITALCOM:US100
The Elliott Wave Theory identifies 5 impulsive waves in the direction of the trend, followed by 3 corrective waves:
Impulse Waves (1-2-3-4-5): Main trend movement.
Corrective Waves (A-B-C): Countertrend correction.
2. Detailed Analysis of Observed Waves
Wave 1: Initial Upward Impulse
Definition: This is the first wave that initiates a new trend, driven by optimistic investors.
Key Level on Your Chart:
The bottom of Wave 1 is observed at 21,571.8, marking the trend’s starting point.
Wave 2: Correction of Wave 1
Definition: This wave corrects a portion of Wave 1, typically between 38.2% and 61.8% of Fibonacci retracements.
Interpretation: The correction does not breach the starting point of Wave 1.
Observation:
Wave 2's correction stays above the critical support.
Wave 3: Strongest Impulse Wave
Definition: This is typically the longest and strongest wave, often extending 1.618 times Wave 1.
Key Features:
It surpasses the high of Wave 1 and creates a significant trend move.
Key Level on Your Chart:
The peak of Wave 3 is at 22,133.4, confirming a strong upward move.
Wave 4: Intermediate Correction
Definition: Wave 4 corrects part of Wave 3 but does not overlap with Wave 1’s territory.
Typical Retracement: Between 23.6% and 50% of Wave 3 (Fibonacci levels).
Observation:
The low of Wave 4 is seen at 21,946.8, aligning with a retracement between 38.2% and 50%, indicating a moderate pullback.
Wave 5: Final Impulse Wave
Definition: This wave continues the trend but is usually weaker than Wave 3.
Projection:
Fibonacci extensions project Wave 5 to end around 0.618x or 1.0x of the distance between Wave 1 and Wave 3.
Key Level on Your Chart:
Wave 5 is projected to reach 22,400 (based on a 61.8% extension).
3. Fibonacci Levels and Wave Validation
Fibonacci Retracements:
Wave 2: Corrects 38.2%–61.8% of Wave 1.
Wave 4: Corrects 23.6%–50% of Wave 3.
Fibonacci Extensions:
Wave 3: Often extends 1.618x the length of Wave 1.
Wave 5: Projected at 0.618x or 1.0x the total move of Wave 1–3.
4. Validating the Elliott Wave Scenario
To ensure the waves on your chart follow the Elliott Wave principles:
Wave 2 does not retrace more than 100% of Wave 1.
Wave 3 is not the shortest of the three impulsive waves (1, 3, 5).
Wave 4 does not overlap the territory of Wave 1.
5. Observations and Projections
Based on your key levels:
Wave 3 successfully formed a strong impulse at 22,133.4.
Wave 4 retraced to 21,946.8, aligning with Fibonacci retracement levels.
Wave 5 is projected to reach approximately 22,400, based on the 61.8% Fibonacci extension.
6. Recommendations
Monitor Fibonacci levels to confirm Wave 5's target near 22,400.
Use indicators like RSI or MACD to detect divergences, signaling potential Wave 5 exhaustion.
Validate Elliott Wave rules to avoid misinterpretations.

Actionable Nasdaq insights: 17- Dec-2024Rise and shine, traders! Start your day with actionable Nasdaq insights. Let's grow your skills together, one chart at a time.

NASDAQ rally still has lots of upside before is tops.Nasdaq (NDX) is technically respecting the 2-year Channel Up that it's been trading in since the December 26 2022 market bottom. Its most recent Higher Low was on the August 05 2024 1W candle, which initiated the Bullish Leg we're currently in.
As you see, the previous two Bullish Legs had one main pull-back/ correction sequence each and apart from that, the majority of the Leg was technically a straight uptrend. Given that the current Bullish Leg already had a strong pull-back early on (August 26 - September 02 1W candles), it may continue to rise up to its target without another correction, assuming the 1D MA100 (red trend-line) holds.
If however it has another pull-back similar to the previous Bullish Leg (March 04 - April 15 2024), then it should rise some more near the 0.236 Fibonacci level and then pull-back.
In any event, the current level is technically a solid long-term buy entry and since both previous Bullish Legs have been around +48%, we expect to see 25300 before the current one tops.
-------------------------------------------------------------------------------
** Please LIKE 👍, FOLLOW ✅, SHARE 🙌 and COMMENT ✍ if you enjoy this idea! Also share your ideas and charts in the comments section below! This is best way to keep it relevant, support us, keep the content here free and allow the idea to reach as many people as possible. **
-------------------------------------------------------------------------------
💸💸💸💸💸💸
👇 👇 👇 👇 👇 👇

NASDAQ100 / US100 / US TECH Indices Market Bullish Heist PlanHello!! My Dear Robbers / Money Makers & Losers, 🤑 💰
This is our master plan to Heist NASDAQ100 / US100 / US TECH Indices Market based on Thief Trading style Technical Analysis.. kindly please follow the plan I have mentioned in the chart focus on Long entry. Our target is Red Zone that is High risk Dangerous level, market is overbought / Consolidation / Trend Reversal / Trap at the level Bearish Robbers / Traders gain the strength. Be safe and be careful and Be rich.
Entry 📈 : Can be taken Anywhere, What I suggest you to Place Buy Limit Orders in 15mins Timeframe Recent / Nearest Low Point take entry should be in pullback.
Stop Loss 🛑 : Recent Swing Low using 4H timeframe
Target 🎯 : 22400.0
Attention for Scalpers : Focus to scalp only on Long side, If you've got a lot of money you can get out right away otherwise you can join with a swing trade robbers and continue the heist plan, Use Trailing SL to protect our money 💰.
Warning : Fundamental Analysis news 📰 🗞️ comes against our robbery plan. our plan will be ruined smash the Stop Loss 🚫🚏. Don't Enter the market at the news update.
Loot and escape on the target 🎯 Swing Traders Plz Book the partial sum of money and wait for next breakout of dynamic level / Order block, Once it is cleared we can continue our heist plan to next new target.
💖Support, Like and follow our Robbery plan we can easily make money & take money 💰💵 Follow, Like & Share with your friends and Lovers. Make our Robbery Team Very Strong Join Ur hands with US. Loot Everything in this market everyday make money easily with Thief Trading Style.
Stay tuned with me and see you again with another Heist Plan..... 🫂

Will Nasdaq plummet be a success?US100/ Nasdaq seems to be shorting, Sellers seem to be at a higher volume than the Buyers on this asset right now
