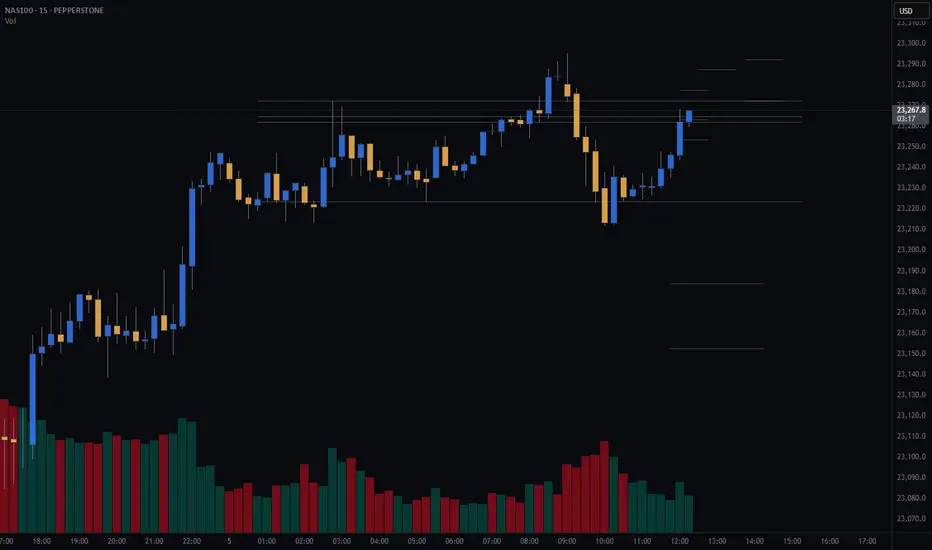
NASDAQ (CASH100) SHORT - head and shoulders 15minPotential short on nas100 (cash100) with head and shoulders on the 15min.
Still waiting for confirmation on some of my variables before I enter.
Risk/reward = 3.3
Entry price = 23 262
Stop loss price = 23 287.3
Take profit level 1 (50%) = 23 184
Take profit level 2 (50%) = 23 153
What do you guys and girls think the nasdaq is going to do?
Nasdaqtrader
NASDAQ (CASH100) SHORT - Head and shoulders H1Risk/reward = 3.8
Entry price = 23 167.9
Stop loss price = 23 232.8
Take profit level 1 (50%) = 22 943
Take profit level 2 (50%) = 22 878
Still waiting on confirmation on some variables in checklist

NASDAQ Outlook: Waiting for a Catalyst in a Range-Bound Market!The NASDAQ NAS100 has shown impressive gains recently 📈, but overall sentiment remains cautious 😐 as the market consolidates and trades sideways in the short term 🔄. Investors seem to be waiting for a new catalyst—such as major economic data or policy announcements 📰—before committing to a clear direction.
Ongoing political and economic uncertainties, including trade negotiations 🤝, interest rate outlooks 💸, and valuation concerns 💰, are keeping market participants on edge. Given these factors, the near-term environment is likely to remain choppy and range-bound 🌊. As traders, it’s important to approach the markets with caution ⚠️, especially as equities approach key resistance areas 🚧. This uncertainty may also impact currency and other financial markets 💱. While tech stocks could eventually break out of the current range 💻, the direction is still unclear. Prioritize risk management and protect your capital during this period of heightened uncertainty 🛡️.
Political and economic uncertainties—like ongoing trade negotiations, interest rate expectations, and concerns about valuations—are keeping investors on edge.
The near-term outlook for the US100 is for choppy, range-bound trading as the market works through these uncertainties.

Actionable Nasdaq insights: 28-May-2025Rise and shine, traders! Start your day with actionable Nasdaq insights. Let's grow your skills together, one chart at a time.

Nasdaq market analysis: 28-APRIL-2025Good morning. Welcome to today's Nasdaq market analysis and educational insights for price action traders.

NASDAQ MEGA BOUNCE ZONEI want to see a super bounce from this demand zone tomorrow due to the recent reactions around this price level. Lots of interest being shown here. I am sized in pretty heftily on MNQ futures. In a $0 or HERO position. WIll be closing my laptop now...

Nasdaq analysis: 17-APRIL-2025Good morning, traders! Today's Nasdaq analysis will help you achieve your trading goals. Let's work together towards success.

Nasdaq market analysis: 01-APRIL-2025Good morning! Happy New Day! Here's your daily Nasdaq market analysis. Learn, grow, and trade wisely.

Nasdaq analysis: 27-MAR-2025Good morning, traders! Today's Nasdaq analysis will help you achieve your trading goals. Let's work together towards success.

Possible push down for NAS100After A strong Bearish push, price action is filling the inefficiency left behind. Price is currently testing the structure lows previous support. The bearish move and retracement is the 78.6% PRZ
Wait for your lower time frame play to enter. This is an over all counter trend trade, however this could have a nice quick move down to retest the Daily previous structure high area of 21,843
Daily Chart has a Bearish Divergence that is playing out.
**Caution** on the macro bullish trend, this recent pull back retraced back to the 23.6 lvl with a wick while "retesting" the previous structure high on the H4 time frame....Enter with caution.

Nasdaq analysis: 04-Feb-2025Good morning, trading community! Today's Nasdaq analysis is for you. Share your thoughts, ask questions, and let me help you grow.

Nasdaq analysis: 21-Jan-2025Good morning, traders! Today's Nasdaq analysis will help you achieve your trading goals. Let's work together towards success.

Nasdaq market analysis: 10-Jan-2025Let’s dive into today's Last Nasdaq market analysis 2024. Share insights, and potentially spot opportunities for good pips.

Actionable Nasdaq insights: 30-Dec-2024Rise and shine, traders! Start your day with actionable Nasdaq insights. Let's grow your skills together, one chart at a time.

Actionable Nasdaq insights: 27-Dec-2024Rise and shine, traders! Start your day with Actionable Nasdaq insights. Let's grow your skills together, one chart at a time.

Nasdaq market analysis: 23-Dec-2024Good morning, traders! Welcome to today's Nasdaq market analysis. Compare my price action insights with your own charts and enhance your trading skills.

Nasdaq market analysis: 19-Dec-2024Good morning! Join me for today's Nasdaq market analysis. Share your charts, ask questions, and let's discuss trading strategies.

Nasdaq market analysis: 16-Dec-2024Good morning, traders! Welcome to today's Nasdaq market analysis. Compare my price action insights with your own charts and enhance your trading skills.

Nasdaq Analysis: 13-DEC-2024Nasdaq trading insights: Not signals, but informative zones to aid your decision-making. Please note: These zones are not trading advice. Use them as a starting point for your own analysis.

Nasdaq Market Analysis: 12-Dec-2024Nasdaq trading insights: Not signals, but informative zones to aid your decision-making. Please note: These zones are not trading advice. Use them as a starting point for your own analysis.

Nasdaq analysis: 11-Dec-2024Good morning, everyone! Today's Nasdaq analysis is designed to educate and empower. Use these insights to refine your price action trading strategy.

Nasdaq Analysis: 10-Dec-2024Good morning, everyone! Today's Nasdaq analysis is designed to educate and empower. Use these insights to refine your price action trading strategy.

Nasdaq market analysis: 04-DEC-2024Good morning, traders! Welcome to today's Nasdaq market analysis. Compare my price action insights with your own charts and enhance your trading skills. Pardon my sound.
