NAS100 - Will the Stock Market Reach Its Previous High?!The index is trading above the EMA200 and EMA50 on the four-hour timeframe and is trading in its ascending channel. If the trend line is broken, I expect corrective moves, but if the index corrects towards the demand zone, we can look for further buying positions in Nasdaq with a risk-reward ratio. Maintaining this trend line will lead to a continuation of the Nasdaq upward trend.
The strong rally in U.S. equities that had pushed the S&P 500 close to record highs for 2025 came to a halt on Friday, following the release of disappointing consumer sentiment data. A report from the University of Michigan revealed a drop in consumer confidence and a surge in inflation expectations to levels not seen in decades—factors that have amplified concerns about the economy’s outlook.
Despite this, some analysts remain hopeful that robust corporate earnings and the temporary suspension of tariffs could provide needed support for the market. Meanwhile, rating agency Moody’s warned that U.S. federal debt is projected to climb to 134% of GDP by 2035, up from 98% in 2024.
Moody’s noted that while the U.S. economy and financial system remain strong, the weakening of certain fiscal indicators has diminished the ability of these strengths to offset negative effects. According to their analysis, trade tariffs will not significantly impact long-term U.S. economic growth, and substantial changes in mandatory spending are unlikely in the near future.
Although the U.S. credit rating has been downgraded, the country’s long-term domestic and foreign credit ceilings remain at AAA. However, Moody’s has revised the overall credit rating for the U.S. down from AAA to Aa1.
One noteworthy detail is that since April 21, the index has seen only one negative trading day—May 9, which experienced only a slight decline. Falling Treasury yields have reduced some market risks, while Donald Trump’s trip to the Middle East has also helped ease political tensions at home. The market clearly reflects growing investor appetite for risk, though the possibility of a correction at these levels remains real.
Looking ahead to this week, traders will closely monitor preliminary purchasing managers’ index (PMI) data for May on Thursday. They will also pay attention to speeches from several Federal Reserve officials to gauge whether the Fed remains focused on economic growth or has shifted more attention to inflation, especially in light of recent U.S.-China trade agreements.
A rise in PMI figures may suggest that business sentiment has improved since tensions eased between the U.S. and China, but investors are also eager for clear guidance on the Fed’s next policy steps. Key speakers include John Williams (New York Fed), Raphael Bostic (Atlanta Fed), Lorie Logan (Dallas Fed), and Mary Daly (San Francisco Fed). If these officials continue to express concerns about elevated inflation risks, the U.S. dollar could continue to strengthen, as markets may price in fewer rate cuts ahead.
As for the equity markets, their reaction remains uncertain. Recently, equities have risen even as expectations for rate cuts have diminished—primarily due to a reduced fear of recession following tariff adjustments. However, with recession fears now less pronounced and a growing narrative around sustained higher rates due to sticky inflation, Wall Street may pull back if Fed officials emphasize upside inflation risks.
In related news, President Donald Trump harshly criticized Walmart’s pricing strategy, stating that the company should absorb the cost of tariffs rather than passing them onto consumers. In a public statement, Trump pointed out that Walmart made billions in profit last year and argued that American shoppers should not bear the burden of higher prices caused by trade tariffs.
Trump also implicated China in the issue, stating that either Walmart or China should take responsibility for these added costs. He warned that both he and consumers are closely watching how Walmart handles the situation.
Nasdq

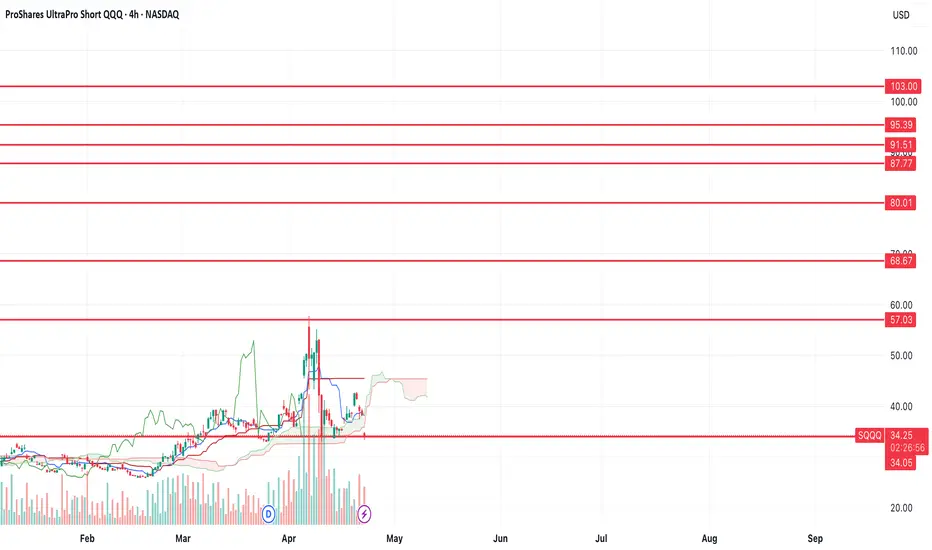
$SQQQ - $68-103 targetIf we look at the chart of SQQQ, we can see that we're holding support here at the $34 level.
If we continue to hold here, we'll have a failed head and shoulders breakdown. I think if we can break the highs at $57, it is very likely that we'll see $68+.
Let's see how it plays out in the coming weeks.
$TSLA RETEST $250 TO CONFIRMThe NASDAQ:TSLA experienced a rapid surge without any accompanying news.
It's expected to retest the $250 level, after which a further evaluation will be necessary to determine its next move.
SELL NOW AND BUY LATER

Us100 Upward or downward?In the 5-minute timeframe, you can sell at the top of the trading range and buy at the bottom of the trading range (by observing reversal candles and patterns).
Alternatively, you can wait for a breakout and enter in the direction of the breakout.
Be mindful of fake breakouts.

OH NO GUESS WHAT I FOUND $TSLA HEAD AND SHOULDERThe head and shoulders pattern is a chart formation in technical analysis that signals possible trend reversals, often suggesting a change from a bullish to a bearish trend. It features three peaks: a central "head" that is the highest, flanked by two "shoulders," with a neckline connecting the troughs between these peaks.
Tesla's stock is often viewed as a risky investment for several reasons:
High Valuation: NASDAQ:TSLA stock price is considered very high compared to traditional car manufacturers, with a much higher price-to-earnings ratio.
Market Volatility: The NASDAQ:TLSA price is highly volatile, influenced by factors like CEO Elon Musk's public comments, regulatory changes, and overall market sentiment.
Intense Competition: The electric vehicle market is becoming more competitive, with many established and new companies investing heavily in EV technology.
Production Issues: Tesla has experienced production and supply chain challenges, which can affect its ability to meet demand and maintain profitability.
Regulatory Risks: Changes in government policies and regulations, especially those related to environmental standards and EV incentives, can significantly impact Tesla's business.
While these points highlight potential risks, Tesla also has strengths such as strong brand recognition, technological innovation, and leadership in the EV market. It's important to consider both the risks and potential rewards when evaluating Tesla as an investment.
SELLL NOW!!!!!

NAS100 - Stock Market Enters Downtrend?!The index is trading below the EMA200 and EMA50 on the four-hour timeframe and is trading in its descending channel. If the index moves down towards the specified demand zone, we can look for further buying opportunities in Nasdaq. A break of the channel ceiling will also continue the short-term upward trend in Nasdaq.
According to EPFR data reported by Bank of America, investors withdrew $2.8 billion from equity funds last week, marking the largest outflow of the year so far. Meanwhile, U.S. government bonds saw an inflow of $6.4 billion, the biggest weekly increase since August.
Scott Basnett, the U.S. Treasury Secretary, stated in an interview that there are no guarantees to prevent an economic recession. He welcomed the decline in stock markets, viewing it as a sign of a healthy market. Analysts believe this shift in tone—unusual for a Treasury Secretary who typically reassures economic strength—suggests an effort to prepare the public for a possible recession.
According to data from the Polymarket betting platform, the probability of a U.S. recession in 2025 is currently estimated at 41%. Reuters reports that American households are increasingly pessimistic about the economic outlook. However, the Federal Reserve may be reluctant to respond aggressively to a weakening economy, given growing concerns that the Trump administration’s trade policies could further fuel inflation.
These concerns were reflected in financial markets on Friday, as the University of Michigan’s consumer sentiment survey showed a decline in consumer confidence for March. Additionally, consumers now expect inflation to reach 3.9% over the next five years, the highest level in more than 30 years.
In an interview with Breitbart, Basnett emphasized the need to remain vigilant against persistent Biden-era inflation and expressed support for deregulation to lower costs. He also stressed that while tackling inflation, the government must also address affordability concerns. Additionally, he backed interest rate cuts to help reduce housing costs and auto loan payments.
This week will be packed with major economic events, creating a high-risk environment for precious metals traders amid ongoing geopolitical developments during Trump’s second term.
Central banks are back in the spotlight, as several key monetary institutions are set to announce their policy decisions in the coming days:
• Tuesday: Bank of Japan
• Wednesday: Federal Reserve
• Thursday: Swiss National Bank & Bank of England
Furthermore, a series of macroeconomic data releases could influence market sentiment, including:
• Monday: Retail sales & Empire State Manufacturing Index
• Tuesday: Housing starts & building permits
• Thursday: Weekly jobless claims, existing home sales & Philadelphia Fed Manufacturing Index
The Federal Reserve is expected to keep interest rates unchanged in its upcoming meeting. Market participants will closely watch the Fed’s updated economic projections and Jerome Powell’s press conference for insights into future monetary policy.
According to a Bloomberg survey, economists anticipate two rate cuts by the Fed this year, likely starting in September. However, despite declining stock indices and rising recession concerns, Powell is expected to maintain a cautious stance, avoiding any rushed rate cuts.
While consumer and business confidence has weakened, the Federal Reserve has limited flexibility to lower rates due to persistently high inflation indicators.

PACS GROUPPACS GROUP
One of the stocks identified in the IBD 50 index.
This is a a recent IPO.
A first long leg show an gain of 83%
A recent consolidation with higher lows and volatility contraction (VCP).
Entry 1: 39
Entry 2: 41
Entry 3: on breakout: 42
Stop loss: 37.86 (1 ATR = 0.5% of the capital)
The idea is to build a position step/step, manage the risk of portfolio, the stop loss shall be raised up after Entry 2, Entry 3, to keep a risk around 0.5% of the capital equal to 1 Average True range (ATR)
Conclusion: looks correct opportunity, to be followed up for a possible trade to build up.

NQ1! - Mini Futures NASDAQGood morning,
Weekly chart with ichimoku.
We notice that the close of the week is above the trend line.
To confirm the movement, the Chikou must break the right.
Make up your mind.


A brutal movement in the price action of FORD
During my thorough analysis of FORD's 4-hour price action, an intriguing revelation emerged: a hidden bullish divergence, a distinct pattern that warrants attention. This intriguing phenomenon is characterized by the following indicator values:
- A price of $11.29 accompanied by a Relative Strength Index (RSI) of 38.96.
- Another price point at $11.99 coupled with an RSI reading of 18.84.
The RSI was more oversold at 11.99 $ then it was at 11.29 $ indicating that this was an overall uptrend and we now that if something is oversold, it should continue up and there you have your confirmation for your uptrend continuation making this a good place to enter.
Also please note that I would usually use the RSI on a 1H time frame to find these divergences, but here we have been able to detect them on a higher time frame such as the 4H which means that this is a more higher and accurate signal compared to the other regular one which makes these a more confident trade!


US500 WEEKLY ANALYSIS Next week we will see a break in resistance to continue to Supply Zone or a rejection of the price for a reversal to demand zone

About to pull the rugI don't think price is going to break up this time, most likely to pull back and maybe try again in a few weeks. I have some puts just in case.

Nasdaq Breakdown Analysis 12/04/2023Dear traders Nasdaq was so crazy today it tried to escape from any zone so I expect Nasdaq if he breaks above 13023 and close bullish you should look for buy and if he breaks below 12955 and close bearish you should look for sell we should all be careful tomorrow we have billon cpi and. Fed so don’t go crazy
Take the good chance and good luck

nasdaq on daily time frame bullish Rally Upcoming soon nasdaq is bullish on daily time frame
because it als break the channel and goin complete it D of Bat Pattern of Harmonic ...
DYOR

Nasdaq also break the channel ,also in last phase of AccumumulanNasdaq is bullish in upcoming weeks beacause it also break the channel ,and also in last phase of Accumumulan 2
so we are at buckle up phase huge rally coming soon ..


NASDQAre we looking to bearish market continue?!
lets see how price will react after reaching the mounted levels of Fibo and previous support line
Its a great chance to take it, only if you manage your risk ratio.

NAS100 possible bullish move!Currency Pair : NAS100
Possible direction : Bullish
Technical Analysis : Price has broken out of the resistance level after grabbing strong liquidity from the support level. Currently price testing the previous resistance turned support and upon rejection, price may continue to rise the weekly 61.8% fib level.
Possible trade recommendation : Bullish as per sketch
Press like button if you enjoy.
Risk Disclaimer: Trading foreign exchange on margin carries a high level of risk, and is not suitable for all investors. Past performance is not indicative of future results. The high degree of leverage is dangerous and can work against you as well as for you. Before deciding to invest in foreign exchange or any market you should carefully consider your investment goals, level of experience, and risk tolerance. It is EXTREMELY LIKELY that you will sustain a loss of some or all of your initial investment and therefore you should not invest money that you cannot afford to lose. No representation is being made that any account will or is likely to achieve profits or losses. Past performance is not indicative of future results. Individual results vary and no representation is made that clients will or are likely to achieve profits or incur losses comparable to those that may be shown. You acknowledge and agree that no promise or guarantee of success or profitability has been made between you, and Forex Trading Wizard. Do your own research and talk to a professional financial planner in order to be aware of all the risks associated with foreign exchange trading and investing and seek advice from an independent financial advisor before risking any capital.

S&P500: Rising Wedge, SIgn of Potential Stock Crash Ahead?Hello Fellow Global Investor/Trader, Here's a Technical outlook on S&P500!
Chart Perspective
S&P500 rebounded on the bearish trendline. Furthermore, The index has broken out of the rising wedge pattern, indicating a potential bearish bias ahead. The momentum indicator also confirmed the possible bearish bias by forming the death cross. Therefore, we conclude there is possible downside movement to the target area.
All other explanations are presented on the chart.
The roadmap will be invalid after reaching the target/resistance area.
"Disclaimer: The outlook is only for educational purposes, not a recommendation to put a long or short position on the S&P500"
Support the channel by giving us a thumbs up and sharing your opinions in the comment below!

SPX 500 LOOKS BULLISH MAKET LOOKS PURE BULL 4200 IS MONTHLY TARGET
options price will move more volatile

nasdaq formed Bearish Gartlay Pattern on 1 Hour time frame..nasdaq formed Bearish Gartlay Pattern on 1 Hour time frame..
not a financial advice

Long NAS100There is a bullish divergence indication by Awesome oscillator and there are multiple rejection at a crucial support area from where the price has bounced before. So this clearly indicates end of the down trend. So you can go long on NAS100 and set target at the recent POI ( point of interest ).
