Turbulent Times Ahead for Natural Gas MarketNatural gas prices began the week with a gap-up, driven by forecasts of colder weather increasing demand, but have since faced strong selling pressure, making traders cautious.
◉ Technical Analysis
● A bullish turnaround seems imminent for Natural Gas prices, highlighted by the appearance of an Inverted Head & Shoulder pattern on the daily chart.
● After breaking out, the price momentarily reached the $3.290 resistance level before retreating and revisiting the breakout point.
● The price is now attempting to breach the resistance zone again, with expectations of exceeding the level soon.
● However, a drop below $2.800 could trigger a further correction.
◉ Overall Outlook
Natural gas prices are poised for a volatile week as traders weigh colder weather expectations against bearish technical signals. Thursday's inventory data will be crucial in determining the next price move.
Natgas

Natural gas is in the Selling directionHello Traders
In This Chart NATGAS HOURLY Forex Forecast By FOREX PLANET
today NATGAS analysis 👆
🟢This Chart includes_ (NATGAS market update)
🟢What is The Next Opportunity on NATGAS Market
🟢how to Enter to the Valid Entry With Assurance Profit
This CHART is For Trader's that Want to Improve Their Technical Analysis Skills and Their Trading By Understanding How To Analyze The Market Using Multiple Timeframes and Understanding The Bigger Picture on the Charts

NATGAS BULLISH BIAS|LONG|
✅NATGAS fell again to retest the support of 3.20$
But it is a strong key level
So I think that there is a high chance
That we will see a bullish rebound and a move up
LONG🚀
✅Like and subscribe to never miss a new idea!✅

NATGAS: Bearish Forecast & Outlook
The charts are full of distraction, disturbance and are a graveyard of fear and greed which shall not cloud our judgement on the current state of affairs in the NATGAS pair price action which suggests a high likelihood of a coming move down.
❤️ Please, support our work with like & comment! ❤️

NATGAS What Next? SELL!
My dear subscribers,
My technical analysis for NATGAS is below:
The price is coiling around a solid key level - 3.106
Bias - Bearish
Technical Indicators: Pivot Points Low anticipates a potential price reversal.
Super trend shows a clear sell, giving a perfect indicators' convergence.
Goal - 3.067
About Used Indicators:
By the very nature of the supertrend indicator, it offers firm support and resistance levels for traders to enter and exit trades. Additionally, it also provides signals for setting stop losses
———————————
WISH YOU ALL LUCK

NATGAS Will Grow! Buy!
Hello,Traders!
NATGAS made a retest of
The horizontal support level
Of 3.00$ and we are already
Seeing a local bullish rebound
So we will be expecting a
Further bullish move up
Buy!
Comment and subscribe to help us grow!
Check out other forecasts below too!

NATGAS BULLISH REBOUND AHEAD|LONG|
✅NATGAS will be retesting a support level of 3.128$ soon
From where I am expecting a bullish reaction
With the price going up but we need
To wait for a reversal pattern to form
Before entering the trade, so that we
Get a higher success probability of the trade
LONG🚀
✅Like and subscribe to never miss a new idea!✅

NATGAS Support Ahead! Buy!
Hello,Traders!
NATGAS is going down to
Retest the horizontal support
Of 3.09$ and as we are
Locally bullish biased
We will be expecting a
Local bullish rebound
Buy!
Comment and subscribe to help us grow!
Check out other forecasts below too!

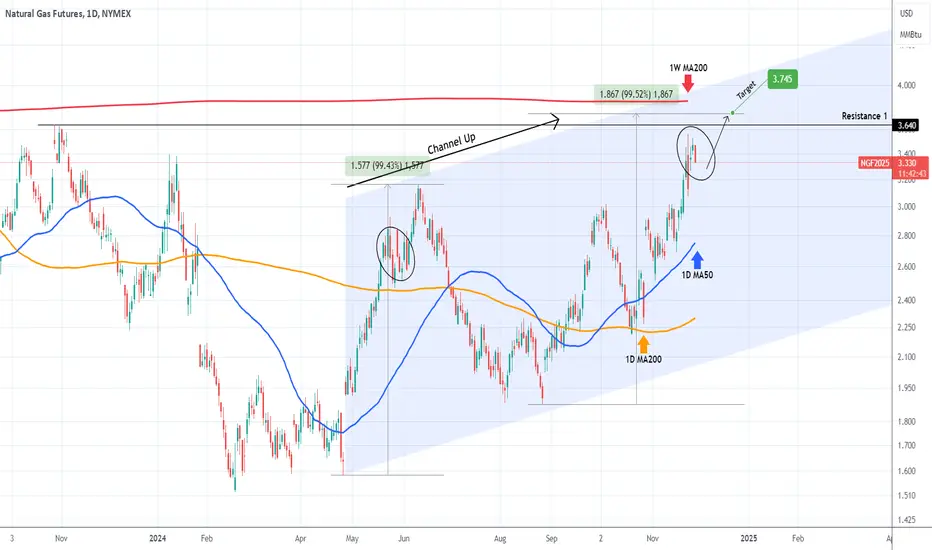
NATURAL GAS Final push before peakingNatural Gas (NG1!) rose and hit our 2.900 Target called on our last analysis (August 29, see chart below) and after a pull-back, broke above the Triangle:
The Triangle transitioned to a Channel Up and the price is already near the end of its Bullish Leg. The 1W MA200 (red trend-line) is the long-term Resistance (untouched since January 17 2023) so only above it can we justify a new bullish trend.
Until then, our Target is 3.745, which represents a +99.50% rise from the last Higher Low, which is the same % rise as the first Bullish Leg of the Channel Up.
-------------------------------------------------------------------------------
** Please LIKE 👍, FOLLOW ✅, SHARE 🙌 and COMMENT ✍ if you enjoy this idea! Also share your ideas and charts in the comments section below! This is best way to keep it relevant, support us, keep the content here free and allow the idea to reach as many people as possible. **
-------------------------------------------------------------------------------
💸💸💸💸💸💸
👇 👇 👇 👇 👇 👇
NATGAS SHORT FROM RESISTANCE|
✅NATGAS is going up now
But a strong resistance level is ahead of 3.646$
Thus I am expecting a pullback
And a move down towards the target at 3.300$
SHORT🔥
✅Like and subscribe to never miss a new idea!✅

Natural Gas - Bullish Momentum Re-rating?The last few weeks have been huge for Natural Gas NYMEX:NG1!
...But why are Natural Gas futures up over 20%?
Here are some potential reasons:
Colder than Forecasted Winter coming for the US
Trump Administration favorable of Natural Gas as future energy source
Purchase Spree by Funds with existing net short Positions
Although the Natural Gas market in its entirety is complex, these reasons do present as potential catalysts to an appreciating price environment.
But is there potential for further upside going forward?
Looking at the chart, we can see a recent breakout attempt above the $3.2 region - This has resulted in an official re-rating of momentum to 'Bullish', as signified by the blue symbol (IMO).
Our Price Guide:
Upside continuation potential if price can hold above $3.400
Significant bearish continuation risk potential if price retreats back below the $3.076 mark
We're inspired to bring you the latest developments across worldwide markets, helping you look in the right place, at the right time - We will continue to monitor the Natural Gas market in the event there are any rapid changes.
Thank you for reading! Stay tuned for further updates, and we look forward to being of service along your trading & investing journey...
Please note all information contained within this post is strictly for informational purposes only and is not intended to be investment advice. DYOR & Consult your licensed financial advisors before acting on any information contained within this post.
Love & Wisdom,

Natural gas is in the Selling direction Hello Traders
In This Chart NATGAS HOURLY Forex Forecast By FOREX PLANET
today NATGAS analysis 👆
🟢This Chart includes_ (NATGAS market update)
🟢What is The Next Opportunity on NATGAS Market
🟢how to Enter to the Valid Entry With Assurance Profit
This CHART is For Trader's that Want to Improve Their Technical Analysis Skills and Their Trading By Understanding How To Analyze The Market Using Multiple Timeframes and Understanding The Bigger Picture on the Charts

NATGAS REBOUND AHEAD|LONG|
✅NATGAS is approaching a demand level around 3.00$
So according to our strategy
We will be looking for the signs of the reversal in the trend
To jump onto the bearish bandwagon just on time to get the best
Risk reward ratio for us
LONG🚀
✅Like and subscribe to never miss a new idea!✅

NATGAS Set To Fall! SELL!
My dear friends,
My technical analysis for NATGAS is below:
The market is trading on 3.122 pivot level.
Bias - Bearish
Technical Indicators: Both Super Trend & Pivot HL indicate a highly probable Bearish continuation.
Target - 2.910
Recommended Stop Loss - 3.241
About Used Indicators:
A pivot point is a technical analysis indicator, or calculations, used to determine the overall trend of the market over different time frames.
———————————
WISH YOU ALL LUCK

NATGAS BULLISH BREAKOUT|LONG|
✅NATGAS is trading in an
Uptrend and we are seeing
A bullish breakout which
Makes us bullish biased and
We will be expecting a
Further move up
LONG🚀
✅Like and subscribe to never miss a new idea!✅

NATGAS Risky Short! Sell!
Hello,Traders!
NATGAS is about to retest
A horizontal resistance
Of 3.024$ from where
We will be expecting
A local bearish correction
Sell!
Like, comment and subscribe to help us grow!
Check out other forecasts below too!

NATGAS Set To Fall! SELL!
My dear friends,
Please, find my technical outlook for NATGAS below:
The price is coiling around a solid key level -2.837
Bias - Bearish
Technical Indicators: Pivot Points Low anticipates a potential price reversal.
Super trend shows a clear sell, giving a perfect indicators' convergence.
Goal - 2.760
About Used Indicators:
The pivot point itself is simply the average of the high, low and closing prices from the previous trading day.
———————————
WISH YOU ALL LUCK

NATGAS: Bears Will Push
Balance of buyers and sellers on the NATGAS pair, that is best felt when all the timeframes are analyzed properly is shifting in favor of the sellers, therefore is it only natural that we go short on the pair.
❤️ Please, support our work with like & comment! ❤️

NATGAS Set To Grow! BUY!
My dear followers,
I analysed this chart on NATGAS and concluded the following:
The market is trading on 2.665 pivot level.
Bias - Bullish
Technical Indicators: Both Super Trend & Pivot HL indicate a highly probable Bullish continuation.
Target - 2.739
About Used Indicators:
A super-trend indicator is plotted on either above or below the closing price to signal a buy or sell. The indicator changes color, based on whether or not you should be buying. If the super-trend indicator moves below the closing price, the indicator turns green, and it signals an entry point or points to buy.
———————————
WISH YOU ALL LUCK

Natural Gas Oil, Dollar, Silver, Gold Price ForecastNatural Gas stock Bulls
Gold OANDA:XAUUSD Stock Forecast
Silver OANDA:XAGUSD

Natural Gas still coiling! breakdown or breakout? Hello Traders
In This Chart NATGAS HOURLY Forex Forecast By FOREX PLANET
today NATGAS analysis 👆
🟢This Chart includes_ (NATGAS market update)
🟢What is The Next Opportunity on NATGAS Market
🟢how to Enter to the Valid Entry With Assurance Profit
This CHART is For Trader's that Want to Improve Their Technical Analysis Skills and Their Trading By Understanding How To Analyze The Market Using Multiple Timeframes and Understanding The Bigger Picture on the Charts

NATGAS: Bullish Continuation is Expected! Here is Why:
Our strategy, polished by years of trial and error has helped us identify what seems to be a great trading opportunity and we are here to share it with you as the time is ripe for us to buy NATGAS.
❤️ Please, support our work with like & comment! ❤️

NG, prepping for a multi weekly gain come December 2023NG based on monthly data is registering very significant net buy volume at the current price range.
Seller's strength is certainly fading out based on thinning price volatility this past few days / weeks -- as shown on yellow price lines on chart.
NG is currently sitting at a strong major support at 2.0 to 2.5 area, a 1.0 FIB discount level -- this is where most buyers converge.
Initial trend shift has been spotted at the present price range.
Spotted at 2.50
TAYOR
Safeguard capital always.
