NATGAS The Target Is DOWN! SELL!
My dear followers,
I analysed this chart on NATGAS and concluded the following:
The market is trading on 2.525pivot level.
Bias - Bearish
Technical Indicators: Both Super Trend & Pivot HL indicate a highly probable Bearish continuation.
Target - 2.384
About Used Indicators:
A super-trend indicator is plotted on either above or below the closing price to signal a buy or sell. The indicator changes color, based on whether or not you should be buying. If the super-trend indicator moves below the closing price, the indicator turns green, and it signals an entry point or points to buy.
———————————
WISH YOU ALL LUCK
Natgas

Natural Gas still coiling! breakdown or breakout?Hello Traders
In This Chart NATGAS HOURLY Forex Forecast By FOREX PLANET
today NATGAS analysis 👆
🟢This Chart includes_ (NATGAS market update)
🟢What is The Next Opportunity on NATGAS Market
🟢how to Enter to the Valid Entry With Assurance Profit
This CHART is For Trader's that Want to Improve Their Technical Analysis Skills and Their Trading By Understanding How To Analyze The Market Using Multiple Timeframes and Understanding The Bigger Picture on the Charts
NATGAS: Bears Will Push
The charts are full of distraction, disturbance and are a graveyard of fear and greed which shall not cloud our judgement on the current state of affairs in the NATGAS pair price action which suggests a high likelihood of a coming move down.
❤️ Please, support our work with like & comment! ❤️

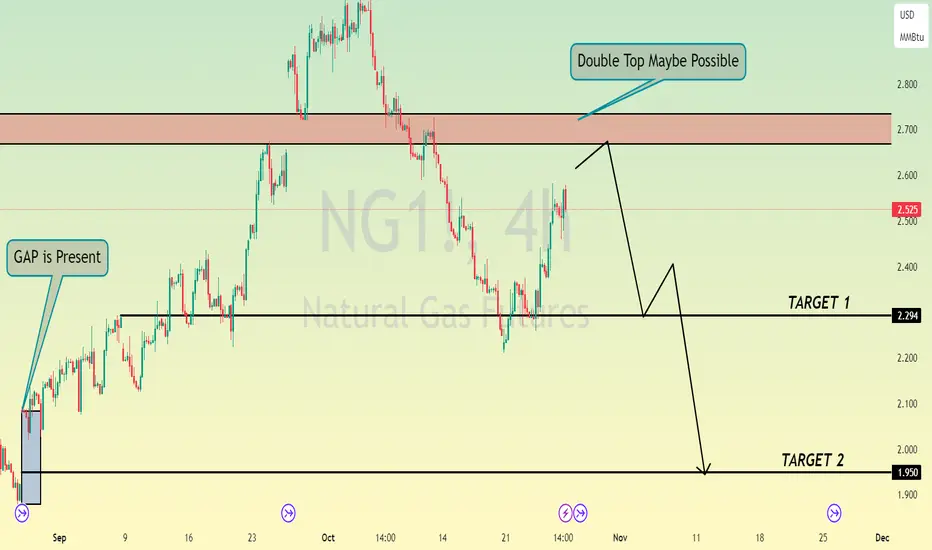
NATGAS RESISTANCE AHEAD|SHORT|
✅NATGAS is going up now
But a strong resistance level is ahead at 2.55$
Thus I am expecting a pullback
And a move down towards the target at 2.40$
SHORT🔥
✅Like and subscribe to never miss a new idea!✅

NATGAS Local Risky Long! Buy!
Hello,Traders!
NATGAS has hit a horizontal
Support level of 2.20$ from
Where we are seeing a bullish
Rebound and we will be
Expecting a further move up
Buy!
Like, comment and subscribe to help us grow!
Check out other forecasts below too!

NATGAS RISKY LONG|
✅NATGAS retested the strong support level of 2.215$
After trading in a local downtrend from some time
Which makes a bullish rebound a likely scenario
With the target being a local resistance above at 2.331$
LONG🚀
✅Like and subscribe to never miss a new idea!✅

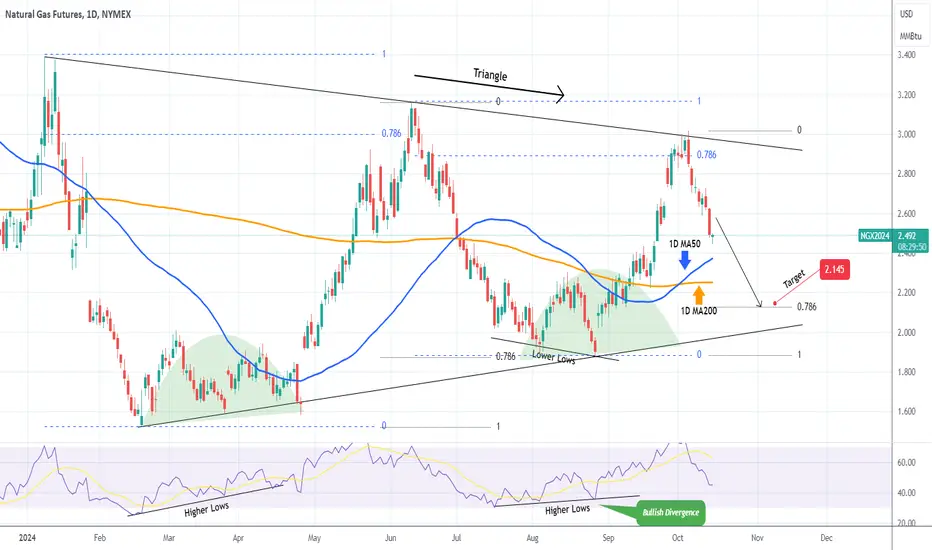
NATURAL GAS on a Bearish Leg. Still a sell signal.Natural Gas (NG1!) gave us an excellent buy opportunity last time (August 29, see chart below) and easily hit our 2.900 Target:
Once it hit the 0.786 Fibonacci retracement level (blue) it formed a Lower High at the top of the Triangle pattern and got rejected. The previous Lower High rejection that started the Bearish Leg, bottomed on the Higher Lows trend-line of the Triangle on the 0.786 Fib (black trend-line).
As a result we remain bearish on NG, targeting 2.145 (0.786 Fib).
-------------------------------------------------------------------------------
** Please LIKE 👍, FOLLOW ✅, SHARE 🙌 and COMMENT ✍ if you enjoy this idea! Also share your ideas and charts in the comments section below! This is best way to keep it relevant, support us, keep the content here free and allow the idea to reach as many people as possible. **
-------------------------------------------------------------------------------
💸💸💸💸💸💸
👇 👇 👇 👇 👇 👇
NATGAS_4Hhello
Natural gas analysis Analysis based on Elliott waves The market is forming wave 4 of correction. The bottom of wave 4 can be considered the range of 2.700 and by maintaining the high price of this number, it can form an upward wave. The target of wave 5 can be considered as 3.333.

NATGAS: Long Signal Explained
NATGAS
- Classic bullish setup
- Our team expects bullish continuation
SUGGESTED TRADE:
Swing Trade
Long NATGAS
Entry Point - 2.628
Stop Loss - 2.519
Take Profit - 2.824
Our Risk - 1%
Start protection of your profits from lower levels
❤️ Please, support our work with like & comment! ❤️

NATGAS Sellers In Panic! BUY!
My dear followers,
I analysed this chart on NATGAS and concluded the following:
The market is trading on 2.628 pivot level.
Bias - Bullish
Technical Indicators: Both Super Trend & Pivot HL indicate a highly probable Bullish continuation.
Target - 2.778
Safe Stop Loss - 2.529
About Used Indicators:
A super-trend indicator is plotted on either above or below the closing price to signal a buy or sell. The indicator changes color, based on whether or not you should be buying. If the super-trend indicator moves below the closing price, the indicator turns green, and it signals an entry point or points to buy.
———————————
WISH YOU ALL LUCK

Natural Gas still coiling! breakdown or breakout? Hello Traders
In This Chart NATGAS HOURLY Forex Forecast By FOREX PLANET
today NATGAS analysis 👆
🟢This Chart includes_ (NATGAS market update)
🟢What is The Next Opportunity on NATGAS Market
🟢how to Enter to the Valid Entry With Assurance Profit
This CHART is For Trader's that Want to Improve Their Technical Analysis Skills and Their Trading By Understanding How To Analyze The Market Using Multiple Timeframes and Understanding The Bigger Picture on the Charts

NATURAL GAS: Peak reversal. Strong sell signal.Natural Gas is about to turned neutral on its 1D technical outlook (RSI = 58.678, MACD = 0.175, ADX = 30.811), previously from an overbough state, as it made a standard LH rejection at the top of a year long Triangle pattern. The 1D RSI peaked like all prior LH, the 1D MACD is forming a Bearish Cross (again like all prior LH), so we have a prime sell signal in our hands. Common target on all was the 1.786 Fibonacci extension (TP = 2.165).
## If you like our free content follow our profile to get more daily ideas. ##
## Comments and likes are greatly appreciated. ##

NATGAS Trading Opportunity! BUY!
My dear subscribers,
NATGAS looks like it will make a good move, and here are the details:
The market is trading on 2.831 pivot level.
Bias - Bullish
Technical Indicators: Both Super Trend & Pivot HL indicate a highly probable Bullish continuation.
Target - 2.922
About Used Indicators:
The average true range (ATR) plays an important role in 'Supertrend' as the indicator uses ATR to calculate its value. The ATR indicator signals the degree of price volatility.
———————————
WISH YOU ALL LUCK

NATGAS: Bulls Will Push
Our strategy, polished by years of trial and error has helped us identify what seems to be a great trading opportunity and we are here to share it with you as the time is ripe for us to buy NATGAS.
❤️ Please, support our work with like & comment! ❤️

NATGAS: Will Keep Falling! Here is Why:
Our strategy, polished by years of trial and error has helped us identify what seems to be a great trading opportunity and we are here to share it with you as the time is ripe for us to sell NATGAS.
❤️ Please, support our work with like & comment! ❤️

NATGAS Trading Opportunity! SELL!
My dear friends,
My technical analysis for NATGAS is below:
The market is trading on 2.921 pivot level.
Bias - Bearish
Technical Indicators: Both Super Trend & Pivot HL indicate a highly probable Bearish continuation.
Target - 2.748
About Used Indicators:
A pivot point is a technical analysis indicator, or calculations, used to determine the overall trend of the market over different time frames.
———————————
WISH YOU ALL LUCK

Natural Gas Goes Kaboom!Profits have been secured I the Natural gas trade. That being said I still think Nat gas equities can push higher.
On the UNG chart we just saw the 20 day MA & 50 Day MA bullishly crossover each other.
Last time this happened Nat gas had a 4-5 day parabolic move.
The bulls must be careful to not push this commodity up too quickly because it makes the pattern less likely to have a continued breakout.
We are still putting in Lower weekly highs, so the next test of the most recent pivot high is going to be crucial.
If the bulls can trigger the weekly inverse head and shoulder pattern there's going to be a great long continuation opportunity. Until we break the pivot high & create a higher high traders must use caution now that we've had a large move occur.
AR, EQT, CPK, LNG are all set to push higher if Nat gas holds these gains.

NATGAS Set To Fall! SELL!
My dear followers,
I analysed this chart on NATGAS and concluded the following:
The market is trading on 2.456 pivot level.
Bias - Bearish
Technical Indicators: Both Super Trend & Pivot HL indicate a highly probable Bearish continuation.
Target - 2.388
About Used Indicators:
A super-trend indicator is plotted on either above or below the closing price to signal a buy or sell. The indicator changes color, based on whether or not you should be buying. If the super-trend indicator moves below the closing price, the indicator turns green, and it signals an entry point or points to buy.
———————————
WISH YOU ALL LUCK

NATGAS WILL FALL|SHORT|
✅NATGAS will soon retest a key resistance level of 2.524$
So I think that Gas will make a pullback
And go down to retest the demand level below at 2.422$
SHORT🔥
✅Like and subscribe to never miss a new idea!✅

NATGAS: Forecast & Trading Plan
Our strategy, polished by years of trial and error has helped us identify what seems to be a great trading opportunity and we are here to share it with you as the time is ripe for us to sell NATGAS.
❤️ Please, support our work with like & comment! ❤️

NATGAS Will Go Down! Sell!
Hello,Traders!
NATGAS is going up
From the horizontal support
Of 2.275$ just as I predicted
And now the price is approaching
A horizontal resistance of 2.529$
From where we will be expecting
A local bearish correction
Sell!
Like, comment and subscribe to help us grow!
Check out other forecasts below too!

NATGAS RISKY LONG FROM SUPPORT|
✅NATGAS is going down now
But a strong support level is ahead at 2.278$
Thus I am expecting a rebound
And a move up towards the target at 2.334$
LONG🚀
✅Like and subscribe to never miss a new idea!✅

NATGAS Bullish Bias! Buy!
Hello,Traders!
NATGAS made a bullish
Breakout of the key
Horizontal level of 2.278$
Which is now a support
And is making a retest
Now so as we are bullish
Biased we will be expecting
A further move up
Buy!
Like, comment and subscribe to help us grow!
Check out other forecasts below too!
