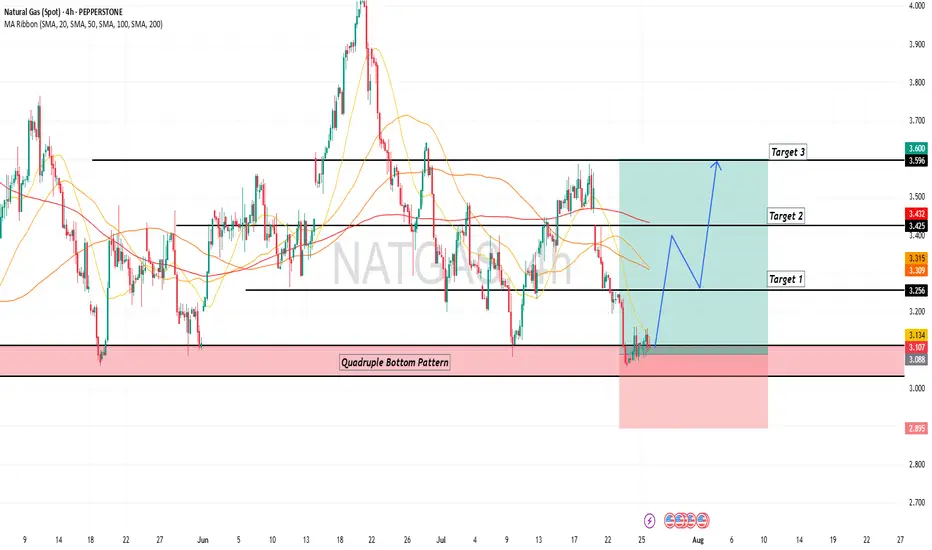
Natural Gas is in the Buying DirectionHello Traders
In This Chart NATGAS HOURLY Forex Forecast By FOREX PLANET
today NATGAS analysis 👆
🟢This Chart includes_ (NATGAS market update)
🟢What is The Next Opportunity on NATGAS Market
🟢how to Enter to the Valid Entry With Assurance Profit
This CHART is For Trader's that Want to Improve Their Technical Analysis Skills and Their Trading By Understanding How To Analyze The Market Using Multiple Timeframes and Understanding The Bigger Picture on the Charts
Natgassignals
Natural Gas is in the Buying DirectionHello Traders
In This Chart NATGAS HOURLY Forex Forecast By FOREX PLANET
today NATGAS analysis 👆
🟢This Chart includes_ (NATGAS market update)
🟢What is The Next Opportunity on NATGAS Market
🟢how to Enter to the Valid Entry With Assurance Profit
This CHART is For Trader's that Want to Improve Their Technical Analysis Skills and Their Trading By Understanding How To Analyze The Market Using Multiple Timeframes and Understanding The Bigger Picture on the Charts
The Natural gas will make a dip once againNATURAL GAS H1 Analysis 📊
First of all , lets take about the gap
war , This gap is due to war and as you know market will refill it sooner or later , thats the main reason of the selling
Yes, no doubt , the market can go up for some sl hunting thats why the red zone is little wider
The ultimate trend is sell due to no investors in gas because all the investors are busy in the BITCOIN AND GOLD. so it will come back at its lowest support sooner or later
Follow the money management strictly and this is just the prediction.
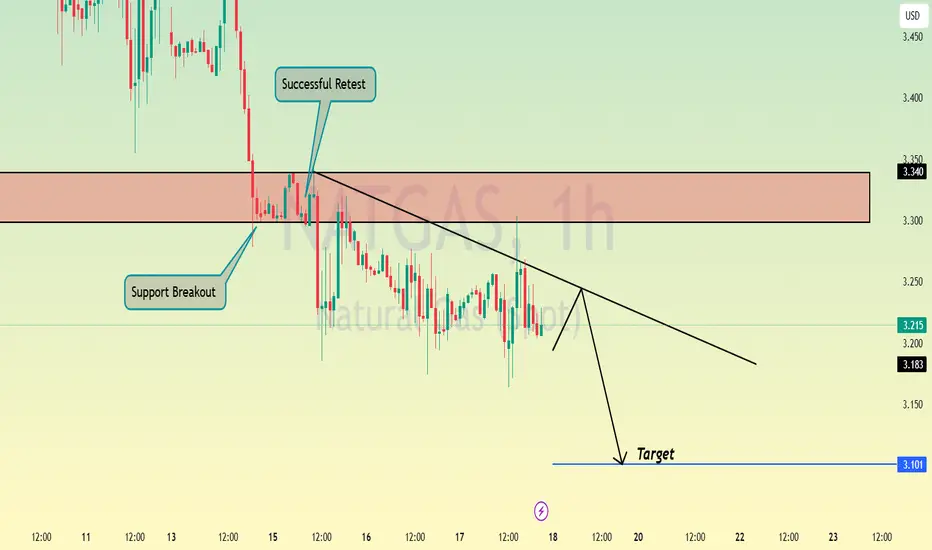
NATGAS is Bearish: A Consolidation Phase Could be AheadFenzoFx—NATGAS dipped below $3.43 support on April 14, trading at approximately $3.22. The Stochastic Oscillator exited oversold territory, signaling possible consolidation before a downtrend resumes.
Bearish trends persist below $3.66, with potential price dips toward $3.08.
>>> No Deposit Bonus
>>> %100 Deposit Bonus
>>> Forex Analysis Contest
All at F enzo F x Decentralized Forex Broker

Natural Gas is in the Buying DirectionHello Traders
In This Chart NATGAS HOURLY Forex Forecast By FOREX PLANET
today NATGAS analysis 👆
🟢This Chart includes_ (NATGAS market update)
🟢What is The Next Opportunity on NATGAS Market
🟢how to Enter to the Valid Entry With Assurance Profit
This CHART is For Trader's that Want to Improve Their Technical Analysis Skills and Their Trading By Understanding How To Analyze The Market Using Multiple Timeframes and Understanding The Bigger Picture on the Charts
Natural Gas is in the Buy DirectionHello Traders
In This Chart NATGAS HOURLY Forex Forecast By FOREX PLANET
today NATGAS analysis 👆
🟢This Chart includes_ (NATGAS market update)
🟢What is The Next Opportunity on NATGAS Market
🟢how to Enter to the Valid Entry With Assurance Profit
This CHART is For Trader's that Want to Improve Their Technical Analysis Skills and Their Trading By Understanding How To Analyze The Market Using Multiple Timeframes and Understanding The Bigger Picture on the Charts

NATGAS Found Support at $3.43: Next Target Could be $3.084FenzoFx—NATGAS failed to stabilize below the $3.43 support, resulted in the prices to bounce. As of this writing, Natural Gas trades slighlty above the support.
From a technical perspective. The recent bounce in the price couldn't form a new higher high. Therefore, it is expected for the prices to fall. But, bears must close and stabilize below the $3.43 support for the downtrend to resume.
>>> Win $160.0 weekly by participating FenzoFx Forex Contest for free.

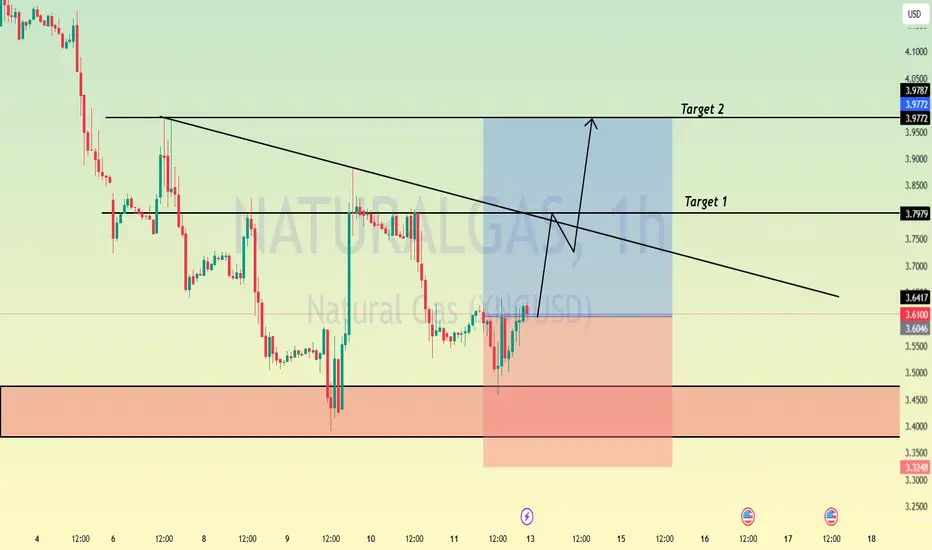
NATGAS is Bearish amid Oversold SignalsFenzoFx—NATGAS is in a downtrend, broke below the $3.66 support. The primary trend is bearish, but a consolidation phase is expected.
In this scenario, Natural Gas may test the 50.0% Fibonacci retracement level at $3.866 before the downtrend resumes. Watch this level for bearish signals, like candlestick patterns.
>>> Trade NATGAS without swap at FenzoFx Decentralized Broker

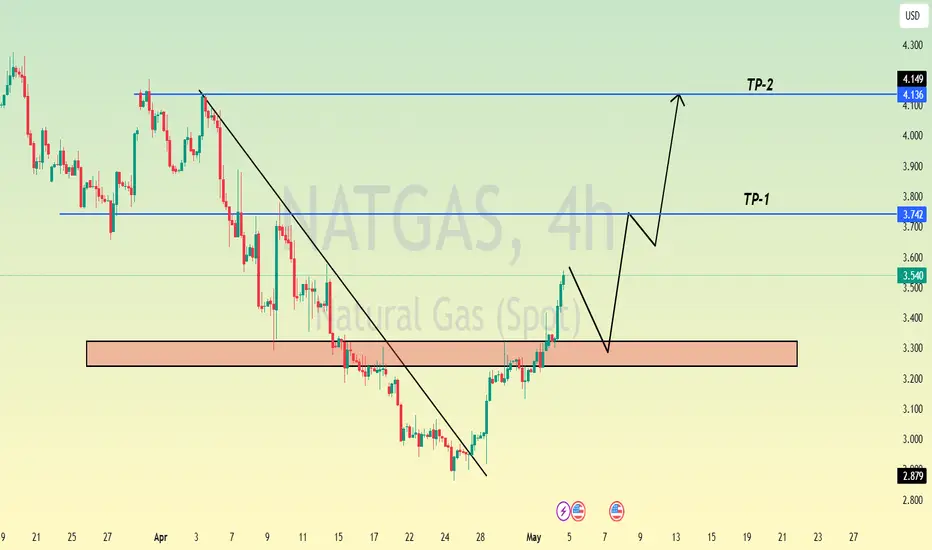
Natgas to take the top again.Natgas has filled FVG. let it consolidate for 8-10 hours. Look for buys to take the top once more.
4.5 is the next target

Natural gas is in the Selling directionHello Traders
In This Chart NATGAS HOURLY Forex Forecast By FOREX PLANET
today NATGAS analysis 👆
🟢This Chart includes_ (NATGAS market update)
🟢What is The Next Opportunity on NATGAS Market
🟢how to Enter to the Valid Entry With Assurance Profit
This CHART is For Trader's that Want to Improve Their Technical Analysis Skills and Their Trading By Understanding How To Analyze The Market Using Multiple Timeframes and Understanding The Bigger Picture on the Charts

Natural gas is in the Selling direction Hello Traders
In This Chart NATGAS HOURLY Forex Forecast By FOREX PLANET
today NATGAS analysis 👆
🟢This Chart includes_ (NATGAS market update)
🟢What is The Next Opportunity on NATGAS Market
🟢how to Enter to the Valid Entry With Assurance Profit
This CHART is For Trader's that Want to Improve Their Technical Analysis Skills and Their Trading By Understanding How To Analyze The Market Using Multiple Timeframes and Understanding The Bigger Picture on the Charts

Natural Gas still coiling! breakdown or breakout? Hello Traders
In This Chart NATGAS HOURLY Forex Forecast By FOREX PLANET
today NATGAS analysis 👆
🟢This Chart includes_ (NATGAS market update)
🟢What is The Next Opportunity on NATGAS Market
🟢how to Enter to the Valid Entry With Assurance Profit
This CHART is For Trader's that Want to Improve Their Technical Analysis Skills and Their Trading By Understanding How To Analyze The Market Using Multiple Timeframes and Understanding The Bigger Picture on the Charts

Natural Gas still coiling! breakdown or breakout?Hello Traders
In This Chart NATGAS HOURLY Forex Forecast By FOREX PLANET
today NATGAS analysis 👆
🟢This Chart includes_ (NATGAS market update)
🟢What is The Next Opportunity on NATGAS Market
🟢how to Enter to the Valid Entry With Assurance Profit
This CHART is For Trader's that Want to Improve Their Technical Analysis Skills and Their Trading By Understanding How To Analyze The Market Using Multiple Timeframes and Understanding The Bigger Picture on the Charts

Natural Gas still coiling! breakdown or breakout? Hello Traders
In This Chart NATGAS HOURLY Forex Forecast By FOREX PLANET
today NATGAS analysis 👆
🟢This Chart includes_ (NATGAS market update)
🟢What is The Next Opportunity on NATGAS Market
🟢how to Enter to the Valid Entry With Assurance Profit
This CHART is For Trader's that Want to Improve Their Technical Analysis Skills and Their Trading By Understanding How To Analyze The Market Using Multiple Timeframes and Understanding The Bigger Picture on the Charts

Natural Gas King #2Hello Ladies and Gentlemen,
Natural Gas is approaching its lowest price since its inception!
Who knows who Arnold is?

Possible scenario to NATGASNatgas has been in a downward trend for more than a month.
I expect it to reach the support level shown in the picture for a third time.
If this happens, the exchange rate will rise significantly again.

NATGAS - NEW BREAKOUTHello Traders !
On Wednesday 17 July, The NATGAS price reached the support level (2.032 - 2.138).
Currently, The last lower high is broken (Change of Character).
So, I expect a bullish move🚀
_____________
TARGET: 2.305🎯

Natural Gas Short Term Sell IdeaD1 - Price is bouncing lower from a strong resistance zone.
Bearish convergence.
H4 - Bearish trend pattern
Until the strong resistance zone holds I expect the price to move lower further after pullbacks.
