NATURAL GAS 📉📉📉Expecting bullish price action on this pair but simply on a fundamental reason, price tapped on 7.0$ institional figure taking out some retail stops below this price area and for now we are going for the ATH - ALL TIME HIGH.
What do you think ? Comment below..
Natgassignals

USGAS TAKE PROFIT HIT 📉📉📉📉 I CLOSED ALL TRADES IN PROFIT ON USGAS, we are still bullish on this asset from a fundamental/tehnical analysis context. My last target for this asset is 6.0,i think we will go there but not before price makes a retracement back into 5.0 institutional figure H4 Imbalance + bullish orderblock area.
What do you think ? Do you agree on my analysis ?

Natural Gas (NYMEX) - Weekly UpdateNatural Gas - Weekly
Bottom Line : "Big-picture" Bullish.
Repeating : The higher probability view is to label the Primary wave ((C)) decline as an ending diagonal to complete Cycle y . Ending diagonals are terminal structures. They are typically followed by swift reversals that retrace the entire length of the pattern. There’s not enough historical price data to confidently assess the wave degrees above Cycle, but a multi-year rally from the Cycle wave y low is likely to retrace the bulk of the decline from the 15.78 all-time high set in 2005 .

NATURAL GAS INTO 5.50 - 6.00 📉📉📉📉 Expecting bullish price action on NATURAL GAS as we have fundamental reasons behind a strong bullish move the war between Ukraine-Russia + sanctions that will affect the supply/demand of this asset, another fundamental reason why price will go higher way above 5.0 is because we have a BULLISH MARKET SEASONALITY till July.
From a technical perspective institutional figures 4.0 - 4.50 keeps the price bullish, we have a clear bullish market strucutre just be patient and ADD LONGS.
What do you think ?

NATURAL GAS LONGS 📉📉📉📉 Expecting bullish price action on this asset as the price of natural gas should rise from a seasonality point of view, we have a bullish market strucutre on H4/D1 timeframe as price keeps making higher highs and lower highs during the move, i will switch my bullish bias only if price will close bearish below the 4.0 area which is a important institutional level.
What do you think ? Comment below..

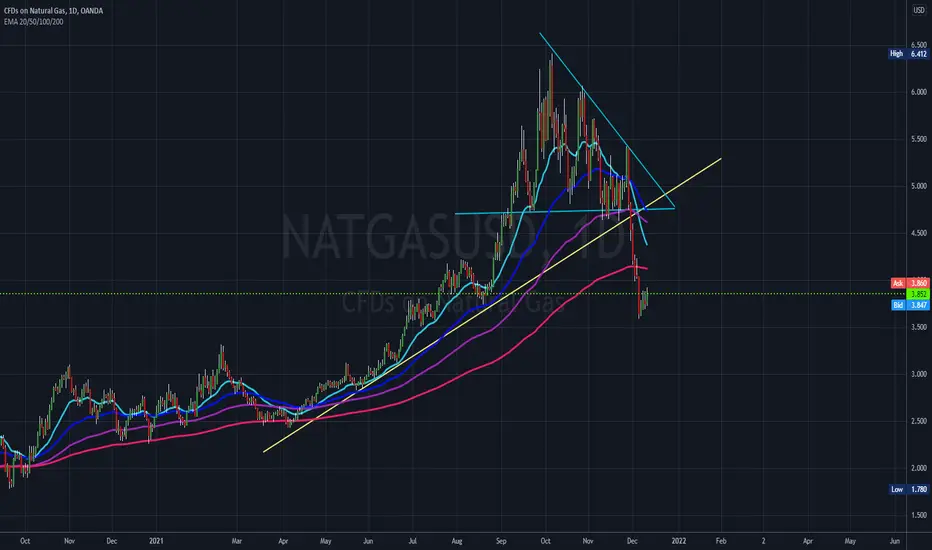
Well this interesting...Certain geopolitical events, rising prices in Europe and cold snaps across North America seem to be pushing Natural Gas higher. It's broken a key overhead resistance but upside will be limited. You can see some of the previous support lines which do correspond rather nicely with the last move downwards. This is strictly a short-term play unless other resistances and a falling dollar pickup pace.

NatGas: Take out your gloves!NatGas is slowly leaving the warm realms of the south behind, aiming for the resistance line at $4.825. Once there, we expect it to rise even further north.
However, we also see a 42% chance that the price could decide to soak in some more warmth and go below the support line at $3.396.

NatGas: Winter is Coming!And with the winter, the price of natural gas is increasing, too! This means that the course is going to leave the support at $3.396 farther behind. What lays in front are surges past the resistance at $4.825 all the way up to $6.466.
Can you feel the heat?

Natural Gas Forecast: Working Off Selling PressureThe natural gas markets have gone back and forth during the session on Thursday, hanging about the $3.80 level. Over the last year or so, I have been asked to do less analysis on natural gas, but quite frankly my email box has been full of questions as to what is going to happen with natural gas next. Retail traders have no idea, nor do some professional traders for that matter, that this contract is based solely upon the United States, meaning that what is going on in Europe or Asia has very little effect. In fact, the United States only exports 12,000,000,000 ft.³ a year, which seems like a lot but it is not.
Currently, Rotterdam gas futures are trading at about nine times what the Henry Hub contract is. That can bring in a little bit of demand but transporting natural gas across the ocean is not easy. Because of this, a lot of retail traders that I have been contacted from have lost a fortune in this contract over the last month or so. It is because they do not understand that they need to pay attention to US weather patterns, and basically ignore what is going on in their own backyard.
If you did not know this, do not be ashamed. I have recently had a conversation with somebody who runs a larger commodity fund who had no idea that natural gas contracts were so localized. He trades millions of dollars, which tells you just how uninformed some people can be. That being said, I felt the need to do this video due to the fact that somebody of you have been losing money as you are watching problems with Vladimir Putin delivering gas to the EU, etc.
Temperatures in the United States should be much milder than initially thought for most of the winter, meaning that the United States, which is absolutely swimming in natural gas, will continue to see lower pricing. We have recently gapped lower, and I do think that we will try to fill that gap as most futures markets will tend to do. I will be shorting this contract of the first signs of exhaustion near the 200 day EMA which happens to be at the top of the gap, right around $4.16. We have seen the high for the winter, as we are trading the January contract already, meaning that before you know it will be trading springtime contracts.
NatGas: There is Room! 🔥🔥🔥NatGas is extending the correction way below the mark at $4.825. Now, there is still some more room left at the bottom. In total, we expect the course to fall between $3.969 and $3.795. Ideally, the turnaround will happen here. If we, however, fall below $3.396, greater corrections will be realized here.
It's getting close!

NatGas: Here We Go Again! 🚀🚀🚀It is not rocket science. The winter is coming and we like it hot. Therefore, the NatGas price will increase once again and push to highs around $8, given the course remains above $4.825.
Have hot weekend!

Gas Long SetupGAS Long Setup
🔵 Entry Level: $5.673
🟢 Take Profit: $6.094
⛔ Stop Loss: $5.441
Reasons:
- So far the price is respecting the ascending channel;
- I believe the price may bounce off the lower trendline in the area between $5.535 and $5.670.
Game Plan: If the price goes through the lower trendline (yellow), which at the moment acts as a support level, then I will be looking to open a short position on a retracement unless the 2nd trendline (white) acts as another support level.


NatGas: Down Low! 🎺🎺🎺After all the massive bullish runs, the NatGas price needs to cool down a bit. We expect it to fall to $4.758. From there, new surges are to be expected.
Cooling Down!

NAT GAS - INTO SHORT TRENDHello trading friends,
Depending on the last chart study for NAT GAS - it looks we are entering a new breakdown trend.
This could be a start trend for further breakdown trend for NAT GAS.
Have a great day.

NatGas: Enough is Enough! 🔥🔥🔥The NatGas price has been surging over the last couple of months and we expect it to slow down soon. Here, we expect the correction to stretch until $4.157 before prices start to explode again.
Go Bears!

Target hit, from 1.5 to 4.5!!I posted several calls from June 2020. NG is super bullish and will breakout from the multi year channel soon to target ~8$
Now we go down in a large correction and sideways movement until November. Bears are coming.. temporarily.

NatGas: Wait, Wait, Go! 🥵🥵🥵There is still some room left on the bottom side of the NatGas chart. The turnaround should come around $3.521. After that, massive increases in the price should follow, given that the price does not fall below $3.13 before.
Heat now, cry later!

NatGas: What Goes Around Comes Around Although the NatGas price sharply dropped, we expect it to further rise until we are closer to $3.316. From there, we expect a longer corrective movement to dominate until around $2.187. After that, we should experience rising prices again that lead us over $3.800.
Stay trading!

NG1 - Natural Gas.NG1 - Natural Gas
We've been in range while, patience is key with this one
Technical aspects - Brewing up nicely!
Support: 2.400, 2.275, 2.040
Resistance: 2.945, 3.070, 3.375
Pattern: Wedge / Double Bottom
A break to either direction and a pull back to the trendlines either direction of break trade to be taken. (once confirmed)
Trade Journal
(Just a trade Idea, not a recommendation)

Gas Long SetupGas Long Setup
🔵 Entry: $2.740
🟢 TP & RR: $2.890 (2.14)
⛔ Stop Loss: $2.670
Trade Reasons:
✔️ Oversold Level Market Flow
✔️ Diagonal Trend Line Support

Gas Long SetupGas Long Setup (refer to the setup marked with "2")
🔵 Entry: $2.704
🟢 TP & RR: $2.898 (3.4)
⛔ Stop Loss: $2.647
Trade Reasons:
✔️ Support level
✔️ Close to the 0.618 Fib retracement
✔️ Diagonal trend line within ascending channel
📝 A few things to note here:
1. Seeing how price action develops, you may close the trade setup suggested yesterday (marked as 1). You should end up with a tiny profit or break even (depending on the comission you pay). The current candle formation does not look promising for a long setup. Alternatively, trial the SL up as soon as/if price starts moving up.
2. I personally avoid having open positions near my entry level before the weekend, especially if that weekend happens to be the end of the month. So for me, this is a disproportionate risk.
3. Setup marked as "2" is the order I will be looking to open if price retraces to that level. The Stop Loss is not ideal, as I think it should be slighly under the 0.618 level, but I leave this up to you. Your RRR will decrease in proporiton to the distance to your SL.

Gas Long SetupGas Long Setup
🔵 Entry: $2.81
🟢 TP & RR: $3.04 (1.71)
⛔ Stop Loss: $2.67
Trade Reasons:
✔️ Reaching lower trend line
✔️ Reaching support level
✔️ Market Flow indicator printing small divergences in the oversold area
📝 Not a great RRR, but the SL is positioned at a very safe level below the diagonal trendline and the recent lowest low. If price bounces off that level I will be quick to trial the SL so that I minimize exposure and lock in some profits.
