Long Term Prospects for NATGASUSDThe NATGASUSD is in long-term Bear Market with price trading below the 50 and 200 and 800 week emas. The 50 week ema is currently trending down slightly, though price has finished up a sideways correction. A small degree five waves down has completed, so a bounce is likely back to the 30 ema.
Looking at the Long Term chart, price tends to spike up when the economy and stock market trend down. Conversely, the price of natural gas tends to drop when crude oil goes up in price. This makes sense from a Supply perspective with more Nat Gas available when more crude oil drilling takes place. Though from a Demand perspective, it’s backwards. With the Fed doing QE, pumping money into the markets, the price of Natural Gas should drop. This perspective matches up with the Elliott Wave count.
The Market is in a Long-Term Bear Market on the daily, with price below the 50 ema, the 200 ema and the 800 ema. Price is below a long-term trend line and has yet to put in a bottoming pattern. A measured move down would take price to 2.027. We’re still in an downtrend as long as we close below the 13 ema at 2.272.
The Market is in a Bear Market on the 4 hour, with price below the 50 ema, which is below the 200 ema, which is below the 800 ema. Price would have to close above 2.230 to be considered in an upwards correction. That could happen today. We should expect a rally here into the 2.354 to 2.461 range.
Based on the above, the plan would be short on a rally to the daily 30 ema, with a stop above the 50.
This is my NATGASUSD look ahead for my own trading purposes. FUTURES trading involves risk. Feel free to comment, but trade off of this post at your own peril.
NATURAL GAS

1D) natgasusd ratios are off. not a valid pattern, yet convincingly behaves like bullish shark.
Max down 1.7 as worst case scenario

NATGASUSD - longs preferredLet's see if it will pullback to green area, where I'd start adding to long position with stop loss below the last low. It may also breakout and continue rising - in this case I'll be looking for retracement in grey area - targets will still remain the same. On dashed levels (TP1, TP2) I'll look for closing part of trade and re-enter on pullback with final target at TP3 area.
Disclaimer: this idea is solely for my own purposes, to satisfy the ego, if it will work out ;)

Long on NATGASBreaking of support and resistance trendlines and confirming the change in trend using horisontal lines for the retest.
First idea published.

Is it still good time for NATGAS, if Canada coughs down....Quick good "buy" and "sell" scenario for NATGAS .
Just my first chart to learn the site's charting functionality.
Wish you Merry Christmas to all, and lovely days.
IK

Natural Gas Overview Natural Gas industry finds itself in an odd predicament – total production is still at record levels, and may continue to climb, albeit at a slower and lower rate. At the same time there are widespread financial problems in the industry, particularly for gas-focused companies. One of the big questions regarding production is whether Texas oil drillers can keep gas output growing enough to offset the declines underway in Appalachia.
- Nick Cunningham
Let's start after this current summary.
Natural gas prices continue to be dominated by bears under the trend line.
The risk / reward ratio for the continuation of the bear market is now at 2 levels.
When we look at the graph, we see a bearish wolfe wave formation, but we cannot say that it started because prices above the reference point.
I think over 2.500 - 2,656 area bears will be replaced by bulls. ( 2.656 = Stop-Loss Level )
The current trend line is not a very accelerated and reasonable line, but may be an indicator of excessive pricing.
The temperatures are above the seasonal norms all over the World.
The support-resistance levels to be followed are:
-Support Level : 1.647
-Resistances : 2.5 - 3.05 - 3.9 - 4.527
Summary
I don't see a very valuable risk / reward ratio for opening positions on a weekly basis, but for the downward refraction of the bullish wolfe wave, opening short for lower time periods can be considered.(Breakout Bullish Wolfe 2-4 Reference Trendline )
I can look forward to an opportunity for a clear upward break of the orange trend line and 2.5 resistance, or for long positions over long periods of time below the level 2, ie close to support.
When one of these possibilities comes true, I will share my opinion with another clear judgment.
Best regards.


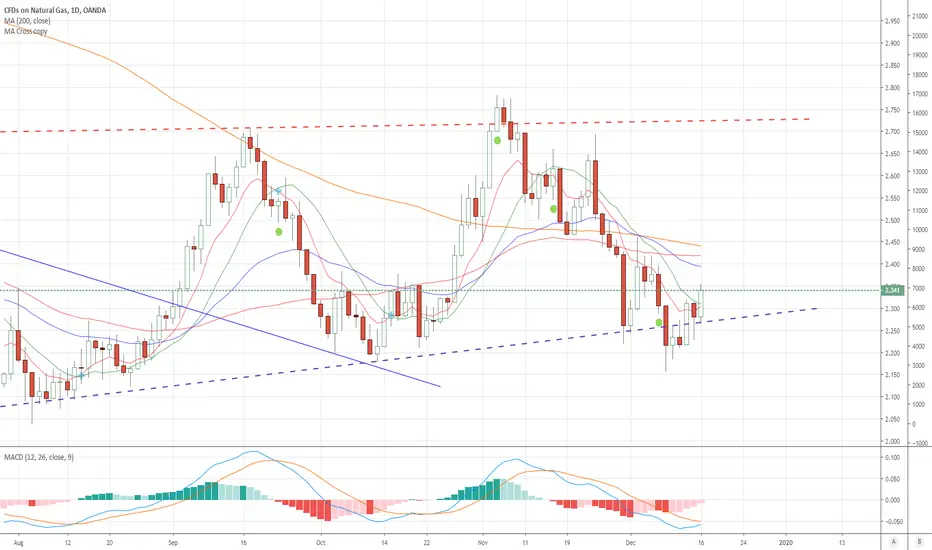
NATGAS Perfect Entry LONGThe chart of NATGAS looks perfect for entry. Bouncing off the lower trend line, MACD getting set to cross. Id use BOIL or UGAZ

Natural Gas (NATGAS) Trading Plan
hey traders,
from November the market is prevailingly bearish.
after a retracement from 2.150 support, I believe that the market may continue lower.
Pay attention to a small rising channel on 4H. Bearish breakout of it will trigger a bearish reaction of market participants.
our target levels will be:
2.2
2.1
*in case of a bullish continuation and market close above 2.35 setup will be invalid and bias will switch to bullish

Natural Swing Head and Shoulders on the 1H time frame for Natgas , probably sending the price for todays trading session towards the red line that acts as a downslopping resistance ,
That will be a nice entry point for the next swing high .

NATGAS: Market Overview and How to TradeThe market has been moving sideways since May 2019. We have the price channel with the upper and bottom zones and borders at 2.040 and 2.780 levels.
Now the price is at the bottom zone, and it gives us a possible buy opportunity based on the daily timeframe. If the market bounces between 2.040 and 2.150 or from this support only, it will be possible to buy with stop orders below 2.040 and the profit target at 2.600 resistance.
If the price breaks the support at 2.040 and moves lower, it will be a bearish signal. The market will be able to continue the downtrend.


Natural Gas Price breaking up back inside to the Fib Triangle( see link on chart )
Price on natural gas has to climb back up through the upper resistance of the Blue triangle so bulls get more chances to square up after the gap we had last Friday sending the price to test the two different resistances above it - green and if breaks through that red line to follow where 50 MA on daily is currently looking at -
Failing to keep price above the down sloping resistance of the triangle will send us down to the parallel resistance bellow it .
Weather forecast as we go towards the end of the week will determine how price will move around these resistance / support lines.

NATGAS can start rising from this place...If the price will make a pullback to Buy Zone we can open a Buy position.
It's a huge probability for start rising from that Support Zone near 2.179.
Push like if you think this is a useful idea!
Before to trade my ideas make your own analyze.
Write your comments and questions here!
Thanks for your support!

Natgas Bearish Wedge Breakout Trade!! And Next Long TradeNatgas seems to be in a corrective rising wedge. Trade the breakout of the wedge. Use proper Risk Management.


NATGAS: Bearish Continuation To Year's Low
hey traders,
it looks like natgas is going to retest current year's low.
2.04 - 2.1 area is on my radar,
I will be looking for a reversal formation within this area to buy the market
expecting a pullback at least to 2.250

Natural Gas Fib Triangle Interesting watching how Natural gas price is responding to those two different Fibonacci channels
The one is the upwards Fib channel we were in before selling off and currently rejected from - upper resistance, and the other one is the one we are consolidating in for the last couple of weeks moving downwards giving the down sloping support . Those two lines make a triangle - narrow blue area - where a less volatile asset would potentially consolidate in for a while before breaking towards any direction. Natural gas been volatile as it is wont stay there for long though.
Happy trading :)

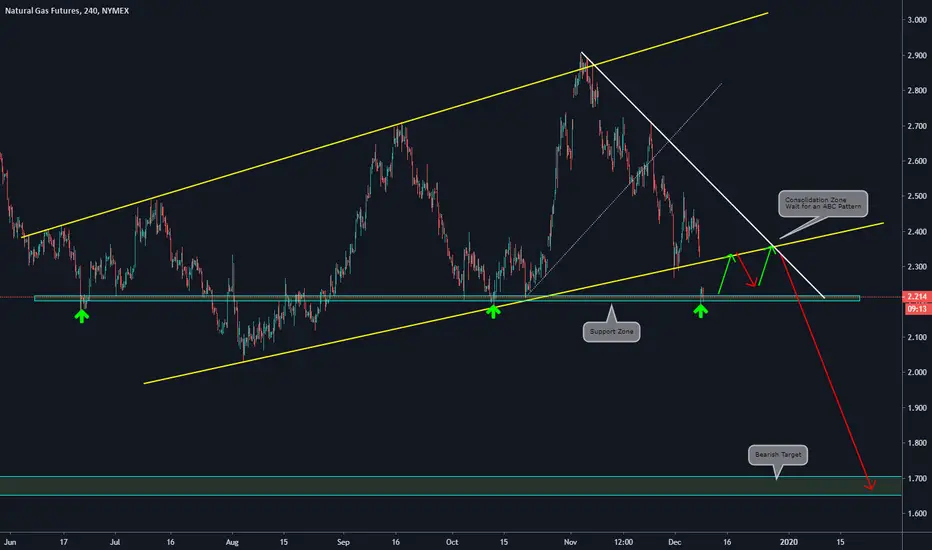
Multi-Timeframe Analysis / Natural Gas Futures by ThinkingAntsOkUse this as a guide to develop your view:
Main items we can observe on the 4HS chart:
a)Price has broken the primary structure (yellow lines) with a bearish movement
b)The price found support on the 2.20 level
c)We Expect an ABC formation with a pullback to the broken structure
d)If the ABC formation happens, we forecast a continuation of the bearish movement towards the next support zone at the 1.7 level
Daily Vision:
Weekly Vision:
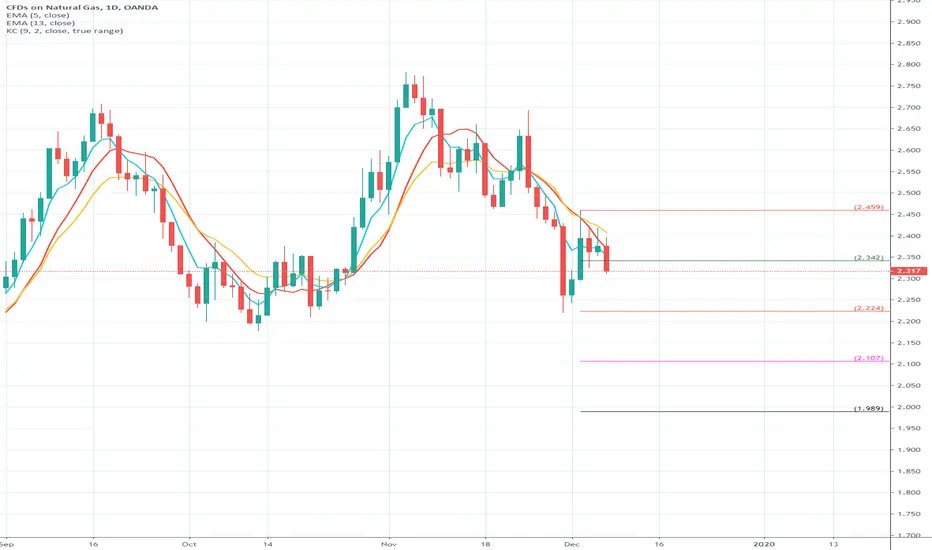
Strong Support & Favorable Risk-Reward in Natural GasI'm bullish in the short-term and through 2020.
- Natural Gas ($2.327) is currently sitting below the 20d ($2.37), 50d ($2.56), and 200d ($2.8) MAs.
- The recent retest of the 13-year falling trendline (orange) should also strengthen bull cases. In 2016 the trendline changed from resistance to support. And most recently in August, Natural Gas bounced off this trendline with gusto.
- Several converging support levels. There is minimal downside in Natural Gas Versus upside.
Over the short-term, 2-4 weeks, I think $2.55 will be achieved. From there $3.0 will potentially be next. I believe the support at $2.1 and $2.2 will hold over the near-term. I believe $3.8 may be achieved at some point in 2020.
Of course, there does exist risk in Natural Gas. There is a bear case. We could see a sell-off towards the lowest support levels. That would come in around $1.3. If that selloff does come, the signals will be the price action between 2.2-1.9 and a breaching of the white & orange trendlines lower. If this selloff does occur, I expect these lower prices to get bought up very quickly, thus making this scenario a strategic buying opportunity.
I welcome this selloff but I am not waiting for it. I expect the white support lines to be respected and for 3.0 to be achieved in the next couple months.