NATURAL GAS


NATGASUSD 15-MINUTE TIMEFRAME SHORTNatural gas price seems to be moving in an uptrend. However, there appears to be a wedge-like formation in play, suggesting a possible small correction. If prices do reject the ceiling of this shape and go lower, i would consider going short. Due to the high risk nature of this type of trade, i would only consider opening a small position.

Natural Gas - SupernaturalI'm coming back to you in this idea with an old friend : Natty, alias The Widowmaker.
If you are a day trader just skip this idea because I definetely not going to trade in out everyday.
If you don't want to roll over the contracts just skip because I might be sitting in the position until November. Maybe more..
I’m trying to catch Natty's multi year cycle low . (3 year cycle low /3YCL/)
This is one of the toughest commodity. But you know : big risk big reward. I’m waiting for 5$ in Natgas price in the following months. So this is a 100% possible gain without leverage. In the 3x leveraged fund (UGAZ) 6x gains are not off of the table.
NatGas printed a key reversal yesterday. I wanted to wait for today's close , but with the 2,5% gains the chance is slim that we give back the gains.
So I launch the long idea here. In the next NatGas idea I will post a monthly owerview where you will understand why is this long so interesting.
In the past the key reversals signaled the bottoms:
For a few times in the following days we had a pull back but the original low was not taken out. So next week we might have a pullback near to the lows but as there is no guarantee for it I suggest at least a starter position and you can still add if we test back 2.44.
Indicator wise we have a divergence in the MACD and TSI : that is supporting the idea. It seems NatGas printed a daily cyle low yesterday and I think we are looking forward to see a good rally in the following weeks/months.

Natural Gas - Bearish Market and Possible ReversalThe market keeps the bearish trend. The strong support at 2.60 could not hold the falling market and this level was broken. DMI is bearish and confirms trend market conditions. ADX moves upward, and it tells us above the strength of sellers. MACD lines support the downward movement too.
If we look at RSI, we'll see a possible reversal. The market can be oversold as the line of RSI reached the oversold zone. MACD histogram starts an upward movement. These signals allow us to think about a correction movement in the structure of the bearish trend. Also, the price is not far from the next support at 2.40 and reversing from this zone with further upward movement, it will be a logical market movement.
How far will the price be able to move upward? As we have the bearish trend and there are no trend reversal signals, we should expect that the correction movement will be with targets at higher resistance levels and SMAs with 50 and 100 periods. The price action at the resistance zone formed by SMA100 and 3.00 resistance level will be important for the further market movements as the market will be able to confirm the trend reversal.
How to trade:
- long positions with close profit targets at 2.60 resistance level, SMA50, and SMA100, stop orders below 2.40 support level
- short positions from SMA50 and SMA100 with profit targets at support levels and stop orders above the local swing highs.

NATGAS - Possible pullback for short termGood evening traders,
Quick one at NATGASUSD
First as we can see overall the price is too damn low, we have for example the "Apache corporation" on the US to reduce their production, of course a big reason for that is the low number of pipelines that are not the be done before end of 2019.
Ok to the charts,
Weekly (left) we see natgas coming closer to a historic support level on 2.42 and RSI is almost oversold.
H4 (right) we see price moving sideways after a strong sell off and now we have bullish RSI divergence.
Therefore we might expect natgas to do at least a pullback on the short term.
First resistance level is at 2.70 where price showed a lot of indecision before and soon we will have H4 200 SMA there.
For long term if we have good fundamentals for this commoditie 3.10 will be a very interesting target level.
Good trades.
This Trading Idea is to be used for educational purposes only. This idea does not represent financial advice and its NOT a signal. You should trade based only on your own technic and knowledge.


Resistance Hit with Nat GasStochastic and RSI suggest we are at oversold levels while price action moves into strong support. Expected move upward.

NATGASUSD, H4: Continuous moving towards : SellCFDs on Natural Gas OANDA:NATGASUSD
NATGASUSD, H4: Continuous moving towards : Sell


NATGASUSD BUY (NATURAL GAS - US DOLLAR)Hi there. Price is at the bottom of the pattern. Wait for the price to form a continuation pattern on lower time frame and watch strong price action for buy.


Natural Gas low in place, 20% upside from here!With section 232 Uranium tariffs around the corner, natural gas is lining up perfectly for an event-driven opportunity to get long!

NATGAS - Still not much movement, wait for the bottom. Good weekend everyone,
Update on NATGASUSD ;
As we can see on weekly timeframe we have a huge 2 year support on 2.58 zone and the natgasusd is on bearish rally since ATH around 4.86 usd, overall weekly this commoditie is BEARISH.
RSI approaches oversold zone and this might be a good opportunity.
Daily chart we see a good support/demand zone around 2.72 usd level , the volume is tricky now but i expect this zone to be re-tested again.
H4 chart shows RSI overbought and some decreasing volume and therefore a minor pullback is expected.
Anyway the strategy here is clean and simple, wait NATGASUSD to reject the strong support zone (either the white dashed line or the 2 year support orange line) and long with a very good RxR ratio targeting 2.87 and 2.98 level.
I definetly wouldn't short this natgas before a clear break of the orange support.
This Trading Idea is to be used for educational purposes only. This idea does not represent financial advice and its NOT a signal. You should trade based only on your own technic and knowledge.

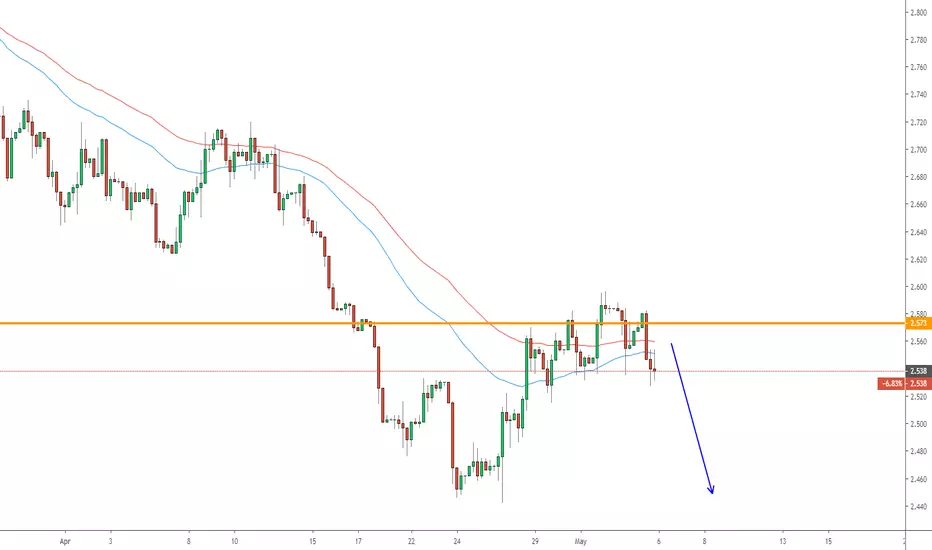
NATGASUSD short tradeWhen we look at natural gas, we quickly realize that we have given up an important support and have tested it.
Also, the next important zone of resistance at 2,733 has already been broken, which is why I assume that we will see a price decline here in the next few days.
enjoy the way
logindaten


NATURAL GAS Buy Signal long termPattern: Fibonacci retracement.
Signal: Bullish as it rebounded on the 1M Suppport Zone.
Target: TP1 3.450 (0.382 Fibonacci) TP2 3.720 (0.500 Fibonacci).
