UNG ( Natural Gase Futures ETF) Swing trade Short then LONGUNG is shown here on the 15 minute chart with text box comments showing the three trades
over 8-9 trading days yielding 25% overall first two trades short then a one day long trade at
what may be an early reversal. A pair of hull moving averages 49/140 ( multiples of 7) are used
to generate buy and sell signals in golden and death cross fashion. A dual TF RSI indicator is
used to support those signals. As swing trades with typical stop losses these were quite
profitable with low risk. As an alternative if a trader has options charting available the same
strategy/ method can be applied for significantly higher profit with less capital in each trade.
Natural Gas

Bullish Outlook: UNG Prices Surge Amidst Anticipation of Record In the wake of widespread winter weather last week, the volatile natural gas futures front month, specifically the expiring February contracts for UNG, are witnessing a robust uptick.
Traders are eagerly anticipating a potentially record-breaking storage withdrawal, adding fuel to the bullish sentiment.
The market's sharp rebound in early trading on Thursday reflects the optimism surrounding the impending storage pull, setting the stage for a significant uptrend in UNG prices.
Investors are closely monitoring the situation, poised for potential gains in the midst of evolving market dynamics.

Natural Gas DXY, Oil Gold Silver Price Forecast - Natural Gas Natgas Stock 4h uptrend confirmed
#naturalgas #natgas #xagusd #dxy #xauusd #naturalgastechnicalanalysis #technicalanalysis #tradingstrategy #daytrading #naturalgasanalysis #naturalgastrading #natgasanalysis #uso #crudeoil
00:00 Natural Gas stock Bulls NatGas Support & Resistance Guide
05:05 AMEX:UNG Stock Forecast
05:58 USO Oil Stock Forecast
07:14 DXY US dollar Stock Forecast
09:09 Gold XAUUSD Stock Forecast
09:56 Silver XAGUSD

Natural Gas Bulls are alive / Oil looks ready to go!Nat gas saw a beautiful bullish reversal candle today.
this likely will yield more upside in the short term.
Even with this reversal, I believe Nat gas still goes lower after we complete this bounce.
Oil stocks showing strength as oil appears to be putting in a bottoming formation.
If oil breaks out, this will be a natural headwind for the market and tailwind for inflation.

NATURAL GAS - Only Way Is Up!From a technical standpoint, Natural Gas is currently at levels where there's very very limited downside and major potential for upside.
Many times when we've seen prices come to these lows, price shot up hundreds of %. It's unlikely that we'll hit 0 and therefore balance of probability suggests that going Long on Natural Gas would be a good bet!
Trade Idea:
- For a safe entry, enter on break of the red trendline
- For a risk entry, look for buying opportunities anywhere between the region of 1.6 and 1.8
- stops below lows after the red trendline breaks
- Targets: 3.5, 6, 10
Goodluck and as always, trade safe!

Natural Gas Double Bottom Oversold Stoch RSIDouble Bottom Oversold Stoch RSI. The technical analysis indicates a Double Bottom pattern along with an Oversold condition in the Stochastic RSI. This combination suggests a potential reversal or a bullish momentum in the market. The Double Bottom pattern is characterized by two consecutive troughs at approximately the same price level, indicating a possible trend reversal from a downtrend to an uptrend. Additionally, the Oversold condition in the Stochastic RSI suggests that the asset may have been oversold and could be due for a price increase. Traders may interpret this as a signal to consider buying or taking a bullish stance in their trading strategy.

Natural Gas Futures Bullishly Diverging at a Bullish Bat PCZNatural Gas Futures aggressively gapped down into support during the first hour of this week's trading and looks to be ready to form some MACD Bullish Divergence leading into the rest of the week. I think there is a good chance that Natural Gas at least undoes this decline and rises back up to $2.5 this week, but overall if this ends up being a major bottom I'd expect it to pump well into the mid to upper 3 dollar range.

Natural gas demolishing the bulls!We have been consistent with our calls on this commodity.
We warned you of lower price action to come and it has come!
new downside levels have been calculated that Nat gas breaks the $2 level.
We should see an intraday bounce tomorrow for a nice day trade move.

Kinder Morgan: Slanted Bullish Inverted Head and ShouldersKinder Morgan is heading into earnings and currently sits above the 200-week SMA and the POC as it forms what appears to be a Bullish Inverted Head and Shoulders pattern. If these levels hold into earnings, I think KMI will have a chance at breaking out of the pattern and making its way towards the 0.618 Fibonacci retracement up at around $31.23 especially if natural gas prices continue to rise.

Red Sea Crisis: How it will trigger the market?The recent development of the Red Sea crisis does not suggest that it is going to resolve anytime soon.
Which markets have already started moving? And how far will they rise this time?
We are going to recap the supply chain crisis during the pandemic and also delve into the current supply chain disruption caused by the Middle East conflict, which has led to the Red Sea crisis.
My name is Kon How, and my role in this channel, as always, is to study behavioral science in finance, discover correlations between different markets, and uncover potential opportunities.
Henry Hub Natural Gas Futures and Options:
Minimum fluctuation: 0.001 per MMBtu = $10.00
Code: NG
Disclaimer:
• What presented here is not a recommendation, please consult your licensed broker.
• Our mission is to create lateral thinking skills for every investor and trader, knowing when to take a calculated risk with market uncertainty and a bolder risk when opportunity arises.
CME Real-time Market Data help identify trading set-ups in real-time and express my market views. If you have futures in your trading portfolio, you can check out on CME Group data plans available that suit your trading needs www.tradingview.com

NG is a buy with S/L 2.69Entry Price: Enter the trade at the current market price of 2.80.
Stop Loss: Place a stop-loss order at 2.69, which is slightly below the recent support level. This will limit your potential losses if the price of NG falls unexpectedly.
Target Prices: Take partial profits at the first target price of 3.00 and consider trailing the stop-loss to lock in profits. The second target price of 3.20 can be used as an exit point for the remaining position.

Natural Gas Probes Support. Is One More Feb '24 Bounce Possible?The US Natural Gas Fun (UNG) paces for its third-worst single-session performance in the ETF's 17-year history as of this writing. Tuesday afternoon weather model runs did the prompt-month of natural gas no favors, and the February contract has plunged all the way back under $3 after poking above $3.30 late last week. The current record-shattering polar snap will prove to be short-lived for the CONUS. A mild forecast in both the NOAA 6-10 day and 8-14 day outlooks are bearish for the energy-dependent commodity.
This is the most volatile time of the year for nat gas, and the infamous “widowmaker” trade (the March/April spread) looms. For now, though, I see support on the chart in a broad range. Notice in my featured chart this week that $2.80 to $3.00 has historically been a battleground between the bulls and bears. What’s more, natty is now testing its 38.2% retracement from the December low to the January high, offering potential support.
The trade here, in my view, is long with a stop under $2.80 on the prompt month. We will have a contract roll later this month to the much cheaper March contract (currently about 45 cents less expensive than Feb). So, we will get a natural gap down once the roll takes place. Thus, the duration of this idea is through January 26.

Natural Gas DXY Gold Silver Oil Price Forecast00:00 Natural Gas stock Bulls NatGas Support & Resistance Guide
03:43 AMEX:UNG Stock Forecast
04:16 USO Oil Stock Forecast
05:13 DXY US dollar Stock Forecast
06:16 Gold XAUUSD Stock Forecast
07:03 Silver XAGUSD

Natural Gas could be in for a squeeze!Nat gas inventories and price action today were super volatile.
We saw a 7% rally, a 4% decline all for nat gas to finish up positive 2%!
Inventories remain in bullish trend.

NATURAL GAS Long-term High has been made. SELL.Natural Gas (NG1!) is having a strong bearish reversal since the January 09 High, which on this 1D time-frame can be identified as a Lower High on a 3-month Channel Down pattern. On top of that, the 1D RSI got overbought above 70.00 and is correcting.
This appears to be the new Bearish Leg of the Channel Down and we expect it to last around 1 month. Our Target is a new Lower Low on Support 2 at 2.135.
-------------------------------------------------------------------------------
** Please LIKE 👍, FOLLOW ✅, SHARE 🙌 and COMMENT ✍ if you enjoy this idea! Also share your ideas and charts in the comments section below! This is best way to keep it relevant, support us, keep the content here free and allow the idea to reach as many people as possible. **
-------------------------------------------------------------------------------
💸💸💸💸💸💸
👇 👇 👇 👇 👇 👇
Bitcoin ETF Approval & Stock market analysisBTC is moving higher but really Ethereum is the breakout chart.
Small caps lagging the market bounce.
Oil, Energy, Commodities hit today despite weak dollar.
CPI & innitial Jobs data tomorrow.

UNG rising in the cold of winterAS shown on a 4H chart, UNG which tracks natural gas futures has been rising now for three
weeks with the typical demand of the winter months and the cold weather impacting new
supplies while Russia's war continues. Volumes are relatively high while dual TF ( 4H and
1Week) crossed the 50 line on December 28. Price has now crossed over the Fib -.5 line
of the downtrend from October and has that line and the anchored intermediate term
VWAP for support and the setting of a stop loss ( strength in confluence)
I see this as a setup for a long swing trade of UNG or BOIL or XNGUSD on forex or any of the gas
companies ( LNG) to trade commodities while the equity markets get sorted out.

Natural GAs makes epic reversal, Oil Pummeled. Nat Gas made an epic reversal today after being down over 6%.
Oil got pummeled today despite a weak dollar.
Is the energy market breaking down?

Natural Gas DXY Gold Silver OIL Price Forecast- Natural Gas Natgas Stock daily uptrend confirmed
#naturalgas #natgas #xagusd #dxy #xauusd #naturalgastechnicalanalysis #technicalanalysis #tradingstrategy #daytrading #naturalgasanalysis #naturalgastrading #natgasanalysis #uso #crudeoil
00:00 Natural Gas stock Bulls NatGas Support & Resistance Guide
03:53 AMEX:UNG Stock Forecast
05:37 USO Oil Stock Forecast
07:10 DXY US dollar Stock Forecast
09:19 Gold XAUUSD Stock Forecast
10:55 Silver XAGUSD

NG1! Bullish WeeklyNatural Gas has been consolidating for almost a year now at an 886 fib retracement, considered deep value. The week of December 11th ran all local lows going back to June 2023 and had the highest volume in 3 years. Could be putting in a bottom here?

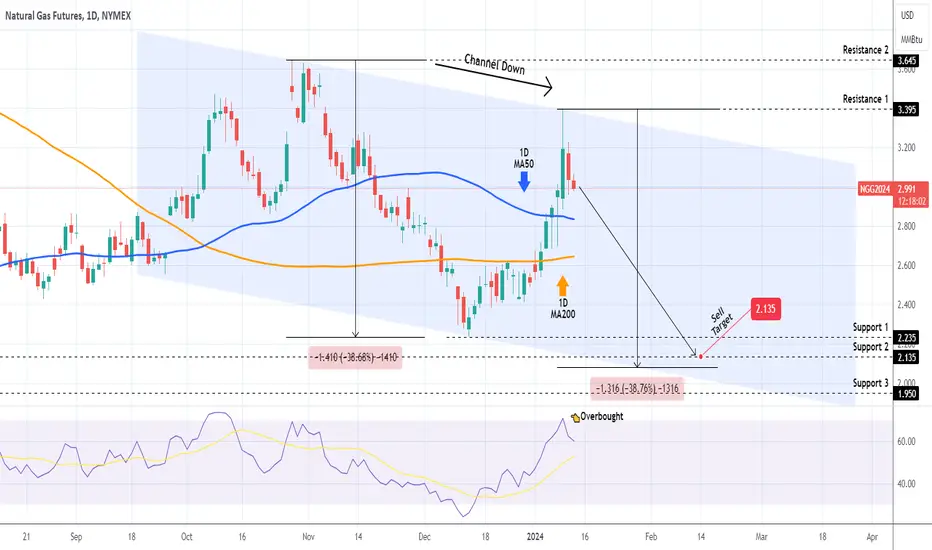
NATURAL GAS Strong sell on the 1D MA50.Natural Gas has been so far following the sell strategy we shared with you a month ago (December 04, see chart below), having already hit one Target (2.425):
Yesterday the price hit the 1D MA50 (blue trend-line) and managed to close the 1D candle below it, which stands out as the most efficient sell opportunity since the October 27 2023 High. Technically we can see a new Channel Down emerging with two Lower Lows and two Lower Highs already. Our long-term 2.135 Target on Support 2 remains, but technically the downside can be considerably bigger (-38.67% was the previous Bearish Leg).
If the price breaks above Resistance 1 (2.990), we will take an additional short-term buy, targeting 3.275 (Resistance 2).
-------------------------------------------------------------------------------
** Please LIKE 👍, FOLLOW ✅, SHARE 🙌 and COMMENT ✍ if you enjoy this idea! Also share your ideas and charts in the comments section below! This is best way to keep it relevant, support us, keep the content here free and allow the idea to reach as many people as possible. **
-------------------------------------------------------------------------------
💸💸💸💸💸💸
👇 👇 👇 👇 👇 👇

NATURAL GAS accumulation idea realized since September 7We are currently hitting 50WMA and 200DMA.The price is located from the zone I set -78%(from this chart) from ATH. Of course if 1.7 is still in circulation.
All this requires the weekly candlestick to close above to receive one of the confirmations for further growth.
Of course if 1.7 is still in circulation.
Below you can see the analysis since September

Natural Massive move coming!Natural Gas is tagging resistance.
Will we see a reversal lower off this level, we think so.
A potential stage 1 basing formation is nearing completion after this final shakeout.
