Natural Gas Oil Gold DXY Silver Price Forecast00:00 Natural Gas stock Bulls NatGas Support & Resistance Guide
06:40 AMEX:UNG Stock Forecast
08:26 USO Oil Stock Forecast
10:01 Gold XAUUSD Stock Forecast
11:04 DXY US dollar Stock Forecast
13:02 Silver XAGUSD
Natural Gas

NATGAS Will Go UP! Buy!
Hello,Traders!
NATGAS is trading in an
Uptrend and and will
Soon retest the rising
Support from where
I think we will see
A local bullish rebound
Buy!
Like, comment and subscribe to help us grow!
Check out other forecasts below too!

Natural Gas NatGas GOLD DXY Silver OIL Price Forecast00:00 Natural Gas stock Bulls NatGas Support & Resistance Guide
05:33 AMEX:UNG Stock Forecast
07:08 USO Oil Stock Forecast
09:37 Gold XAUUSD Stock Forecast
11:00 DXY US dollar Stock Forecast
13:05 Silver XAGUSD

DBW in TTF FM hourly. New up or Gap CloseThe TTF FM is trapped in a sideway movement. After a cone and SKS formation which was resolved bearish with the slump to 43,2 we now see a completed but still not active DBW. The ideal upper target (box) is 51, the statistical target is the equal to the important top at 49.5
The bearish breakout would be at 43,2 and would imply the gap close at 37.
Typically DBW are most of the time bullish reversal/continuation figures, thus a bullish break out is the more likely case.

Managing Positions with Parallel ChannelVideo tutorial:
• How to identify downtrend and uptrend line
• How to draw parallel channel correctly
• Confirming a change in trend (using trendline itself)
• Managing positions with parallel lines
- Profits
- Risks
- Knowing its volatility
Micro Natural Gas Futures & Its Minimum Fluctuation
0.001 per MMBtu = $1.00
Code: MNG
Disclaimer:
• What presented here is not a recommendation, please consult your licensed broker.
• Our mission is to create lateral thinking skills for every investor and trader, knowing when to take a calculated risk with market uncertainty and a bolder risk when opportunity arises.
CME Real-time Market Data help identify trading set-ups in real-time and express my market views. If you have futures in your trading portfolio, you can check out on CME Group data plans available that suit your trading needs www.tradingview.com

natural gas at support after falling for many days finally it looks like
there's some bullishness in natural gas
can give it a try!!
lets see how it moves

Natural Gas: A look at term structureLast week , we examined Natural Gas from a seasonality perspective. This week, we aim to extend that discussion and explore other ways to implement a similar view.
To quickly recap: From a seasonality standpoint, we identified short-term opportunities for a downward move in Natural Gas. Factors such as higher-than-normal storage levels, unseasonably warm weather, and the typical price trends from December to January suggest a potential decline in prices. Additionally, prices have recently broken past initial short-term support, now trading below the $3 handle.
Another perspective worth considering is the term structure. Term structure refers to the difference between futures prices of various maturities of commodity futures. It is visualized by plotting the prices of different expiry contracts, forming what we refer to as the term structure curve.
The term structure reveals other insight that we can explore, starting with the basic slope, which can be categorized as flat, upward sloping, or downward sloping. Understanding these can reveal potential mispricing or provide a clearer picture of market expectations at different future points.
Contango
An upward-sloping term structure, known as "Contango", occurs where contracts closer to expiry are priced cheaper relative to those further from expiry. This can be attributed to factors like storage costs where contracts further from expiry might trade at higher prices due to the associated storage expenses. Sellers, therefore, demand higher prices to offset these costs.
Backwardation
A downward-sloping term structure, termed “Backwardation,” happens when prices in the near months are higher than those further from expiry. This might occur for various reasons such as a benefit to owning the physical material, also known as convenience yield or even just short-term demand pressures.
Term Structure
With a rough idea of contango and backwardation in mind, we can now look at Natural Gas term structure.
The chart above shows the term structure for natural gas 1 year ago, 6 months ago and yesterday.
Here we can see the 3 distinct shapes for the term structure, especially when we focus on the front part of the term structure. With the term structure a year ago deeply in backwardation, 6 months ago in contango and current term structure in a generally flat shape. We also observe that term structure shapes can change quite rapidly hence it can be valuable to look at the shape of the curve to place strategies on the term structure.
For instance, if we maintain a short-term bearish but long-term bullish view, one strategy could be to short the front part of the curve while going long on the back part. This can be achieved by creating a Jan – Jun 2024 calendar spread, going short on the Jan 2024 contract and long on the Jun 2024 contract.
What’s interesting when we look at the Calendar spread vs the outright price moves in the individual leg is that the direction of the outright contract moves generally dictates the direction of the calendar spread. Again, this could happen for a couple of reasons, one being that trading activity often concentrates on the front part of the term structure for liquidity reasons, hence, making the front part of the term structure generally more reactive than the back part of the term structure.
But why trade the calendar spread instead of the outright?
Reduced Margin
Benefits of trading the calendar spread instead of the individual month contract include lowered margin requirements due to margin offsets from CME, reducing the margin needed compared to outright positions.
Reduced sensitivity to risk/black swan events
Both long and short positions in a spread will react together to risk events, albeit to different magnitudes, mitigating overall exposure. For example, during the Natural Gas rally in 2021, while outright prices increased from $2.5 to $9.5, the Jan – Jun 2023 calendar spread only increased by $1 over the same period. Similarly, on the decline, outright prices fell close to $8, but the calendar spread fell by only $0.74. This relatively controlled price swing allows for more manageable risk compared to outright contracts.
Hence to express our short-term bearish but long-term bullish view, we can take a short position on the CME Henry Hub Natural Gas January 2024 Futures and a long position on the CME Henry Hub Natural Gas June 2024 Futures at the current level of 0.11.
The same position can also be expressed using the newly launched (on 6 November 2023) CME Micro Natural Gas. At 1/10 the size of the full-sized contract, the margin requirements to set up a position become more manageable.
Micro Natural Gas Futures Margin Requirements
Alongside the lowered margin requirements, it offers the opportunity to tactically average into a position to achieve a better average entry price for the same amount of capital.
Each 0.001 point move in the full-sized Henry Hub Natural Gas Futures is 10 USD while a move in the Micro Henry Hub Natural Gas Futures is 1 USD.
The charts above were generated using CME’s Real-Time data available on TradingView. Inspirante Trading Solutions is subscribed to both TradingView Premium and CME Real-time Market Data which allows us to identify trading set-ups in real-time and express our market opinions. If you have futures in your trading portfolio, you can check out on CME Group data plans available that suit your trading needs www.tradingview.com
Disclaimer:
The contents in this Idea are intended for information purpose only and do not constitute investment recommendation or advice. Nor are they used to promote any specific products or services. They serve as an integral part of a case study to demonstrate fundamental concepts in risk management under given market scenarios. A full version of the disclaimer is available in our profile description.
Reference:
www.cmegroup.com
www.cmegroup.com
www.cmegroup.com
www.cmegroup.com

Natural Gas GOLD DXY SILVER Oil Price Forecast00:00 Natural Gas stock Bulls NatGas Support & Resistance Guide
05:28 AMEX:UNG Stock Forecast
07:44 USO Oil Stock Forecast
09:43 Gold XAUUSD Stock Forecast
11:00 DXY US dollar Stock Forecast
12:31 Silver XAGUSD

NATURAL GAS Buy inside the Megaphone. Sell beneath.Natural Gas/ NG is trading inside a Bullish Megaphone and the price is now on the corrective wave after the latest Higher High.
Support A at 2.860 is the first line of defense and with the price this much under the 1day MA50, the most optimal buy entry technically within the Megaphone (observe the circles).
Buy now and target 3.600 (Resistance A).
Sell if the price crosses under the Megaphone and target 2.500 (top of Support Zone A). This is not unlikely as the 1day MA50 is displaying a Bearish Divergence.
Follow us, like the idea and leave a comment below!!


Potential Downtrend NATGAS
The natural gas market is currently experiencing a significant downtrend. As per technical indicators including Fibonacci retracements, Ichimoku cloud analysis, volume trends, MACD (Moving Average Convergence Divergence), and RSI (Relative Strength Index), the price of natural gas has declined notably.
Current levels indicate a potential sell opportunity with a suggested stop-loss (SL) set at 2.955 and a take-profit (TP) target at 2.730.

NATTY 15% Correction on the way?Natural Gas has recorded a negative bearish divergence on the 4hr which I believe is the sign of a correction to retest the green base below.
It had fired on all of it's cylinders yesterday which I believe was a dead cat bounce removing as many short sellers as possible.
Shorting this time of year usually means commission from your broker - mine is offering 3% of my total investment.

Natural Gas: Over storage due to recency bias?So far we’ve covered Natural Gas twice, once in October 2022 , followed by another in May 2023 .
As highlighted in both pieces we are generally longer-term bullish on natural gas but we do see some opportunities for a short-term tactical position now.
As winter approaches, the harrowing memories of natural gas price movements during the previous winter seasons keep us vigilant. Some key points we find interesting now include the natural gas storage levels in the EU and US, unseasonal weather, price seasonality, and natural gas price action.
Natural gas storage
Natural Gas storage typically follows two clear seasonal trends: the winter withdrawal season and the summer injection season, with the summer months being April to October and winter from November to March.
The chart below shows the storage level across time in the US. Current US Storage levels are close to the previous high in 2020.
While in the EU, current gas storage levels are the highest they've been over the last five years.
These high storage levels come off the back of a massive rally in natural gas prices in the 2021-2022 period. Which leads us to question, could this be attributed to recency bias? Have markets become over-prepared, with storage levels so high?
Unseasonal weather
One rationale for high storage levels is preparation for a harsh winter. The build-up of gas storage in the EU, particularly, was spurred by a warmer-than-expected start to the winter, resulting in less gas usage for heating.
Forecasts also predict the 2023 winter in the EU & US to be warmer than average. A recent Bloomberg article on Natural Gas states:
“Data generated by the Copernicus Climate Change Service signals a minimum 50% probability that most of Europe will experience well-above average temperatures between December and February. The Balkans, Italy and the Iberian peninsula have a 60% to 70% chance of exceeding median historical temperatures over the past three decades.”
The EIA adds:
“We estimate that U.S. natural gas inventories totaled 3,835 billion cubic (Bcf) feet at the end of October, 6% more than the five-year (2018–2022) average. We forecast U.S. natural gas inventories will end the winter heating season (November–March) 21% above the five-year average with almost 2,000 Bcf in storage. Inventories are full because of high natural gas production and warmer-than-average winter weather, which reduces demand for space heating in the commercial and residential sectors.”
High storage levels, coupled with lower-than-expected demand due to warm weather, could signal further weakness for Natural Gas…
Price Seasonality
Adding to this is the general price seasonality of Natural Gas. Over the past six years, the August to end-of-October period generally sees a gradual rise, followed by a decline from December to January. With this year’s price behavior aligning with past trends, we could very likely see a downturn in prices heading towards the end of the year and into January.
Price Action
On a longer-term time frame, the 3.610 level has repeatedly served as both support and resistance.
On a shorter timeframe, natural gas has been trading in a defined broadening formation, likely indicating increased price volatility.
To express our short-term bearish view, we can take a short position on the CME Henry Hub Natural Gas Futures at the current level of 3.089, setting the stop at the resistance above at 3.26 and take profit of 2.62. Each 0.001 point move in the Henry Hub Natural Gas Futures is for 10 USD.
The charts above were generated using CME’s Real-Time data available on TradingView. Inspirante Trading Solutions is subscribed to both TradingView Premium and CME Real-time Market Data which allows us to identify trading set-ups in real-time and express our market opinions. If you have futures in your trading portfolio, you can check out on CME Group data plans available that suit your trading needs www.tradingview.com
Disclaimer:
The contents in this Idea are intended for information purpose only and do not constitute investment recommendation or advice. Nor are they used to promote any specific products or services. They serve as an integral part of a case study to demonstrate fundamental concepts in risk management under given market scenarios. A full version of the disclaimer is available in our profile description.
Reference:
www.eia.gov
www.bloomberg.com
www.eia.gov
www.bloomberg.com
www.bloomberg.com
www.cmegroup.com

Wisdom Tree Natural Gas Potential Set upWisdomTree Natural Gas
Exchange Traded Commodity (ETC)
Noticed a potential repeating reversal pattern:
- Break above the 200 day
- Ascending triangle forming
- Rising RSI
Ideal Trade: Waiting for a break above the Triangle, enter then with a stop under the breakout point. We can revisit this and see how things progress. One to keep an eye on. Winter is coming. FYI this chart is in EURO. FX:NGAS #NaturalGas
PUKA

Natural Gas DXY GOLD SILVER OIL Price Forecast00:00 Natural Gas stock Bulls NatGas Support & Resistance Guide
04:18 AMEX:UNG Stock Forecast
05:18 USO Oil Stock Forecast
06:48 Gold XAUUSD Stock Forecast
08:13 DXY US dollar Stock Forecast
10:03 Silver XAGUSD


NATURAL GAS - NatGas - LongRetest of 0,61 unitl leg 1
double bottom above support area -- false break out with recovery of price livel
.. potential upside for the next move.

NATURAL GAS - NatGas - Longaccumulation of new position
I have three position long .. this is the last for a potential C

Natural Gas DXY GOLD SILVER OIL Price Forecast00:00 Natural Gas stock Bulls NatGas Support & Resistance Guide
07:51 AMEX:UNG Stock Forecast
10:24 USO Oil Stock Forecast
13:33 Gold XAUUSD Stock Forecast
15:50 DXY US dollar Stock Forecast
18:20 Silver XAGUSD

SPX holding strong ahead of CPIS&P500 (-0.1%), QQQ (- 0.31%), IWM (+ 0.04%)
Tech was weak today and a bearish gap has opened on Microsoft & Apple
CPI 3.3% YOY forecast.

NATGAS will it continue down?Natgas is holding below the support (range), if it is able to get back, it will be able to make a retracement to 0.5 fib. Otherwise, if it is still rejected and the price closes under. Natgas will continue on 3d.

NATURUAL GAS Buy/LongAnalysis for NATURAL GAS on the daily direction has shown an upswing for a bullish trend that has respected the support levels. Since September 7th, 2023, we have seen a nice back and forth movement pattern that continues to respect the channels support range and resistance making this a prime target for us to be able to profit off on. Please enter with proper caution and capital risk management. Below is the signals inputs for the trading session. I hope you all enjoy.
NATRUAL GAS
Buy/Long
Entry: 3.2361
Stop Loss: 3.0203
Target:
TP: 3.9035
DAY TRADE/SWING TRADE
Risk: 2-5% of Capital

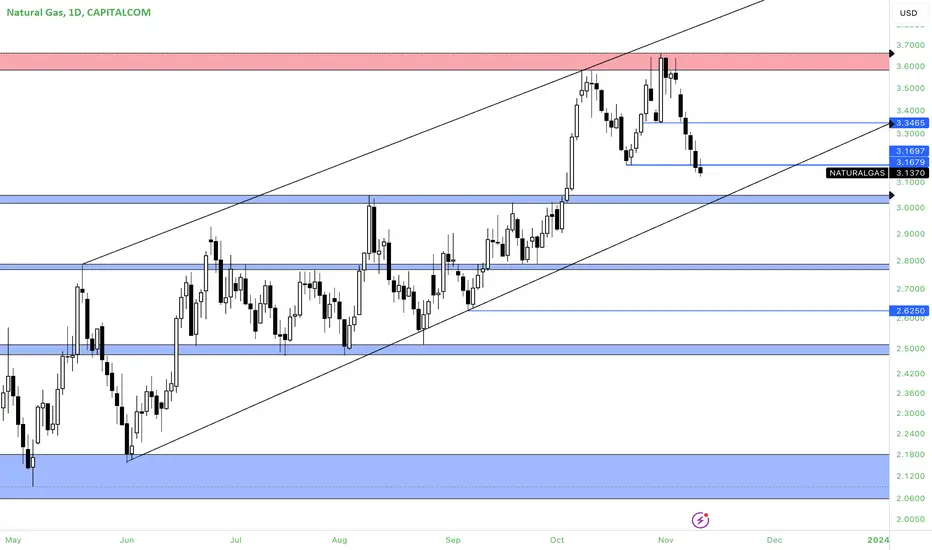
Natural Gas - Daily - Update Natural Gas - Daily - Update
These are my keylevels for Natural Gas on daily time frame