8 DAYS OF UPSIDE IN S&P 500!Markets have had an extraordinary move to the upside with 8 days of consecutive gains and 9 days in the QQQ.
Semiconductors often lead the market and have now hit major resistance.
Microsoft has almost completed its bullish move.
Natural Gas

NATURAL GAS: Rebound expected near the 1D MA50.Natural Gas is on a six day bearish streak, turning neutral on the 1D technical outlook (RSI = 47.415, MACD = 0.105, ADX = 27.914). The pattern since April is a Bullish Megaphone and every pullback like this, has been a buy opportunity. The last one reversed just before it hit the 1D MA50, and as the 1D RSI is also near the S1 level, we turn bullish, targeting the R1 level (TP = 3.645).
## If you like our free content follow our profile to get more daily ideas. ##
## Comments and likes are greatly appreciated. ##

NATURAL GAS : DEEP CRABNATURAL GAS: DEEP CRAB
to Watch: EMA.50 and EMA.200
+ Fibonacci levels
+ ICHIMOKU levels

Natural Gas & Oil looking heavyThe energy market may see some headwinds in the next 1-2 weeks.
Natural Gas storage update on Thursday.
Oil has triggered a head & shoulder pattern

Natural Gas OIL GOLD DXY Silver Price Forecast00:00 Natural Gas stock Bulls NatGas Support & Resistance Guide
03:50 AMEX:UNG Stock Forecast
06:04 USO Oil Stock Forecast
08:00 Gold XAUUSD Stock Forecast
09:46 DXY US dollar Stock Forecast
11:56 Silver XAGUSD
#naturalgas #xauusd #dxy #xagusd #natgas #naturalgastechnicalanalysis #technicalanalysis #tradingstrategy #daytrading #naturalgasanalysis #naturalgastrading #natgasanalysis #uso #crudeoil

Natural Gas - Keylevels - DailyNatural Gas remains in a downward trend, we are getting closer to winter, and demand will increase.
Why doesn't the price increase more?
Or...why doesn't the price increase according to your expectations?
Simple..
The story of the war has calmed down and the FUD on prices has decreased and in addition to that, the main factor is that in several countries in EUROPE, the price of gas is capped, so that regardless of demand and supply, the price on the bill remains the same .
My opinion is that if this winter we see Natural Gas between 4-6 dollars, it would be advisable to mark our profits and wait for next year.

Natural Gas OIL GOLD DXY Silver Price Forecast00:00 Natural Gas stock Bulls NatGas Support & Resistance Guide
05:15 AMEX:UNG Stock Forecast
06:42 USO Oil Stock Forecast
09:00 Gold XAUUSD Stock Forecast
11:11 US dollar DXY Stock Forecast
13:26 Silver XAGUSD

Natural Gas - Big moves aheadNATGAS has been putting in consecutive higher highs for the better part of a month. This is indicative of a further move up as called over a month ago. Until this trend is broken we remain bullish and are looking to break the first resistance which should then lead us to 3.5$ very quickly.
BULLISH

Natural Gas DXY GOLD SILVER USO Price ForecastNatural Gas DXY GOLD SILVER USO Price Forecast
Natural Gas Natgas Stock forming equilibrium pattern
00:00 Natural Gas stock Bulls NatGas Support & Resistance Guide
05:44 AMEX:UNG Stock Forecast
06:50 USO Oil Stock Forecast
09:41 Gold XAUUSD Stock Forecast
11:17 US dollar DXY Stock Forecast
13:47 Silver XAGUSD

Natural Gas - Elliott Wave CountNatural Gas - Elliott Wave Count
this is an update to the previous view.
Yesterday, the market completed the 4th wave of its price movement cycle and has since entered the 5th wave. This represents a continuation of the current trend, and we can anticipate a positive recovery in the upward direction once the 5th wave is completed. This signals a potential opportunity for investors to consider taking advantage of the market's recovery trend.
In light of this, we recommend refraining from taking short positions in a bull market. Instead, it would be prudent to wait for a reversal and take a long position.
Please note that this information is solely for educational purposes, and it is essential to exercise caution when trading.
CAPITALCOM:NATURALGAS FOREXCOM:NATURALGASCFD MCX:NATURALGAS1! CITYINDEX:NATURALGASCFD PEPPERSTONE:NATGAS SKILLING:NATGAS

NG target $3.0 and $3.6Natural Gas has been consolidating since Mar 2023 and has formed a round bottom. I expect NG to hit the first target $3.0 within next 1-2 weeks and then consolidate at those levels before the hitting target $3.6, which will be a conjunction of two resistance lines blue and white. Let me know your thoughts in comments.

Natural Gas Price Forecast DXY OIL GOLD SILVERWelcome to the everyday how to make money online trading with Natural Gas Technical Analysis show, where I give you guys support & resistance levels to potentially play off of. As well as both sides perspective of a bear and a bull to give us a better understanding of where our trades are currently and not have a bias
- Natural Gas Natgas Stock forming equilibrium pattern
#naturalgas #xauusd #dxy #xagusd #natgas #naturalgastechnicalanalysis #technicalanalysis #tradingstrategy #daytrading #naturalgasanalysis #naturalgastrading #natgasanalysis #uso #crudeoil
00:00 Natural Gas stock Bulls PEPPERSTONE:NATGAS Support & Resistance Guide
05:44 AMEX:UNG Stock Forecast
06:50 AMEX:USO Oil Stock Forecast
09:41 Gold OANDA:XAUUSD Stock Forecast
11:17 US dollar DXY Stock Forecast
13:47 Silver OANDA:XAGUSD

#NATURALGAS LONG TRADE IDEA SETUPGreetings Folks,
today i have prepared a setup of NATURAL GAS on MCX
the analysis is as follows
- the price is looking for a minor reversal
- currently trading at a very important zone
- wait for a retest for entry
dont play with fire, always use a predefined stoploss

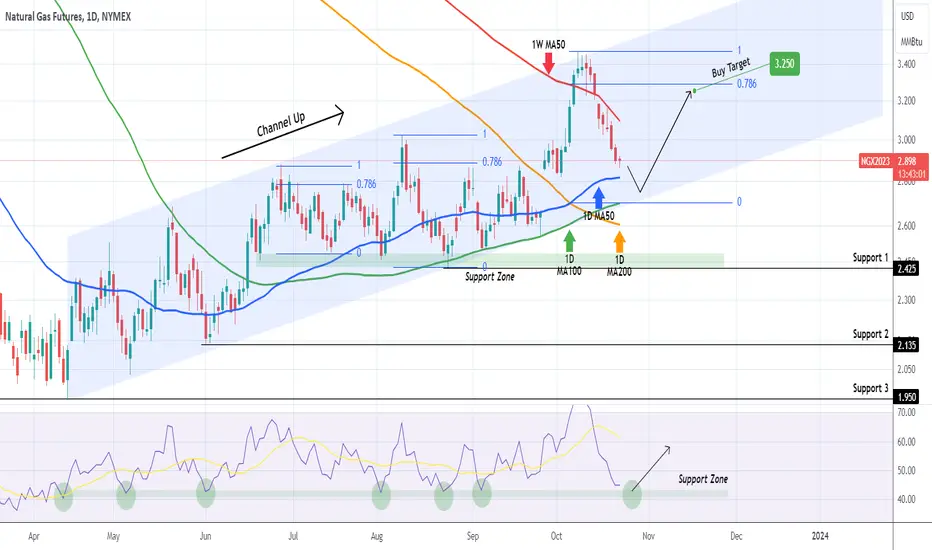
NATURAL GAS Ready to buy at the bottom of the Channel Up?Natural Gas (NG1!) is trading within a logarithmic Channel Up pattern since the April 14 Low. The current bearish leg is one step before testing the 1D MA50 (blue trend-line) but the bottom is located just below the 1D MA100 (green trend-line). That trend-line has priced the last three Higher Lows (September 26, September 06, August 24), so we are ready to buy there and target the 0.786 Fibonacci at 3.250, which has been a standard rebound target since July. The most optimal buy signal though since April 13 is when the 1D RSI enters its Support Zone.
-------------------------------------------------------------------------------
** Please LIKE 👍, FOLLOW ✅, SHARE 🙌 and COMMENT ✍ if you enjoy this idea! Also share your ideas and charts in the comments section below! This is best way to keep it relevant, support us, keep the content here free and allow the idea to reach as many people as possible. **
-------------------------------------------------------------------------------
💸💸💸💸💸💸
👇 👇 👇 👇 👇 👇
Natural Gas DXY Gold Silver Price Forecast 00:00 Natural Gas stock Bulls NatGas Support & Resistance Guide
04:50 AMEX:UNG Stock Forecast
07:06 USO Oil Stock Forecast
08:57 Gold XAUUSD Stock Forecast
11:20 US dollar DXY Stock Forecast
13:25 Silver XAGUSD

Natural Gas Price Forecast & 7 Mega Cap Tech Stocks Forecast00:00 Natural Gas stock Bulls NatGas Support & Resistance Guide
04:39 AMEX:UNG Stock Forecast
05:16 USO Oil Stock Forecast
06:27 Gold XAUUSD Stock Forecast
07:21 Silver XAGUSD forecast
06:37 US dollar DXY Stock Forecast
10:37 QQQ Stock Price Forecast
13:36 Sp500 ETF Price Forecast
15:00 Tesla Stock TSLA Forecast Technical Analysis
17:14 Nvidia Stock NVDA Forecast Technical Analysis
18:10 Apple Stock AAPL Forecast Technical Analysis
19:00 Amazon Stock AMZN Forecast Technical Analysis
19:59 Google Stock GOOGL Forecast Technical Analysis
21:43 Microsoft Stock MSFT Forecast Technical Analysis
24:09 Meta Forecast Technical Analysis

Natural Gas - Elliott Wave Count UpdateNatural Gas - Elliott Wave Count
this is an update to the previous view.
Today, the market reached a new low after a few consecutive days of decline. The current reversal appears to be the start of wave C of 4. However, it is best not to rush into buying at this moment. We can anticipate another low after the completion of wave 4, which will be an excellent opportunity to buy for a significant gain.
Please note that this information is solely for educational purposes, and it is essential to exercise caution when trading.
CAPITALCOM:NATURALGAS MCX:NATURALGAS1! FOREXCOM:NATURALGASCFD PEPPERSTONE:NATGAS CITYINDEX:NATURALGASCFD MOEX:NG1! NYMEX:NG1! VANTAGE:NG

Natural gas - UpdateNatural gas - Elliott wave count
Weekly chart seems like bearish which is completely opposite to our view which we posted earlier.. this bearish view also possible so better be careful or atleast wait for some good reversal signal to take buy.
This is an update to the previous view posted.

Macro Oil Blueprints: Energy Schematics This chart consists of USOIL, Heating Oil, Gasoline, Natural Gas, Palm Oil, and Rubber futures.
Every one is tailored to a Fibonacci Layout. There are two sets of extensions. They interlap and work together. One must look for the support and resistance to verify its authenticity.

Bullish Scenario MPLXMPLX Price Targets :
$38.89
$39.91
$45.24
MPLX LP Overview:
MPLX LP is a diversified, large-cap master limited partnership formed by Marathon Petroleum Corporation (MPC). The company owns and operates a wide range of midstream energy infrastructure and logistics assets, in addition to providing fuels distribution services. MPLX's asset portfolio is extensive and includes:
Crude Oil and Refined Product Pipelines: MPLX manages a network of pipelines designed for the transportation of both crude oil and refined petroleum products. These pipelines play a vital role in the distribution of energy resources.
Inland Marine Business: The company is involved in an inland marine business, which likely includes the transportation of energy-related products via inland waterways.
Light-Product Terminals: MPLX owns terminals specifically for handling light petroleum products.
Storage Caverns and Tanks: The company has storage facilities, including caverns, refinery tanks, docks, loading racks, and associated piping for storing energy products.
Crude Oil and Light-Product Marine Terminals: These are terminals used for the efficient transfer of crude oil and light petroleum products.
Gathering Systems and Pipelines: MPLX owns and operates gathering systems and pipelines for both crude oil and natural gas.
Natural Gas and NGL Processing: The company is involved in the processing and fractionation of natural gas and natural gas liquids (NGL) in key U.S. supply basins.
MPLX's business model encompasses various aspects of the midstream energy sector, with a focus on transportation, storage, and processing of energy products. Please note that the status and details of companies can change over time, so for the most current information about MPLX LP, it's advisable to refer to the company's official documents and reports.

TTF Gas - Potential ABCSeasonal European NatGas is week, but typically in August the rebound starts regarding due to the hedging of winter demand. The chart already shows a potential pattern, i.e. a potential ABC embedded in a channel. If this channel breaks, we might see an increase to 45 €/MWh.

Natural Gas Price Forecast & 7 Mega Cap Tech Stocks Forecast00:00 Natural Gas stock Bulls NatGas Support & Resistance Guide
02:48 AMEX:UNG Stock Forecast
03:55 USO Oil Stock Forecast
04:52 Gold XAUUSD Stock Forecast
05:58 US dollar DXY Stock Forecast
07:44 QQQ Stock Price Forecast
11:04 Sp500 ETF Price Forecast
12:18 Tesla Stock TSLA Forecast Technical Analysis
13:28 Nvidia Stock NVDA Forecast Technical Analysis
15:21 Apple Stock AAPL Forecast Technical Analysis
16:34 Amazon Stock AMZN Forecast Technical Analysis
17:23 Google Stock GOOGL Forecast Technical Analysis
18:05 Microsoft Stock MSFT Forecast Technical Analysis
18:52 Meta Forecast Technical Analysis

Natural Gas Price Forecast & 7 Mega Cap Tech Stocks ForecastWelcome to the everyday how to make money online trading with Natural Gas Technical Analysis show, where I give you guys support & resistance levels to potentially play off of. As well as both sides perspective of a bear and a bull to give us a better understanding of where our trades are currently and not have a bias
- Natural Gas Natgas Stock in a daily uptrend
- natural gas ideally bounce at 3.18
#naturalgas #xauusd #dxy #xagusd #natgas #naturalgastechnicalanalysis #technicalanalysis #tradingstrategy #daytrading #naturalgasanalysis #naturalgastrading #natgasanalysis #uso #crudeoil
00:00 Seasonality Data
01:05 QQQ Stock Price Forecast
04:04 Sp500 ETF Price Forecast
05:33 Tesla Stock TSLA Forecast Technical Analysis
07:13 Nvidia Stock NVDA Forecast Technical Analysis
08:51 Apple Stock AAPL Forecast Technical Analysis
09:59 Amazon Stock AMZN Forecast Technical Analysis
10:45 Google Stock GOOGL Forecast Technical Analysis
11:27 Microsoft Stock MSFT Forecast Technical Analysis
13:04 Meta Forecast Technical Analysis
14:16 Natural Gas stock Bulls NatGas Support & Resistance Guide
16:18 AMEX:UNG Stock Forecast
17:08 USO Oil Stock Forecast
18:06 Gold XAUUSD Stock Forecast
19:00 US dollar DXY Stock Forecast
