NATGASUSD Is About to Start Outperforming WTICOUSDWTICOUSD has developed a Diamond Top pAttern at the HOP level of a Bearish Shark and has given Bearish PPO Confirmnation Arrow at this level. Along with that, the PPO has broken below trend and may now look to crash lower. If we are to take all these indications into account, we can safely assume that WTICO is about to Bearishly break down from the Diamond it's formed against NATGAS. This could mean a few things, but mainly it means that either Natural Gas is about to start going up a lot or WTICO is about to start going down a lot, or maybe a combination of the two.
In anticipation of this, I will primarily be buying Natural Gas Related Assets and Selling Oil Related Assets.
Natural Gas

+90% Natural GasIs natural gas a good stock to buy?
When investing in natural gas stocks, it is important to look for companies with good financial stability, and a strong history of profitability. Natural gas stocks can be a good investment for stock market investors. This is because natural gas prices are expected to continue to rise in the future.

Huge Move now Consolidate from NGS Natural Gas ServiceThis ticker is red hot. Can extend up another 10% or so, but it is most likely to consolidate downward for a couple months now.
The long term energy commodities trend remains bullish, so do not fear some short-term bearishness
Natural Gas Services Group, Inc. provides natural gas compression services and equipment to the energy industry in the United States. It fabricates, manufactures, rents, sells, and maintains natural gas compressors and flare systems for oil and natural gas production and plant facilities. The company primarily engages in the rental of compression units that provide small, medium, and large horsepower applications for unconventional oil and natural gas production. As of December 31, 2022, the company had 1,869 natural gas compression units in its rental fleet with 425,340 horsepower. The company also engages in the design, fabrication, and assembly of compressor components into compressor units for rental or sale; engineers and fabricates natural gas compressors; and designs and manufactures a line of reciprocating compressor frames, cylinders, and parts. In addition, it is involved in the design, fabrication, sale, installation, and service of flare stacks and related ignition and control devices for the onshore and offshore incineration of gas compounds, such as hydrogen sulfide, carbon dioxide, natural gas, and liquefied petroleum gases.

NATURAL GAS 27/09 MovePair : NATURAL GAS
Description :
It is unable to Break its Consolidation Phase. Impulse Correction completed in a Corrective Pattern " Rising Wedge " with a Breakout of the Lower Trend Line and Retracement in Short Time Frame with Strong Divergence

Oil Gold Silver DXY Natural Gas Price ForecastWelcome to the everyday how to make money online trading with Natural Gas Technical Analysis show, where I give you guys support & resistance levels to potentially play off of. As well as both sides perspective of a bear and a bull to give us a better understanding of where our trades are currently and not have a bias
- Natural Gas Natgas Stock in confirmed daily uptrend
- Strongest resistance for natural gas resistance is 2.86
#naturalgas #xauusd #xagusd #natgas #naturalgastechnicalanalysis #technicalanalysis #tradingstrategy #daytrading #naturalgasanalysis #naturalgastrading #natgasanalysis #dxy
00:00 Natural Gas stock Bulls NatGas Support & Resistance Guide
04:11 AMEX:UNG Stock Forecast
06:55 USO Oil Stock Forecast
10:38 Gold XAUUSD Stock Forecast
12:25 US dollar DXY Stock Forecast
14:39 Silver XAGUSD Stock Forecast

Natural Gas, DXY, GOLD , SILVER Price ForecastWelcome to the everyday how to make money online trading with Natural Gas Technical Analysis show, where I give you guys support & resistance levels to potentially play off of. As well as both sides perspective of a bear and a bull to give us a better understanding of where our trades are currently and not have a bias
- Natural Gas Natgas Stock in confirmed daily uptrend
- Strongest resistance for natural gas resistance is 2.86
00:00 Natural Gas stock Bulls NatGas Support & Resistance Guide
06:28 AMEX:UNG technical Analysis
09:28 Gold XAUUSD analysis
11:39 US dollar DXY
14:45 Silver XAGUSD analysis

NATURAL GAS Moment of truth on the 1day MA200.Natural Gas / NG is trading at the moment between the 1day MA50 and the 1day MA50. The latter hasn't been breached or even touched since December 13 2022.
The pattern is an Ascending Triangle which has inside it a Bullish Megaphone pattern.
The common feature is the Rising Support. If the price gets rejected on the 1day MA200 and breaks the Rising Support, we will see a first test of Support Zone A.
Sell the first bounce and target 2.140 (Support B).
If on the contrary the 1day MA200 breaks first, buy and target 3.030 (Resistance A).
Follow us, like the idea and leave a comment below!!

Natural Gas DXY GOLD SILVER Price ForecastWelcome to the everyday how to make money online trading with Natural Gas Technical Analysis show, where I give you guys support & resistance levels to potentially play off of. As well as both sides perspective of a bear and a bull to give us a better understanding of where our trades are currently and not have a bias

Natural gas will go higher!So, we are back with another trend analysis and new support/resistance levels.
We have had a major pullback from our latest resistance level of 3 back to around 2.8~. Which is fine, its natural.
But I still strongly believe in a major bull run and upside in natural gas, which is why I believe we have to go higher, and we will in the last 2 quarters of 2023.
We have resistance level around 3.3~ - this was tested back in October/November 2020 and most recent around January 2023. This is my first target price (TP 1).
What happens after this is hard to guess at this point of time.
Will we have another energy crisis? What about the war in Ukraine and Russia? My best guess is that we will go higher after reaching 3.3 – but only time will tell.
Let me know what you guys think!
Good luck!

My view on Natural GasNaturalgas
forming Cup & Handle pattern
above 233-234
tgt 240-244-250++
My SL 226
keeping on radar NG 230 CE (Hero/Zero)

natural gas gold silver DXY forecastsupport and resistance guide natural gas gold silver DXY forecast

Natural Gas - Bullish Close Natural Gas just closed above the daily 200 MA for the first time since Nov 2022.
This could signify a big shift in the Nat Gas market and may trigger funds to start accumulating in the long side as they boil full portfolio positions.

Market Analysis Ahead of Fed MeetingThe FOMC is set to have their 2 day meeting.
Market consensus is for a pause in rate hikes.
Will the Fed shock the market like the ECB just did with their rate hike?
The treasury yields market is still in a very strong uptrend & inflation expectations over the last 2 CPI prints have come in hotter due to energy.
the markets are in a ver y precarious spot with the small caps & equal weight indices on the verge of breaking down. Will tech save the day?

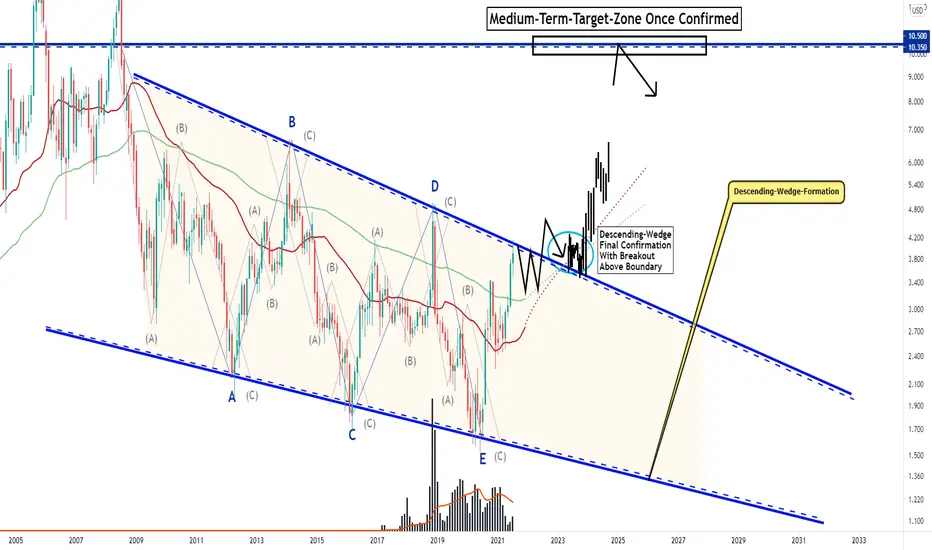
NATURAL GAS, Century Descending-Wedge Breakout Incoming!Hello,
Welcome to this analysis about Natural Gas and the monthly timeframe perspectives. Natural Gas over the last times as I discovered has built a massive formation which will be an important source in the upcoming times and especially when it completes the developments happening after the confirmation will be huge. Besides that, there are also other fundamental factors that play into a potential bullish increase and the developments that can be seen in real price-action. Therefore I am looking at all the important levels and upcoming determinations we should consider with Natural Gas's established structure and the upcoming movements ahead of the next times.
Structural Technical Developments:
As when looking at my chart we can watch there how Natural Gas has formed this major formational structure with several bounces to the upside from the lower supports every time holding these supports and increasing with volatility and volume which is a good sign for stabilization. Furthermore mainly Natural Gas is forming this massive reversal formation, this formation is a descending-wedge-formation which is known as a solid bullish reversal formation. Natural Gas already managed to complete the coherent wave-count from A to E in this formation and is now penetrating the upper boundary of the formation with the recent bullish move. Besides that Natural Gas is now holding above the 35-EMA in red and the 100-EMA in green which it had previously as resistance and is now appropriate support.
Upcoming Perspectives And Fundamentals:
Taking all these factors into the consideration this formation has a good potential to complete in the upcoming times which will happen with a final breakout above the upper boundary, this will complete the formation and will also activate upside targets marked in my chart within the 10 areas. From a fundamental perspective, there is the thing with governments altering the gas price higher with setting taxes and extra fees on the gas because more and more governments looking to increase renewable energies these are measures actively taken by governments to switch from fossil energy to renewable. This is why the actual gas price will go up higher in the next times to come as the regulatory body step by step is setting the price higher which is also corresponding with the technical development suggested, therefore the bullish case has an increased likelihood here, it will be an interesting journey ahead.
In this manner, thank you for watching my update-analysis about NATURAL GAS and the main descending-wedge and its breakout likely to emerge in the upcoming times, great when you support it with a like and follow or comment for more market insight!
"There are many roads to prosperity, but one must be taken."
Information provided is only educational and should not be used to take action in the market.
Natural Gas Gold silver DXY Price Forecast support & resistance guide of Natural Gas Gold silver DXY

Is Natural Gas(NG) Preparing for a Big Bounce???Technical Analysis:
- Natural Gas is in a weekly edging buy area and any moment it can bounce once wave (5) in blue will be done
- Anyway, the big probability with actual data is that a small extend could happen in the wave (5)
- H1 right side is turning down
- H4 right side is down
Technical Information:
- If you're a position trader or long term investor, you may buy in the actual level
- And if you're a swing trader, wait for possible extend in wave (5)

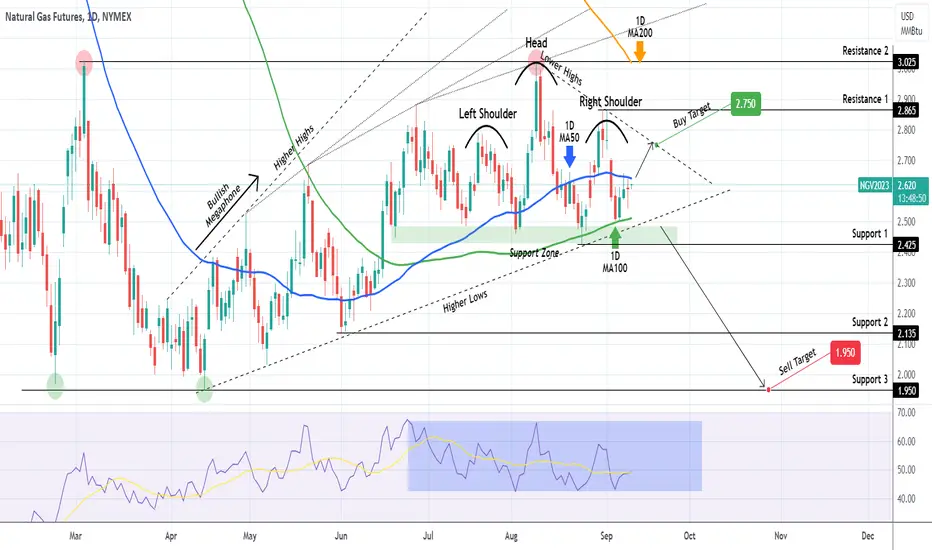
NATURAL GAS Short-term buy but expect long-term reversal soon.Natural Gas (NG!) is struggling to get past the 1D MA50 (blue trend-line), which is the short-term Resistance and at the same time is supported by the 1D MA100 (green trend-line). The long-term pattern is a Bullish Megaphone and besides the 1D MA100, the price action is supported by the pattern's bottom (Higher Lows trend-line).
Recently however the pattern that has emerged is a Head and Shoulders (H&S) and it remains to be seen if it establishes itself on the immediate price action, which technically means a sharp decline, as in theory it is a bearish pattern.
On the short-term, you can buy up to the Lower Highs trend-line and target 2.750. On the long-term we believe the upside is limited by the 1D MA200 (orange trend-line), which is now on Resistance 2 (3.025) and most likely will reject any spike on Resistance 1 (2.865).
So on the long-term, if the price breaks and closes a 1D candle below the 1D MA100 and Higher Lows trend-line, we will open a long-term sell and target 1.950 (Support 3).
-------------------------------------------------------------------------------
** Please LIKE 👍, FOLLOW ✅, SHARE 🙌 and COMMENT ✍ if you enjoy this idea! Also share your ideas and charts in the comments section below! **
-------------------------------------------------------------------------------
💸💸💸💸💸💸
👇 👇 👇 👇 👇 👇
Natural Gas Gold Silver DXY Price forecastsupport & Resistance guide Natural Gas Gold Silver DXY Price forecast

natural gas dxy gold and silver forecastsupport and resistance natural gas dxy gold and silver forecast

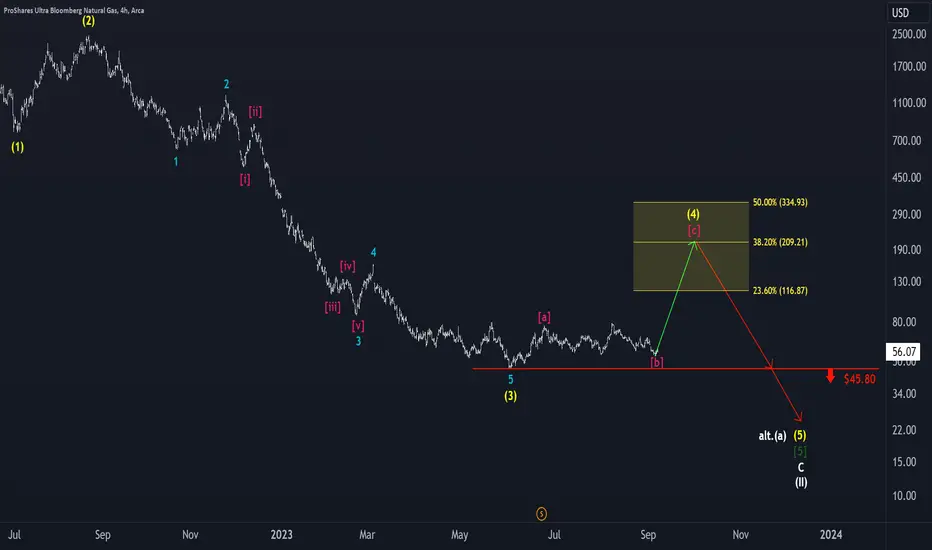
BOIL: One more climb to go 🏔️BOIL's price has successfully wrapped up the magenta wave (b). Looking ahead, we foresee an ascent in the fourth leg of the yellow five-part wave, targeting the yellow Target Zone between $116.87 and $334.93. Following this ascent, a substantial decline is expected, bringing the price down to around $23, signaling the conclusion of the white wave (II). This yellow Target Zone presents an opportune moment for initiating short positions to capitalize on the anticipated bearish movement.
Natural Gas Gold Silver US dollar ForecastSupport and resistance guide of Natural Gas Gold Silver US dollar Forecast

NATURAL GAS: Trade above or below these levels.Natural Gas is basically neutral on the 1D timeframe (RSI = 47.497, MACD = -0.005, ADX = 30.454) supported by the S1 Zone (holding since June 21st) and restrained below the LH trendline. The 1D RSI is inside a Rectangle, which since May 4th has given excellent sell entries on its top and buy entries on its bottom. You may trade according to that but we will take a breakout approach and sell if the price breaks under the S1 Zone on the first rebound and target S2 (TP = 2.210) or above the LH trendline and target the 1D MA200 (TP = 2.900).
## If you like our free content follow our profile to get more daily ideas. ##
## Comments and likes are greatly appreciated. ##

$KOLD one more leg up? Short Natural gas for 100% gain?Really liking the look of the AMEX:KOLD chart.
We've largely been in sideways consolidation since early February and with the recent test of the bottom of the structure, KOLD looks poised to move higher.
I bought throughout the day today with the average entry at $61.23. I'm looking for around 100% move to the upper resistance.
Risks:
- A reversal that goes through the bottom support of the structure
- 1 more retest of the bottom of the structure before the real move starts (if that happens, I'd be looking at price action having a tough time making it through $72 leading to a reversal).
Reward:
Upside 100% with an exit at $123.29
