Natural Gas DXY Gold Silver Forecastsupport and resistance guide Natural Gas DXY Gold Silver Forecast
and price action analysis
Natural Gas

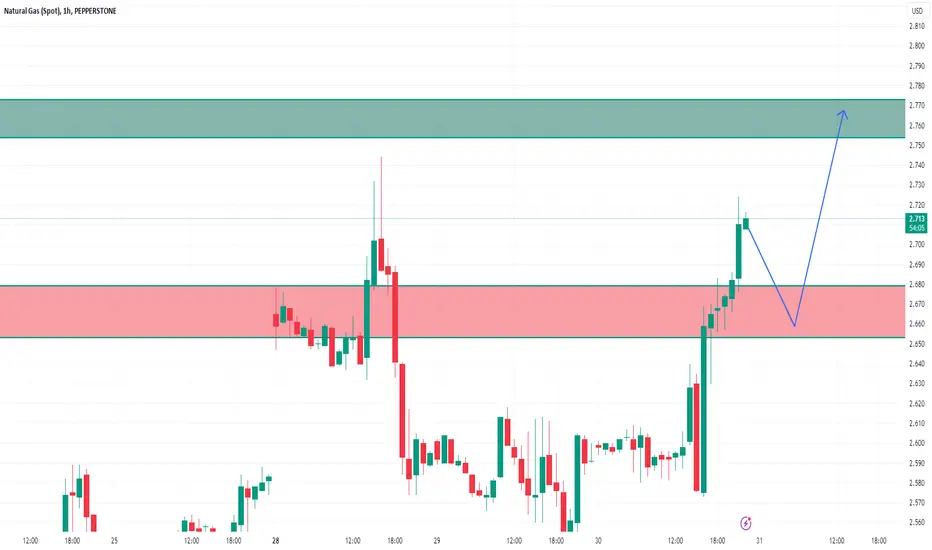
Natural GasAs noted to our members, Natural Gas rejected that 2740 area and is now heading back to retest the 2700 area.
We should see a bounce in this area back up for a longer-term bullish move.
As a scalper, this is an excellent area for a BUY opportunity.
Thoughts?

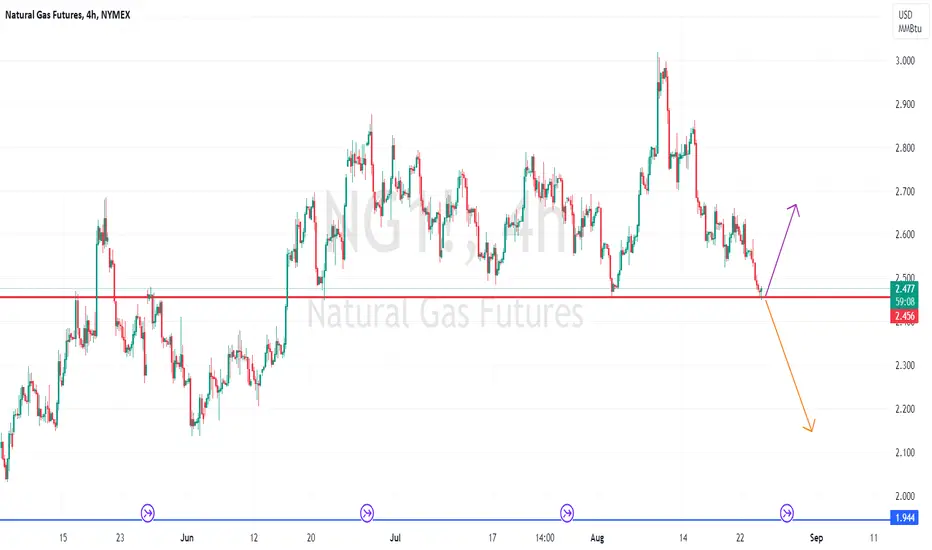
The Lengthy Wave 4 BeginsWe don't usually advise trading wave 4's as they can get overly complicated, however upon waiting for what should be the minute wave B we are advising our clients to go long as there is an off chance the minute wave C could be a minor wave 3 if the bottom is in. This is not our primary count though and we believe there is one more intermediate wave down to complete the primary wave C. Going long in our green box around $2.4 should provide us with at least 800 points of movement to $3.2 to complete the minor wave A. As always when trading natural gas you have to be prepared for extreme volatility and manipulation so be sensible with your position sizing.
Here's a closer look at the recent price action -

Natural Gas Gold Silver DXY forecast- Natural Gas Natgas Stock in daily neutral trend
- Natural Gas Natgas needs a daily trend change to uptrend
- Next level for natural gas needs break above 2.86

NG1! - The heating season is coming up soon.ahead of the heating.
Everyone needs gas.
The war will make gas more expensive.
if you like the idea, please "Like" it. This is the best "Thanks!" for the author 😊 P.S. Always do your own analysis before a trade. Put a stop loss. Fix profits in installments. Withdraw profits in fiat and please yourself and your friends.

Natural Gas DXY Gold SIlver FORECASTNatural Gas DXY Gold SIlver FORECAST
Price action Trend analysis

NATGAS LONG TERM TRADE analysiAug 27
Hello Traders
In This Chart NATGAS HOURLY Forex Forecast By FOREX PLANET
today NATGAS analysis 👆
🟢This Chart includes_ (NATGAS market update)
🟢What is The Next Opportunity on NATGAS Market
🟢how to Enter to the Valid Entry With Assurance Profit
This CHART is For Trader's that Want to Improve Their Technical Analysis Skills and Their Trading By Understanding How To Analyze The Market Using Multiple Timeframes and Understanding The Bigger Picture on the Charts

Natural Gas Gold Silver DXY ForecastNatural Gas Gold Silver DXY Forecast.
Big bounce but give most of it back

NG at multi timeframe support#NATURAL GAS... market is at his multi timeframe supporting level 2.45
its market most important and traded area form last few decades,
again market is at his level and winter season is on his way,
but it should hold this level for again bounce back..
otherwise downside we have next area that is mentioned on chart. 4
trade wisely
good luck

Is the Price of Natural Gas Forming a New Trend?The US Energy Information Administration said on Thursday that natural gas inventories in US storage rose by 18 billion cubic feet in the week ended Aug. 18. That was below the 29 billion cubic feet increase forecast by analysts polled by S&P Global Commodity Insights.
It is possible that market participants thought that insufficient filling of storage facilities will lead to a rise in gas prices in the coming winter. According to the forecast of the International Energy Agency (IEA), the price of gas will peak at USD 3.44/MMBtu in December 2023 (approximately +36% from current levels).
The natural gas price chart shows that:
→ in July-August, a series of rising supports was formed;
→ the peak of August is higher than the peak of June, which in turn is higher than the peak of May.
A sequence of higher extremes could indicate that the market is in an uptrend that could bring the price closer to the IEA's price targets. The nearest resistance on this way is the level of 2.78, which in July-August repeatedly influenced the price dynamics.
This article represents the opinion of the Companies operating under the FXOpen brand only. It is not to be construed as an offer, solicitation, or recommendation with respect to products and services provided by the Companies operating under the FXOpen brand, nor is it to be considered financial advice.

NatGas - No Moon Until DoomIn mid June, I had made a call that Natural Gas was about to rally, because price action and timing supported a move upwards.
Natural Gas - The Girl Who Hopes You Remember Her
But that call became abandoned as I enlightened and improved further, and began to note that rallies were sold off and lows kept being taken.
The trade degenerated into looking at a sweep over $3 and then a sweep over $2.9, and turned into abandonment.
Before we go far, I want to tell you that you need to keep your eyes on the situation with China.
The first thing you notice is that the propaganda machine and politicians are rarely going after "the Chinese Communist Party" but are always going after "China."
This is very strange. China is the world's only 5,000 year country and holds the largest population.
If you think about it even a little bit, the CCP would be so easy to topple, wouldn't it?
Considering the Party has killed a magnitude more of its own people in its century of murder than Hitler did among all races during his years of insanity.
And the CCP and former Chairman Jiang Zemin have the 24-year persecution and organ harvesting genocide against the Falun Dafa spiritual practice hanging over their head like the blade of a guillotine.
You have to keep this in mind and go study it. A really crucial part of the puzzle is that Xi Jinping, for all the criticism and targeting he gets/deserves, has never persecuted Falun Gong.
Instead, Xi's Anti-Corruption Campaign has been killing and ruining the Jiang Faction minions who have conducted and operated the persecution.
Xi has even protected Falun Gong in Hong Kong after fortifying his rule there with the National Security Law following the 2019 Heaven Will Eliminate the CCP protests.
All of this matters very much to the fossil fuels industry because there's a relationship between China and Russia, both in terms of production and demand, that changes greatly if something like the Ukraine War ends or drama over Taiwan suddenly enters nuclear brinkmanship.
Looking at current monthly bars, Natural Gas shows some kind of "Bear Flag."
What you're seeing, really, is an extended consolidation. This is actually potentially really bullish, to the upside, but we need price action to confirm it's time to go.
Unfortunately, July did not show us this.
The sweep of the $2 point and the lows in April was not enough to springboard the move, and that's really telling.
While many may tell you that natural gas is obviously going to a zero-handle, a look at the yearly bars shows such a thesis really does not make sense.
To the contrary, the 2020 pivot should, actually, hold. A classic super long term breakout and retrace.
Moreover, $10 was printed for literally one day in 2022, and that's very strange.
The problem with the moon turning full right now, is shown on 3 month candles, where this current little red blip only has one month left.
This is not a bullish continuation. It's important, in a bullish scenario, to see volume come in and price action to correspondingly reflect that producers want to sell at higher prices and will orca the waves for us normal people.
Moreover, in terms of the overall markets, as I post in this week's SPX call, we may be watching the equities/indexes bear market rally top for real.
SPX - The Sound of a Shattering Iceberg
As for what might be the news driver that harbingers the correction, it may very well be one of the 10 largest banks in America dumping for whatever reason emerges (watch out for commercial real estate):
Charles Schwab - The Harbinger Of The Next Crisis?
I also posted last week that it seems to me oil is about to head for a literal 3-handle.
Oil - A New Long Leg Down Soon Begins
And because we have problems with "Taiwan," which is to say the International Rules Based Order's desire to take over China via Taiwan while the Chinese Communist Party falls, I also believe that Taiwan Semiconductor (TSM) is set up as a probable long hedge through to the end of the year and into 2024:
TSM - Taiwan, Your Semiconductor Long Hedge
Now, in terms of natural gas ranging like it has, sharply dumping, and then beginning a new and major bull impulse, this is not without grounds, for this would be a fractal of the 2020 COVID dump-to-recovery play that saw a doubling into year end:
If this were to play out, we'd see something like $1.60 natural gas into $4.8 by the end of the year or Q1 2024.
After that, we may really see prices that exceed $10 and begin to flirt with all time highs at $15.
The fundamental factors that would cause a 10 bagger on a commodity that literally equates to most of the world's electricity production are fairly significant.
Especially considering "climate change" (lol "climate boiling") is attempting to be used as the pretext/excuse to export the Jiang-CCP Zero COVID social credit system worldwide in a way that far exceeds what was done during the pandemic.
And so for the call, I would say the "short signal" with the markets hanging out in thin air at present, while we're about to begin a new quarterly shift, is a break of the $2.4 level.
You'd want to short that break with a target meaningfully under $1.8 and then cover it without getting greedy.
At that point, it's time to look for longs, and if you're a long term position trader, this may be one of the best opportunities you'll come across.
But it may not really unfold until next year. And this assumes that my analysis is correct.
Right now, daily price action is just showing failure swings, but nobody has stepped in yet to give it the push down the stairs it really needs.

Natural gas bullish rally...Every time when it touches it make new high..let see again this time.naturalgas, NG, natural gas

Woodside Energy Running on FumesASX:WDS (NYSE: NYSE:WDS ) price action looks extended ahead of FY23 Interim Earnings tomorrow (Tues 22/08).
Notable Headwinds: threat of imminent Worker Strikes & CAPITALCOM:OIL_CRUDE / CAPITALCOM:NATURALGAS consolidating amidst Global Economic uncertainty.
Best-case Scenario: ASX:WDS also consolidates between 50-61.8% Fib + Supply/Demand confluence & stays within upward Price Channel.

Natural Gas from Pipelines to PortfoliosNatural gas was once considered a byproduct of oil production. It is now becoming increasingly important as one of the cleanest burning fossil fuels and a key piece of the clean energy transition. Today, it forms the backbone of global energy production.
This paper delves into the supply and demand factors affecting natural gas prices and proposes a long position in Henry Hub Natural Gas Futures (NG1!) to harness gains from seasonal price trends with an entry of 2.484 with a target of 3.099 and a stop loss at 2.172 delivering risk/reward ratio of 2x.
Natural Gas Supply and Demand
Supply
Largest producers and exporters of Natural Gas are US, Russia, Iran, China, Canada, Qatar, Australia, Norway, and Saudi Arabia.
The standout in the list is Russia. Following the conflict in Ukraine, gas exports from Russia plummeted 58% in 2022. This led to price shocks in EU natural gas (TTF). US supply is unable to adequately bridge this deficit as transporting natural gas using ships requires converting it to Liquified Natural Gas (LNG) and using special refrigerated vessels which is not economical for large quantities of natural gas.
This is also why the spread between EU and US natural gas is much wider than EU and US oil.
Notably, US shale reserves have a high concentration of natural gas. Along with newly developed fracking techniques, this has led to increasing gas production in the US. Moreover, natural gas is also obtained in the process of oil extraction, which means gas production is linked to oil production.
This has interesting ramifications when looking at present supply. Despite low natural gas prices over the past few months, production in the US has remained high as a result of high oil production. Similarly, higher prices do not readily translate to higher production. This suggests that Natural Gas price-supply relationship is inelastic.
Demand
Demand for Natural Gas comes from:
• Energy Production – Natural Gas is used in power plants to generate electricity. Natural Gas electricity production has been rising over the last decade as it replaces Coal. Notably, manufacturers using natural gas as an energy source can switch to other energy sources during price spike, which provides some elasticity to demand.
• Commercial and Residential Heating – Natural Gas is used for heating homes in winter. This can lead to a seasonal demand during winter months in the Northern Hemisphere.
• Industrial Use – Natural Gas is used as a raw material for industrial products such as plastics, ammonia, and methanol.
Natural gas demand is heavily affected by weather. Unusually warm summers in the Northern Hemisphere drive higher energy usage from air conditioners while colder winters drive higher demand for heating.
Inventories
Gas can be injected into storage facilities and stored for later use. These inventory levels play a major role in balancing supply-demand. Summer months (April-October) are referred to as injection periods while winter months (November-March) are withdrawal periods. Inventory levels help even out the surge in winter demand.
However, natural gas is much harder to store than oil as it is less dense. This means the inventory effect is not as apparent which explains the larger seasonal variation in natural gas prices as compared to oil prices.
Seasonality in Natural Gas Prices
Seasonal price action of Natural Gas shows two distinct price rallies. A large rally during winter in the US and EU driven by surge in supply for heating in winters, during this period, prices peak in early-December before declining. The other, smaller spike is during summers in the US and EU when demand for electricity rises, during this period, prices peak in early-June before declining.
Further, prices show the highest deviation from the seasonal trend in late-September.
Over the past five years, the winter rally has become wider, with prices staying elevated from August to early-December.
Additionally, seasonal trend points to a price appreciation of +11% between September and December.
However, investors should note that past seasonal trends are not representative of current or future market performance.
Henry Hub Futures
Henry Hub is the most prominent gas trading hub in the world. It is located at the intersection of major on-shore and off-shore production regions and connected by an extensive pipeline network. This is also where US natural gas exports are dispatched.
CME’s benchmark Natural Gas futures (NG) deliver to Henry Hub and is the largest gas futures contract in the world. Other notable Natural Gas futures contracts are TTF (EU) and JKM (Asia). Futures from both regions are also available for trading on CME.
Asset Managers are Bullish
Commercial traders are heavily net short on Natural Gas futures, short positioning in July was at its highest level since 2021 but has since reduced. Overall, net short commercial positioning points to bullish sentiment.
Asset managers have switched positioning in Natural Gas futures from net short to net long since May. Last week net long positioning reached its highest level since May 2022.
Options markets OI points to a neutral market view on natural gas with Put/Call ratio close to 1. Options P/C has stayed close to 1 for the past 3 months.
At the same time, Implied Volatility on Natural Gas options has been rising in August. A rally last week failed to break past a key support level but vols remain elevated suggesting that price may retest that level again.
Henry Hub Gas Dynamics with European Gas
Last week, EU Natural Gas futures (TTF1!) spiked by almost 28% due to a strike at Australia’s second largest LNG plant, still the rally soon retraced almost entirely.
LNG supply disruption, especially at the key transition to the winter season can lead to volatility spikes. Though, EU gas inventories are 90% full, supply disruptions like this can still have a major effect on gas prices but especially on volatility.
Over the past few years, higher flexibility and capacity in the global LNG supply chain has led to the various global natural gas benchmarks tracking each other more closely. This means that Henry Hub natural gas futures are exposed not just to US and Canada Natural Gas production but also to disruptions in global supply.
However, the effect is comparatively limited due to ample supply in the US. This can be seen in the price action of Henry Hub natural gas futures which rose by 6% on the same day.
Recent Trend in Natural Gas Inventories
As per the EIA, Natural Gas supply fell 0.1% WoW last week. At the same time demand rose by 0.3% WoW. Note that working natural gas in underground storage has started to flatten over the past 4 weeks, rising by just 94 billion cubic feet (BCf) compared to the 5Y average increase of 140 BCf during the same period.
Still, inventory levels are close to the top of their 5-year maximum, elevated by high US gas production during the summer driven by higher oil production. EIA forecasts that the depletion season will end with inventories 7% higher than their 5-year average.
EIA expects production to remain flat for the remainder of the year, so watching weekly consumption reports could point to early indicators of seasonal inventory depletion. However, due to elevated inventory levels, the seasonal effect may not be as strong as prior years.
In a longer-term trend, gas rigs in the US have started to decline this year after surging over the past year. This will likely lead to lower production over the next year.
Trade Setup
With options markets pointing bullish and seasonal trends suggesting price appreciation during this period, a long position in Natural Gas futures expiring in October (NGV) allows investors to benefit from an increase in Natural Gas prices.
Each contract of CME Henry Hub Natural Gas Futures provide exposure to 10,000 MMBtu of Natural Gas while the October contract has maintenance margin of USD 5,070 for a long position. A USD 0.001 MMBtu change in quoted price per MMBtu leads to a PnL change of USD 10 in one Henry Hub Natural Gas Futures.
Entry: 2.484
Target: 3.099
Stop Loss: 2.172
Profit at Target: USD 6,150
Loss at Stop: USD 3,120
Reward/Risk: 2x
MARKET DATA
CME Real-time Market Data helps identify trading set-ups and express market views better. If you have futures in your trading portfolio, you can check out on CME Group data plans available that suit your trading needs www.tradingview.com
DISCLAIMER
This case study is for educational purposes only and does not constitute investment recommendations or advice. Nor are they used to promote any specific products, or services.
Trading or investment ideas cited here are for illustration only, as an integral part of a case study to demonstrate the fundamental concepts in risk management or trading under the market scenarios being discussed. Please read the FULL DISCLAIMER the link to which is provided in our profile description.

Natural Gas, Trading range first.NATGAS / 1D
Hello trdaers, welcome back to another market breakdown.
NATGAS has been trading in a down trend, the price has rejected the preious resistance level.
For a higher probability setup, the one should wait for a trend line break.
Checkout the chart for my trigger plan.
Trade safely,
Trader Leo

Macro Oil Blueprints: Energy Schematics forged in FibonacciThis chart consists of USOIL, Heating Oil, Gasoline, Natural Gas, Palm Oil, and Rubber futures.
Every one is tailored to a Fibonacci Layout. There are two sets of extensions. They interlap and work together. One must look for the support and resistance to verify its authenticity.

Dry Bulk Shipping ETF to Rise as Export/Import Prices IncreaseBDRY the Dry Bulk Shipping ETF, which is tied to the Freight Rate Futures Contracts of the Various Ship Sizes, is now looking to rise again as both the Import and Export prices continue to rise, especially within the Natural Gas and Fuel category.
We have Confirmed Bullish Divergence on the RSI, MACD, and PPO; all while the PPO has begun to give us a Bullish Confirmation at the HOP level of this Bullish Deep Gartley on the Weekly Timeframe. As a result, I will now be expecting to see the market price of this ETF go up at an extreme rate as the Shipping, Freights, and Carrying Costs begin to rise.
I will be looking at individual Dry Bulk Shipping and other International Goods Transportation stocks such as ADM, GASS, and DLNG

#NatGas Long-Term #OOTTThe long-term chart remains so far unchanged. It may take a couple of months to mature. By and large, I expect the price to break through $10/MMBtu and never look back. It may be a once-in-a-lifetime trading opportunity lasting over a decade or so.

#NatGas UpdateNatGas is nowhere close to expectations. Here it is purely my fault for not looking for alternatives hard enough. In hindsight, the situation was not that difficult to prepare for.
Initial wave (a) of the remaining 2023 uptrend seems complete (unless it is a diagonal). The price is likely to spend next month consolidating before rising in wave (c) of (y) of 5 of (1). Having missed that move in wave (a), it makes little sense to label lower time frames until wave (b) is fully formed or the price renders the analysis wrong.

Natural Gas Buy Natural Gas will break and touch 223.8, travelling channel and inside a big channel. so buyers are ready to pull above.

BOIL rises into reversal territory SHORTBOIL as a triple leveraged ETF of natural gas futures- has high volatility
which can translated to high profits for traders who can accurately harness
that energy .On the 2H chart in the time since the reverse split, the price has mostly
ranged up and down between the first upper and lower VWAP lines of the
VWAP anchored to the high in May. Occasionally it has ranged outside those bounds
and then reverts to the mean VWAP. Price is presently at or near the first upper
derivation line where it typically pivots down. The zero lag MACD is suggestive
of an impending pivot down before any signs of it and thus showing bearish divergence.
The mass index is not yet suggesting a reversal. The shorter HMA 56 rising significantly
above the HMA210 is suggestive of overextension into the overbought overvalued
zones of the chart.
Overall, I will put BOIL on watch.
Once a reversal is confirmed I will either short BOIL or long KOLD. Leveraged funds being
what they are and mathematics fixed and hard, shorting a levearged ETF is a faster fall
than its rise so the short position will be my first choice.
