Natural Gas bullish move!Big move down today!
But! i still believe we have a potential huge upside.
We could go a little lower to a support level around 2.5~
but we should go up over the coming week(s).
I expect a target price around 2.7~ and after that, another move upwards towards 3~.
lets see what happens!
Good luck!
Natural Gas

Energy markets top of mind – got gas?Energy markets are front of mind – we see crude into new cycle highs and riding the 5-day EMA – clients are progressively increasing short exposures, although we’re not at historically high skews.
Nat Gas (NG) – the wild west of energy markets – has broken the $1.91 to $2.82 range it has held all year, and the Bollinger Band volatility squeeze is firmly on. EU TTF NG prices were a clear driver, with price closing up 28%, and along with US CPI, will be front and centre in the session ahead.
Gasoline has moved to range highs of $3.00 and could get more attention from clients, if and when it closes above the highs.
The fundamentals behind the NG move have been firmly debated and whether the potential worker's strike at the Chevron and Woodside LNG facilities has genuine longevity – the three facilities in question account for c.10% of global LNG supply, so it is significant.
The risk to NG longs resides in a quick de-escalation of talks and we ultimately see no impact on supply. Married with signs of a mild winter in Asia and LNG not far off capacity limits, we could see a sharp decline in price on a resolution. Conversely, if we do see a full escalation and the market feels it could play out over a period of weeks, longs will be sitting pretty.
The trend-following crowd would be triggered on NG, with price closing above the Bollinger band and Donchian Channel (40-day look back). This still needs work, but the fact we’ve seen a breakout has raised the prospect of a test of the 200-day MA and full trending conditions.
Looking at the intraday tape in the US500 we see that as crude prices pushed above the April highs, we saw little selling of equity. We also saw the market's pricing of expected inflation (through ‘breakeven’ rates) also falling. This goes part of the way to answer two important questions – the level where higher energy prices accelerate the view that headline inflation may reverse higher again. And, whether higher oil prices become an outright negative for equities.
It appears that while we are closer to that tipping point, it feels like it may take a break of the psychological $100p/b to change the risk dynamic.
For now, longs in Nat Gas seem the right position, knowing the clear near-term risk/catalyst is headlines on strike action in W.A.

UNG Testing Complex Inverted H&S NecklineUnited States Natural Gas Fund(UNG) is testing the neckline of a complex inverted head and shoulders pattern with an open and close above the neckline on a gap up in price today.
Based on the orange line measurement taken from the lowest point of the head to the neckline we get $1.89 which can be applied to the opening price today above the neckline and gives an upper price target of $9.92 to watch for which is in the same area as the red horizonal resistance level stemming from the early march spike up to and rejection from $10.
Inverted complex H&S patterns have a 71% success rate which means we multiply $1.89 by .71 to give us an initial upper price target of $9.33. Assuming that we have a successful breakout of the neckline to confirm the inverted H&S pattern profit-taking should be begin at the $9.33 level and peak in the $9.92-$10 range for short-term traders. Personally, I tend to just raise my stop-loss level as price moves higher rather than selling at the upper targets in case price continues to move above the projected targets. This gives me wiggle room for price to fluctuate at resistance/target levels while also ensuring that the trade is profitable should price reverse and I get stopped out.
The lower PPO indicator shows the green line rising after crossing back above the purple signal line which indicates short-term bullish momentum. Both lines trending above the 0 level indicates intermediate to long-term bullish momentum.
The lower TDI indicator shows the green RSI line rising above the 60 level which indicates short-term bullish price trend. The green RSI line is also trending outside of the upper white Bollinger Band which indicates extreme bullish price trend; generally you want to remain long when the RSI is trading outside of the upper BBand. Price tends to correct to the downside when the RSI line falls back below the upper Band so keep an eye on that when it happens if you are are short-term trader. Overall, when the RSI is trending between the 40-80 levels as it has been sine mid-June the the intermediate to long-term price trend is considered bullish.
Overall, UNG is looking strong with bullish trend and momentum indicators as the price of Natural Gas moves higher along with crude oil.
My buy price was $6.93 putting me up about +15% on the trade so far. Stop-loss is still sitting at $6.54 which is where I set it the day I bought, likely will move it somewhere around $7.50 tomorrow to keep me in profit should price reject at the neckline. Should price continue seeing strength this week the stop-loss will be moved closer to $8, just below the neckline.
Info on complex head and shoulders bottom patterns: www.thepatternsite.com

NATGAS Breakout, Testing ResistanceNatGas is up +7% this morning as price has breached local resistance near $2.90 and testing long-term resistance near $3. Should price beat the $3 level the next move will likely be up toward the 200-day moving average which rests near $3.40.
The PPO is reading short-term bullish momentum with the green PPO line crossing up through the purple signal line after both lines held above the 0 level on a recent pullback. Both lines trending above the 0 level indicates intermediate to long-term bullish momentum.
The TDI indicator shows the green RSI line trending above the upper Bollinger Band and rising above the 60 level which both indicate short-term bullish trend. Generally, you want to remain long when the RSI line is outside of the upper band, and when the RSI is rising or trending above the 60 level. Overall action in the RSI has been trending between the 40-80 levels since May which is a sign of intermediate to long-term bullish price trend.
Overall view on NatGas price is bullish with more gains expected as we head into fall/winter when demand tends to increase.

Natural Gas LongNatural Gas forming a butterfly in 4 hours timeframe and price action confirms the long side view in NATURAL GAS. SL will Be below 2.3$.

Antero Attempting Rectangle BreakoutAntero Midstream is working on its 4th weekly close above the upper line of a rectangle pattern. Price is trading above all of its MAs with all MAs in bullish order indicating a bullish trend for price.
The PPO indicator shows the green PPO line rising above the purple signal line which indicates bullish momentum in the short-term. Both lines trending above the 0 level indicates bullish momentum on an intermediate to long-term basis.
The TDI indicator shows the green RSI line trending above the 60 level which indicates a short-term bullish price trend. Going forward we want to see the RSI remain above 60 to sustain this potential breakout above the upper line of the rectangle pattern.
Assuming that natural gas and oil have bottomed and continue to move higher AM should benefit from the rising trend.

NatGas: Take-off 🛫The price of NatGas has gained significantly again since Friday and could thereby move further away from the support at $2.48. Thus, we assume that it has already left the white wave (2) and is ready for high flights. For the white wave (3), it must rise significantly above the resistance at $2.75. After the completion of this wave, we expect a small correction and then another significant rise in the form of the white wave 5. Hence, we see a lot of movement on the upside at the moment. However, it should be noted that there is still an alternative scenario with a probability of 28%, which occurs if the price now falls contrary to our expectations. Then it would first have to fall below the support at $2.48.

NATGAS Analysis 30July2023This analysis is still with the old analysis. Still in a positive condition bullish. After the price forms a choch structure and corrected, the price is stuck in the Fibo Retracement area 0.382 and is likely to continue bullish up to the right level of Fibo 1,618 in contact with the highest price in March.

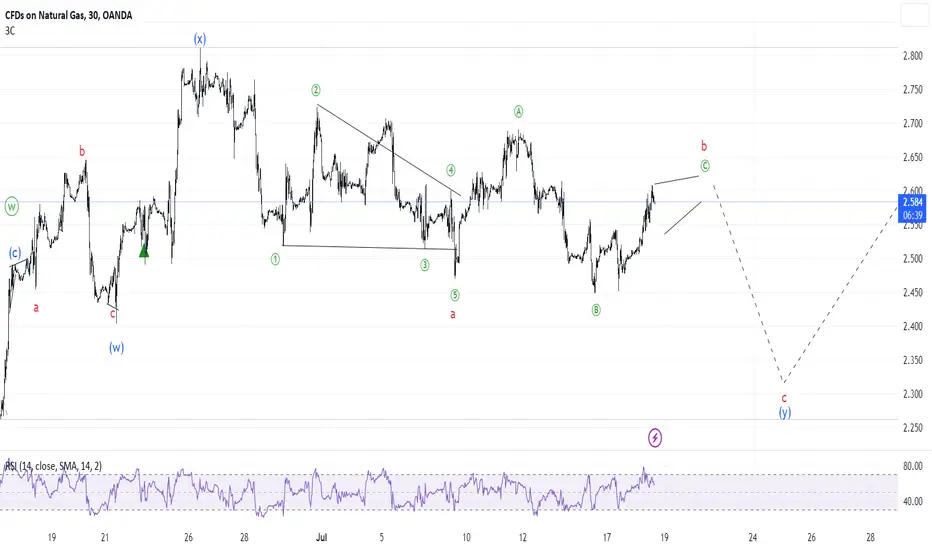
#NatGas Update #OOTTThe chart is non-tradable (though I did enter some cheeky shorts). Natgas is tracing out something really intricate, as is its typical behaviour.
I suspect (and this is only specualation at this point) that the market is undergoing a compex [ w] [ x] [ y] correction as wave b where [ x] is a flat with an expanding diagonal in wave (C).
Then there has to be either another flat or a triangle in wave [ Y] to complete wave b and proceed to a simple impulse c.
That is extremely speculative at this moment, and hence not tradable from an ElliottWave perspective.
The key points are
- I believe the correction within the correction has not yet been completed.
- Once wave b is completed, there may be a nice quick short setup followed by medium-term long opportunity
This is not advise.

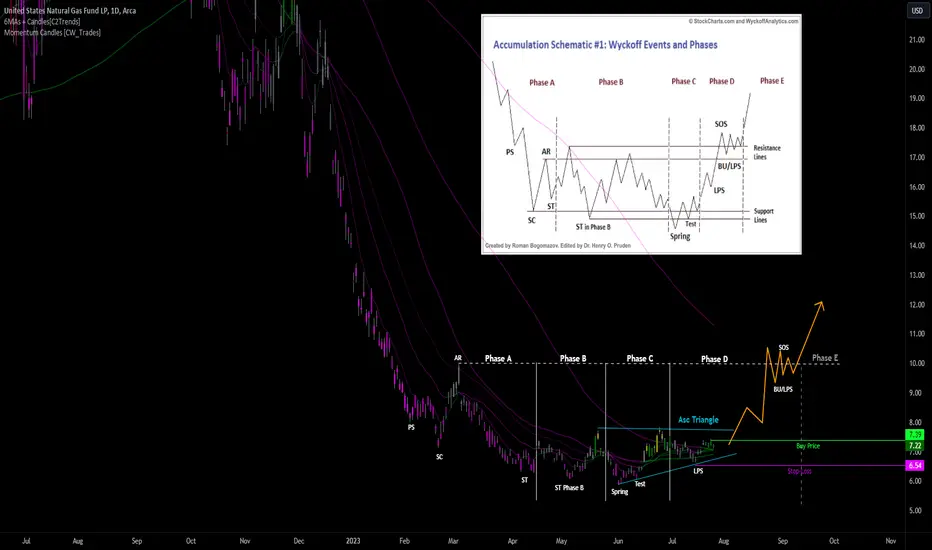
UNG Wyckoff Accumulation PatternUnited States Natural Gas Fund appears to be in the process of heading into the Back Up(BU) phase of a Wyckoff Accumulation pattern after levelling off in the $7 area after seeing a ~75% decline from the August '22 high near $35. There is also an ascending triangle pattern forming in phases C and D which tend to result in higher prices as UNG puts in a series of higher lows. What we want to see as a sign of strength going forward is for price to move above the upper blue line of the triangle pattern and follow the trajectory of the orange arrow which represents the anticipated path for price.
I've been in UNG since 7/20 with a buy price of $7.36. Current stop-loss order is at $6.61. No upper price target for now, just watching and waiting to see if price can break above the short-term resistance level at the upper triangle line near $7.85.
part 2 of 7 natural gas & mega cap tech and QQQ SPYnatural gas weekly uptrend still intact key battle zone now

Natural gas bull move!Possible upwards move in Natural Gas as of tomorrow - when we get news about the gas storage.
Possible catalysts:
How weather both in Europe and in USA.
Good luck!

BOIL (3X Natural Gas ) Overnight Trade RecapAs a triple leveraged ETF BOIL is highly volatility and typically has a good range
even if the overall price changes only a small amount from one day to the next.
While these overnight day trades are typically conducted on the 3 or 5 minute time
frame, here a 15- minute chart is shown. Because BOIL is tracking natural gas
futures and the futures markets are around the clock , BOIL often has movement
after-hours and in the pre-market while futures markets are active.
In this example, the chart is dressed with double Bollinger band setup with
deviations of 1.618 and 2 618 which are Fibonacci numbers. Relative volatility
and relative volumes are indicated as well to be better attentive to reversals
or trending amplitudes.
In this example at about 12N on yesterday 7/24, price dropped out of the bands
volume and volatility went red to green and the candlesticks formed a morning
star pattern. This is the entry. The stop loss is placed just below the lowest bottoming
wick in the pattern. Today, in the premarket, when the price rose to outside the upper
trade zone and green bars on the volatility and volume indicators fell quickly, the
trade was closed for a realized profit of 4.7%. About 90 minutes later, another
long trade was set up for a more than 4% five hour day trade.
Rinse and repeat DYODD !

NATURAL GAS Buy lower, sell the break-outLast time we looked into Natural Gas (NG) we called for a buy entry (see chart below) right after the contact at the bottom (Higher Lows trend-line) of the Bullish Megaphone:
The 2.550 target has been hit but the rise didn't stop there, breaking even above the former 2.690 Resistance and making a Higher High in the process. The price is right now above the 1D MA50 (blue trend-line) but in terms of Risk/ Reward neither a favorable buy or a sell. We are willing to buy at 2.400 with a tight stop just below the Megaphone's Higher Lows trend-line and target 2.800 (below Resistance 1). If a 1D candle closes below the bottom (Higher Lows trend-line) of the pattern, we will sell and target the 1.950 Support.
The 1D RSI is trading inside a Channel Up pattern. If broken, it will be a first confirmation of a bearish break-out signal.
-------------------------------------------------------------------------------
** Please LIKE 👍, FOLLOW ✅, SHARE 🙌 and COMMENT ✍ if you enjoy this idea! Also share your ideas and charts in the comments section below! **
-------------------------------------------------------------------------------
💸💸💸💸💸💸
👇 👇 👇 👇 👇 👇

Natural Gas AT BREAKOUTOn natural gas chart, we see a good consolidation at lower level
Now the price pattern show strength in Natural gas
If natural Gas break 2.9 or 3.0
than we can see a good reversal in Natural Gas Chart for atleast 3.5 or 04$ level.

#NatGas Update #OOTTMy take on Natural Gas developments. I continue to label an ABC flat correction in the making.

Natural Gas Forecast | Trend Analysisfalling wedge pattern bull breakWeekly uptrend still intact Next level for is to break above $2.80 range

#NatGas UpdateIf I elaborate on my earlier scenario with unfinished correction, Natgas might perform a spectacular drop over the next few days before resuming the uptrend.
Before this, I expected a triangle, then a flat with an ending diagonal and now a classic expanded flat in wave b. Since wave a was a contracting diagonal, there is an 80% chance that wave c is a quick impulse down and a 20% chance of expanding diagonal.

NATURAL GAS - Elliott WaveNatural gas seems to have completed a long correction. 5 sub-waves upwards can be seen. Above the low of 2.15, wave 3 can be expected with targets towards 4.8

Falling Wedge NatGas Gold Silver AnalysisGold and silver broke above falling wedge bullish
Natgas still chopping within it.

#NatGas Update #OOTTOk, the triangle did not materialise and we are in a different form of correction. I keep thinking the correction is not over.
#NatGas Update #NG #OOTTIt seems like the correction is not yet done as the triagnle is part of wave b not c.

Natural Gas HELD SUPPORT What's NEXT? | Price Level Trend Analys- Natural Gas Stock Weekly uptrend still intact
- Natural Gas Natgas bear break lacking follow through
- Structure of the chart is ok as long as bulls hold above $2.53
