Natural gas trying to stabilize & reverse after steep downtrendNatural gas has been in a strong downtrend for the past year but finally sellers look exhausted and prices have stabilized. New lows failed to stick in the beginning of May which has led to a reversal higher.
Sets up for a decent risk-reward trade to the upside, but stops and time-frame is important.
Natural Gas

#NaturalGas Can Rise Up Very Quickly #NATGASTraders, Natural gas has created several bullish breakouts over the past weeks but failed to push higher. Now as we are reaching the end of the wedge pattern, a breakout is imminent. This can create a W pattern which in turn can push the prices higher.
Please support this analysis by liking and sharing. 👍🙂
Rules:
1. Never trade too much
2. Never trade without a confirmation
3. Never rely on signals, do your own analysis and research too
✅ If you found this idea useful, hit the like button, subscribe and share it in other trading forums.
✅ Follow me for future ideas, trade setups, and updates on this analysis
✅ Don't hesitate to share your ideas, comments, opinions, and questions.
Take care and trade well
-Vik
____________________________________________________
📌 DISCLAIMER
The content of this analysis is subject to change at any time without notice and is provided for the sole purpose of education only.
Not financial advice or signal. Please make your own independent investment decisions.
____________________________________________________

Natural Gas Clear Support & Resistance Guide | Falling Wedge- AMEX:UNG AMEX:BOIL PEPPERSTONE:NATGAS Natural Gas clear falling Wedge
- Daily uptrend confirmed without much follow through at the moment
- bulls would like us to hold prior pivot lows and bonce off next week

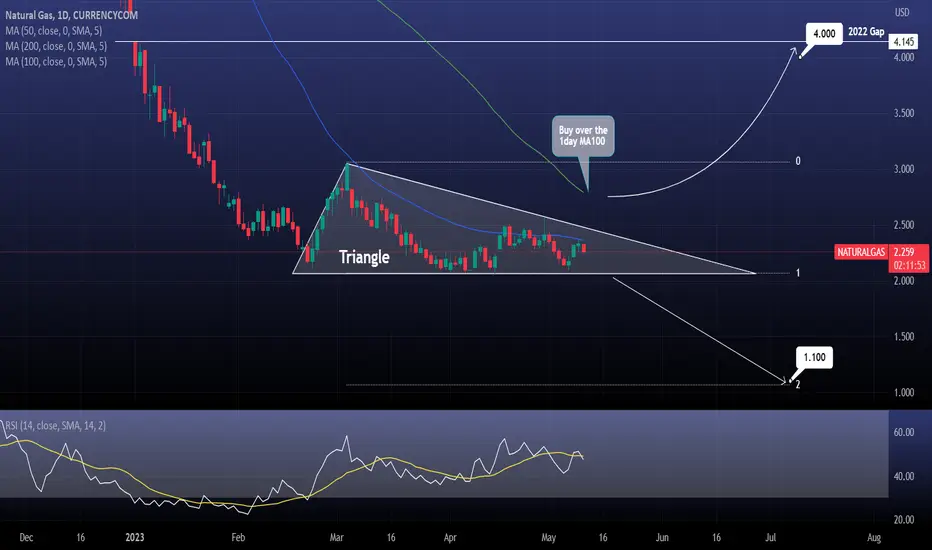
NATURAL GAS The Triangle's breakout will determine the trendNatural Gas is trading inside a Triangle, with the 1day MA50 as the Resistance.
The critical level is the 1day MA100. If the price breaks above it, target the gap from 2022 at 4.000.
If the price crosses under the Triangle's bottom, target Fibonacci 2.0 at 1.100.
Follow us, like the idea and leave a comment below!!
$SO 5 Month Play Energy companies are quite predictable, and $SO is one of the best Energy providers in the United States. Highest employee favourability and a top choice by many investors for consistent growth.
One of the best things about $SO is that it has consistent swings of 10-20% and you can catch these swings over 4-6 Month periods.
Buying here between $62-$64 and will double down on my position down to the support line at $55.
Target is $80-$82. Time based stop loss for end of July

NATGAS, Accumulation mode is definitely ON before x4 by DecemberNATGAS weekly data is conveying massive accumulation at the current price range of 2.0 to 2.2.
Target by Winter/December will be a 6.0-8.0 price range.
TAYOR.

Natural Gas: Has it Found a Bottom?Natural gas made a stunning rally to an all-time high, only to come crashing back down again. It's been a while since we last covered natural gas, so let's take a look at what's happened since then.
The previous technical & seasonality setup played out perfectly with the RSI bouncing off the low and the rally into the winter season, hitting our profit target and extending further.
This time, we're seeing a similar setup on a different timescale. Zooming out, natural gas has retraced the entire move it made in the past three years and is now back to pre-COVID levels. The question is, has natural gas found a bottom here?
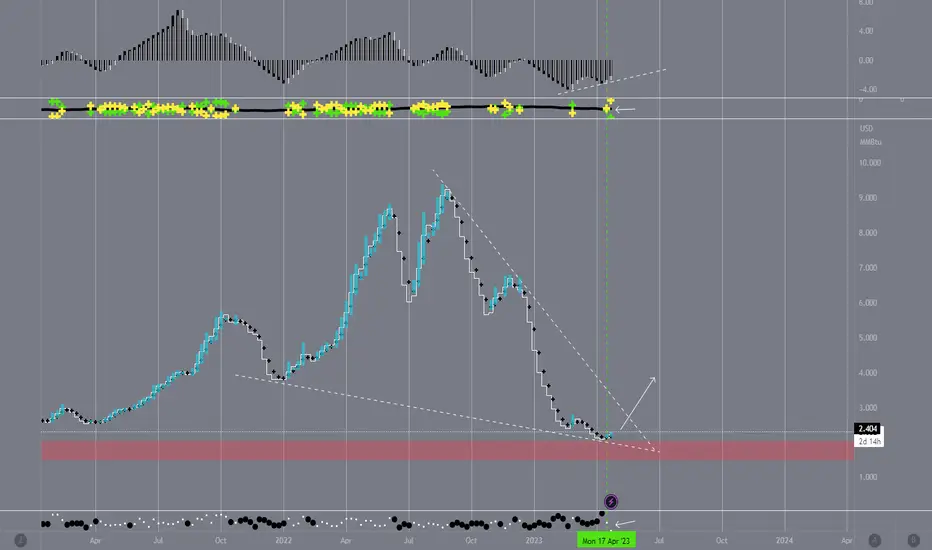
Looking at the weekly chart for natural gas over the past 20 years, we see an interesting picture. The weekly RSI has only broken past the 30 level five times over this two-decade period, and each time marked the rough bottom for natural gas. Fortunately, we're seeing this exact setup now, with prices seeming to find resistance at the $2 handle, which has also proven to be a reliable resistance level.
Comparing the Henry Hub natural gas against the Dutch TTF natural gas, we can see the spread back to the lows when adjusting for the same unit measurement of MMBtu and in USD.
On the fundamental side, this excerpt from the US Energy Information Administration (EIA) sums up the outlook for Natural Gas vs Coal:
“Natural gas-fired generation capacity in the United States has grown in recent years, although coal-fired generation has continued to decline. Lower coal-fired generation is due to a long-term trend of coal power plant retirements and increased competition with natural gas-fired combined-cycle plants when natural gas prices are low. A total of 11.5 gigawatts (GW) of U.S. coal-fired electricity generating capacity retired in 2022. No new coal-fired capacity has come online since 2013, and developers have not reported any plans to build new U.S. coal-fired capacity in the future. In contrast, nearly 6.1 GW of natural gas-fired capacity was added in 2022, according to our Preliminary Monthly Electric Generator Inventory.”
Natural Gas saw a record high for the winter heating season.
Additionally, close to 23% of US coal plants have plans to retire by 2029, and the last new coal plant that came online in the US was in 2013, 10 years ago.
With coal plants being the second-largest source of electricity in the US and supply being cut, energy has to come from somewhere else. While the push for renewable energy continues, natural gas remains the main source of energy production. The dissipation of supply from retiring coal plants will likely be filled by natural gas. The reason being? Natural Gas currently remains most reliable form of energy source, while nuclear faces political pushbacks and Wind, Hydro & Solar have unpredictable/intermittent generation capacity.
Lastly, the Dollar sits on a key level now. If broken, the weakening dollar could drive commodities prices higher en masse.
All in all, the case to long natural gas from here seems reasonable, with the fundamental outlook for Natural gas still positive and the technical set-up pointing to a low. Taking a long position at the current levels of 2.186 and setting our stops at 1.85 and our first take profit level at 3.1 gives us a reasonable halfway point while setting our next take profit level at 3.8 gives us a higher profit potential if prices continue to rise. CME’s Henry Hub Natural gas is quoted in U.S. dollars and cents per MMBtu. Each 0.001 increment equal to 10$.
The charts above were generated using CME’s Real-Time data available on TradingView. Inspirante Trading Solutions is subscribed to both TradingView Premium and CME Real-time Market Data which allows us to identify trading set-ups in real-time and express our market opinions. If you have futures in your trading portfolio, you can check out on CME Group data plans available that suit your trading needs www.tradingview.com
Disclaimer:
The contents in this Idea are intended for information purpose only and do not constitute investment recommendation or advice. Nor are they used to promote any specific products or services. They serve as an integral part of a case study to demonstrate fundamental concepts in risk management under given market scenarios. A full version of the disclaimer is available in our profile description.
Reference:
www.cmegroup.com
www.eia.gov
www.eia.gov
blogs.worldbank.org

Natgas: More pressure! 💪You know this one?
Pascal: “Hurry up! Get a move on! We really need to get going!”
- “Whoa, that’s a lot of pressure for just one Pascal…!”
Okay okay, bad jokes aside, Natgas does need a bit more pressure to rise from the compound consisting of the white zone between $1.880 and $3.436, the blue zone between $2.407 and $3.277 and the pink zone between $2.573 and $3.439. Above this conglomerate, it should finish wave iv in pink before turning downwards to develop wave 2 in green, which should then lead below the bottom of the white zone. Once this prominent low is established, Natgas should take off again. However, there is a 40% chance that Natgas could leave the white zone on the southern side, thus expanding wave alt.2 in green earlier already.

Natural Gas Support and Resistance Guide | Price Outlook- AMEX:UNG AMEX:BOIL VANTAGE:NG Still trading within my falling wedge pattern is getting tight so likely breaking soon
- Bounced off of quadrupole support Friday
- couple of resistance level right above us may test the upper falling wedge resistance next week

✅NATGAS GROWTH AHEAD|LONG🚀
✅NATGAS has retested a key support level of 2.00$
And as the pair is already making a bullish rebound
A move up to retest the supply level above at 2.28$ is likely
LONG🚀
✅Like and subscribe to never miss a new idea!✅


NATURAL GAS: Hit the 2 month Support. Buying is favored.Natural Gas hit the S1 Zone today (2.100 - 2.060), which started forming on February 22nd. This support has held another 8 times and with the 1D time frame neutral technically (RSI = 45.392, MACD = -0.046, ADX = 18.986), we are making a buy call targeting the 0.382 (TP = 2.440). In addition, the 1D RSI is bouncing off the HL trendline.
In the event however that the 1D candle closes under 2.060, we will revert to selling and target the -0.236 Fibonacci level (TP = 1.830).
## If you like our free content follow our profile to get more daily ideas. ##
## Comments and likes are greatly appreciated. ##

Long on NATGAS throughout the month of AprilSeasonally, April is on average a bullish month for Natural Gas and looks to have set up for a similar outcome this year.
It has made a huge double bottom on the daily with a extreme bullish RSI divergence and you can see a similar positive RSI set up on the hourly and the 4 hour chart as presented in my post.
My target is modest 3 which would is the most recent resistance tested on the 3rd of March and a increase of 46%.
Good luck!

Natural GAS : LONGNatural gas bounced from a low of $1.95/MMBTU, where almost all producers lose money.
Since natural gas and crude oil are near or below breakeven levels, producers are reducing their drilling rate - likely lowering production levels given the lack of capacity.
The negative shift in weather, falling rig count, and potential export boost from Freeport may push natural gas back into a shortage over the coming months.
While natural gas spot prices appear likely bottoming, UNG's immense "contango" pressure remains a key investment rig factor.
Source : Seeking Alpha

Natural Gas Weekly Price Outlook | Support & Resistance Guide |- Natural Gas falling wedge is my support and resistance guide
- Currently Daily & 4h Neutral trend
- 2 key support below and 2 key resistances above.

AEIS: Bullish Bat PCZ Just Below The Bullish Channel Supply LineWe have a Bullish Bat in midair keeping this stock up as it gets rejected from the Supply line of a Bullish Consolidation Channel but I think that this Bat will hold and that it will go for a true breakout of the channel in the coming weeks as this sector seems like it would be a very safe sector to be in.

BULL FLAG! (4HR / 8HR)Natural Gas forming a BULL FLAG with a nice bounce off new support. Near term bullish.

NATGAS, keeps the flame burning. Upside continues.NATGAS weekly data is suggesting firm price foundation at current levels and an upside continuation is inevitable.
SPOTTED at 2.4 (continuation from 2.0 levels)
_______________
Related news:
Nat-Gas Prices Rebound on Outlook for Cold U.S. Temps
www.tradingview.com
BOIL: Boiling up and down 🥘Still a bit tentatively but visibly, ProShares Bloomberg Natural Gas (aka BOIL) is starting to boil up, quite in accordance with our expectations. As the first part of a three-part counter movement, the ETF should climb further upwards to finish wave a in magenta, before wave b in magenta should return it to its current level. From there, BOIL should rise into the yellow zone between $7.11 and $19.05 to complete wave c in magenta as well as wave (4) in yellow, whose high should then initiate the overarching downwards trend’s final step: wave (II) in white.

XNGUSD showing StrengthBased on Daily timeframe, XNGUSD almost last 52 trading days defending it's low level. Now we see some strength from lower level.
can we see XNGUSD at 5.5$ in coming trading days?

Natural Gas Detail Trading Plan |Long term| Support & Resistance- AMEX:NG AMEX:UNG AMEX:BOIL : if i were to add today, I laid out a detailed game plan in the video of how to trade it with SL and target.
- 4 hour currently in neutral trend
- potentially shaping up daily higher low and trend change to uptrend need to break above prior high
- still trading within the equilibrium range likely breaking in early May

Natgas 4h flip a coin. Market is Always right. Hopefully WE will have some move today. We may see another selling impulse and another bottom or break lower for the coming hours or days. As Always natgas Can make us +12% -12% in a single day even for no Real reasons sometimes ..so i will advise cautious, observe and stay tune or open position with tigh SL.

$UNG ready for correction? for the next few weeks I believe we will have at least a bounce from this area
volume is increasing in the last month
we are below the 2020 lows and all this price action can be a false breakout from that area(only a guess)
remember: I am treating it as a long term trade
