It is not yet the right time to buy Natural gasIt is not yet the right time to buy Natural gas.
U.S. natural gas futures prices hit a three-week high on Monday, climbing nearly 8% after forecasts of colder temperatures and higher heating demand in the next two weeks.
The predicted decrease in temperature has led to an increase in the value of futures.
Prices have risen as the amount of gas being exported abroad as liquefied natural gas from the United States is heading for a new monthly high.
Export levels remained elevated for the second consecutive month in April.
Forecasters are foreseeing lower-than-usual temperatures in most of the 48 continental US states between April 17 and 25.
Refinitiv estimates that this trend pushes gas demand across the United States, including exports, to 94.8 bcf/d in the coming week, up from 94.1 bcf/d this week.
Good news comes from natural gas demands, however, it has not been a problem in the year 2023.
Natural gas experiences a higher demand during the summer (July and August) for electricity generation, while in the winter (December to February/March) there is a sharp increase in demand for heating homes and buildings in the North East and Midwest.
Natural gas has multiple uses, including industrial use, for home heating and to produce electricity.
A major alternative source to NG-generated electricity is coal, but with still high prices - $3.5 per MBTU versus $2.5 for NG - there are strong economic and capacity pressures for utilities to scale up the production of energy using natural gas.
With many coal-fired plants expected to be phased out over the next year, these pressures are set to increase.
I am confident about the demand for natural gas, but pessimistic about production.
Production remains high and adverse weather can cause problems as we have witnessed this winter season.
The price of gas has fallen due to warmer temperatures, which have led to a significant increase in stocks.
Looking at the technical picture, the short-term trend appears to be bullish supported by good volumes.
However, the movement was not caused by purchases, but by short-coverings.
When prices drop significantly, speculators will buy back to close out gaining positions, thus creating a temporary bounce.
My pricing model points to natural gas prices rising to HKEX:5 over the next few quarters.
So I will monitor inventory weekly to consider purchasing the gas.
I expect drought and extreme temperatures to come this summer, so my plan is supported by that scenario.
The opportunity is tempting and I can't afford to pass it up.
Author's note:
The contents and information presented on this site should not be considered as a solicitation to invest in the financial markets.
Natural Gas

XNG | NATURAL GAS | DECRYPTERS Hi people Welcome to Team decrypters
We are looking to short NAT GAS AS a RETRACEENT SELL TRADE

NG, 1st spark up... flame will ascend to new highs soon..NG correction is slowly concluding -- with bears showing some weakness on weekly data, after touching the order block support at 1.9 level.
A reversal is on queue now.
Expect some signficant moves on the upside soon -- a revisit to 7.0 before year ends is possible.
SEEDED L at 2.09
TAYOR.

Natural Gas Future Outlook Weekly /Daily S&R Technical Analysis - AMEX:NG Finally got a 4 hour uptrend need more follow through tomorrow to confirm
- likely heading to $2.5 if 4 hour uptrend confirm follow through tomorrow
- tradeable ticker AMEX:UNG and AMEX:BOIL still use the NG chart if you are trading natural gas.

Apr 18,22-NG-FINALLY going up :-)So it looks like I was more or less correct - 2 was a decent bottom and good entry point.
Don't know how many of you got in, but I'm in at 2 going long so I'm in decent profits currently.
I'll keep you updated as usual. As you can see I am trading on the weekly/daily so I'm not sure what my target is yet, but I am partial to 500 point profits so I might get out if NG hits 2.5
Take care and stay safe.
Heiko

NATURALGAS: Will Keep Growing! The Next Goal is: 2.800
The price of NATURALGAS will most likely increase soon enough, due to the demand beginning to exceed supply which we can see by looking at the chart of the pair.
❤️ Please, support our work with like & comment! ❤️

Natural Gas - Going upIf we get a deviation here, potential rally to target at range highs $2.9 / $3.0.

NATURALGAS Long Natural gas is packed in a tight falling wedge pattern. It is at historic support too, going back to August of 2019. Another point worth mentioning is that the price of natural gas defended this support on February 22nd of this year and produced a >40% rally, peaking on March 3rd. Virtually every timescale from the minutes to the weekly show positive divergences and oversold readings. The targets for this trade are the gaps above, marked in purple. Use UNG or BOIL (x2) for this trade.

Buy Natural Gas .Technical analysis education- divergencesSlightly wide stop in case of further divergence but good low risk high reward trade on daily charts unless buy signal changes. This support area looks really good now for daily holds and profit taking on the way up.

Natural Gas May Have Bottom Out @ 2.054 With Double BottomAfter experiencing a price rejection at the 2.054 level and a double bottom formation, the natural gas market appears to be bottoming out, signalling an end to its 2-year low.
The bullish sentiment of natural gas is expected to gain momentum in coming weeks!
#NaturalGas
#NGAS
N.B!
- XAUUSD price might not follow drawn lines . Actual price movement may likely differ from the forecast.
- Let emotions and sentiments work for you
- ALWAYS Use Proper Risk Management In Your Trades

Natural gas is on the verge of a move The Natgas bottom looks very close. It looks to be forming a broadening bottom. A marginal new high, a small pullback , then take off.

NATURAL GAS - Why I am Bullish - FULL SETUPWait for the small trend (blue line) to be broken upwards with confirmation of retest and rejection and from there you can enter LONG.
We have interesting news from SAPPORO, which announced today that they will reduce GAS production, but, a big BUT, they mentioned that they will temporarily stop investments in this sector.
On the one hand, this can scare small investors and the price can make a DUMP up to the 1.8 area and from there the accumulation and capitulation necessary to go up, or it can break this trend even on Monday and see the beginning of a BULLMARKET for gas.
Personally, I think we will see an increase.
But I have a BUY order at 1.80 ready so as not to miss the opportunity.

Natural Gas Weekly Bear Flag potential but still holding Support- AMEX:NG AMEX:UNG AMEX:BOIL needs that 4 hours trend change otherwise even the big moves will essentially just fade
- still a potential weekly bear flag
- but still holding bottom wedge support and also double bottom on daily.

Crude Oil and Natural Gas - Bearish ReversalsCrude Oil (WTI) & Natural Gas have been in an uptrend.
Reversal Patterns are present, and BIG bearish moves are around the corner.
Technical Analysis:
- WTI: Ascending Channel Breach
- Natural Gas: Ending Diagonal

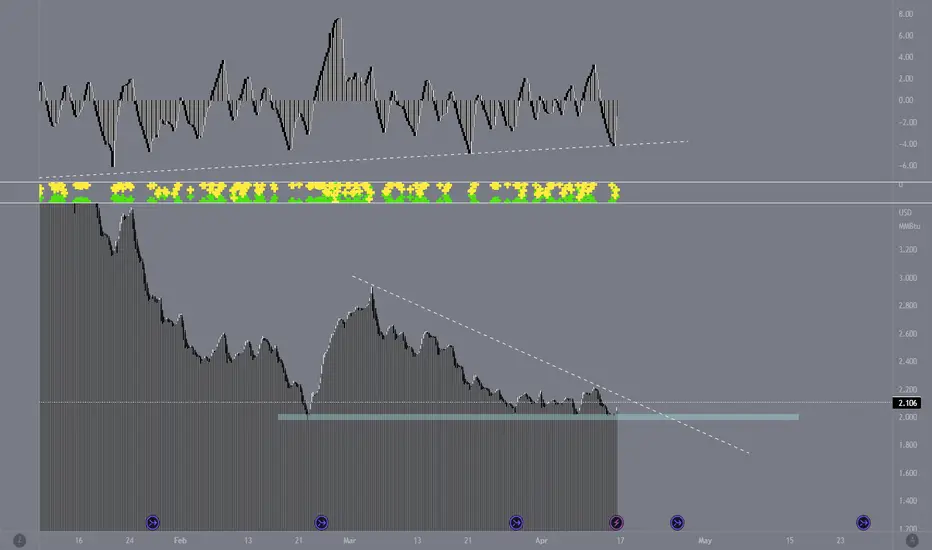
NG, on active accumulation phase..NG, is undergoing significant accumulation at the current levels. It revisited strong order block / support at 1.9 level and it touched this multiple times. It retested it and bounce back-- only to return to it multiple times. Let's see if it can finally muster strength to reverse from this level.
Spotted at 2.10
TAYOR.
Natural gas - bottom callers will be dead before risingMajority of traders are loading up on their AMEX:BOIL longs and natural gas futures long positions.
This is why SSL will be grabbed first between $1.5 to $1.7 before price can increase.


natgas - target 1,8Similar pattern.
Short view for the end of this week. I am waiting for 1,8 to buy natgas again.

Natural Gas Long Term Outlook | Importance of 4H Trend change | - AMEX:NG AMEX:UNG AMEX:BOIL cant stress enough we need to change trends, even if it is a very big move it will just fade if no trends are changed
- need to change the 4h and daily trend to the bulls
- likely tightening up in a equilibrium into May, still holding the teal support line.

Natural Gas Sell 2,302Trying selling from the 2,30 mark and short all the way too 2,1, should be some nice profits

LONG NATURAL GAS - TAKE PROFIT 2,310LONG TRADE ON NATURAL GAS / 15min Time Frame
The trade will be aviabale just now...

Natural Gas Is Looking For Lower SupportNatural gas is trading bearish for the last couple of months, but we see it in a larger (A)-(B)-(C) corrective decline that can be slowly coming to an end. We are actually tracking final wave 5 of (C), which should be completed by a five-wave cycle of the lower degree.
Natural gas is currently in an intraday consolidation within downtrend, ideally in subwave "iv" triangle pattern that can take it lower for wave "v" of 5 of (C) towards 1.6 - 1.5 area before it finds the bottom.

NATURAL GAS: 11th April 2023: Gas on FIRE !!NG..
Can be a rocket above the B level marked as per ABCD pattern.
Good Risk Reward from here.
Fighters lets bring out the swords and be ready for this fire rally {with strict SL as marked at point B :)}
Cheers!
Knight Kumar
