SELL US TREASURY BOND FEATURES Good morning traders, today I'm sharing with you my trade on TREASURY BONDS, you can see that it crossed the parallel channel with a quite high volume.
TP and SL set them at your own risk
In case you got any question don't hesitate to ask.
Natural Gas

$NG $UNG $BOIL Where Price would be for the Next couple weeks- UNG NG BOIL have retraced over 50% fib of the A to B move from the bottom, that's a clear sign that we will likely get an equilibrium base on how significant these swings are.
- NG has a tendency to break a resistance and have no follow through vice versa breaking a support and have no follow through so im looking for a equilibrium tightening up price action the next couple weeks.
- Short term bears still in full control

Mar 9,22-NG-Pullback is here-TurnaroundAs I said in my last post, price dropped this week. Question is, with the jobs report tomorrow, will price plummet? Or Rebound?
THis is the question I am battling with. I will be watching closely and if price continues to fall overnight and into the moments leading up to the report, I might put in a Buy ORder in case price sky rockets.
We shall see. As for next week, will price go back up to 3ish? Or will price just go sideways for a while. Hard to say, especially because there appears to be no end in sight for the War.
Stay tuned.
Heiko

bullish cyper on dbl bottom by AD + stoch rsi $21 tagetthere is a bullish cypher showing two targets $21 and $42 area. notice that the stoch rsi and and AD both have double bottom on the weekly chart. this is very bullish

Pullback to 2.582 before another bull runNG likely to pullback to this support area highlighted at 2.582 before pushing off to another bull run. This area was previously the area of consolidation as well. This pullback seems to be short term corrective.

NATGAS Long- Used SFP & Breaker Order Block, with confluence SFP at the Monday low on 12H, 4H, and 1H
- MSB to the upside on the 30m buying retest of Breaker Order Block
- TP1 will be Monday's high, will reassess there but there's a possibility of filling the gap at ~2.93 and could hit 1D FVG at ~3.05

BOIL: Piercing Line Bullish Reversal Visible on Weekly at 1.618BOIL; The 3x Bullish proxy for Natural Gas is showing Bullish Divergence at a 1.618 Fibonacci Extension after confirming a Piercing Line on the Weekly Timeframe at said level.
If it plays out i think BOIL could come back up to fill some gaps, meet the moving averages, and see anywhere from a 200%-700% rise.
I do however think USOIL will see a decline and that the two will move in opposing directions for awhile as that is something that they they tend to do.
As a side note we also have a Daily Bullish 3 White Soldiers on Natural Gas itself as well as a Bullish Shark that can be seen here:

BOIL hit the boiling point FridayInvesting, investing,
Let's put our money to work!
Buying stocks and bonds and funds,
For our future we will perk!
BOIL, and natural gas in general spent what seems like forever capitulating. There was just too much supply but I expected demand will increase which would drive up the price of natural gas. Supply and demand are the main drivers of commodity prices as they determine the amount of a commodity available and the level of desire for it. When supply is low or demand is high, prices tend to rise, while excess supply or low demand can lead to price drops.
When news broke this morning, the price dropped 20% and we landed -20%+ at EOD Monday. If you look at the daily wave master (not pictured), you will see that there is significant chance that this little trooper will drop more. What is more important is that the move looked like it finished after a 60%+ move from the lows backon Frbruary 21st. Now, we wait. Lets see if BOIL and Natural Gas make new lows or if we'll find some support. Need patience on this one.

Recap of my trade for todayGood afternoon and good evening traders, for today on CRUDE OIL it went sideways and on the other 2 markets we traded and it's okay since this is how trading works, today's not our day so we stopped at the morning after losing 1.5K and we'll recover it in the following days.
I don't only share my wins, losses also must be shared so beginners know that trading isn't always winning sometimes it goes against you and also advances traders also have bad days in trading. Learn from your losses and never quit !
See you tomorrow in another signal.
In case you got any quesion don't hesitate to ask!
natural gas long positionHi All,
Am still convinced that Natural Gas still in A,B,C correction of wave 4 of big C, and we still have 5 waves to go, I tried to explain every thing on the chart, please let me know of you have any comment.
good luck for all.
Nidal Khalid.

Mar 5,23-NG-is this the pullback?Last week NG went up a hell of a lot...are we ready for a pullback now? We shall see how this week plays out. Should be crazy with the Fed raising rates again on Wed.
If this week closes below 2.6, maybe NG will fall back to 2 next week.
If price action falls anywhere close to 2 THIS week, I will put in a buy order for price to return to the 3 zone.
Heiko

Natural Gas $NG $UNG $BOIL Tips for Riding your Profit- 4H 12EMALast weeks NG video i mentioned that this is likely a climax bottom and we are heading higher with potential inverse H&S pattern, it ended up playing out in the hourly time frame and bulls were a lot stronger than i expected.
- Looking at the 4h time frame 12 EMA as full bull control support if we don't lose it then we wont be getting 4h and daily consolidation yet.
- im still holding my $BOIL position (it 2x leverage of UNG) its a small position so i'm letting it ride at least 20~30% of course ill still be watching how we consolidate on 4h and daily time frame will tell me a lot if the bull move will continue.

NATURAL GAS BULLISH RSI DIVERGENCE IN DAILY TF !!!Hello to everyone,
As we can see there is a Bullish divergence in RSI & PRICE on daily timeframe . This is indicating that price has not much momentum to go downside. We can expect a trend reversal in natural gas but only RSI divergence does not confirms the trend reversal. We need positive price pattern or any bullish candle formation to go upside at the bottom of chart. If any bullish candle or bullish scenario forms than only we can go for the long position.
The green candle indicating price momentum towards upside and green candle has good volume also ,which is showing strength in buyers./b]
Traders, if you liked this idea or if you have your own opinion about it, write in the comments. I will be glad.

Recap of my trade for todayGood afternoon and good evening traders !
Today we had a great 2 trades on CRUDE OIL, 1st one is the one I published 5h ago when I said to sell, you can see on the chart I drew 2 support lines the price pulled back on, you might wonder how I got those 2 lines it's due to a specific tool I can't share with you.
Well after reaching the lower line we closed and kept waiting for what will happen, then it turned out that the price decided to go long and we got in at the 2nd arrow and closed at the green candle next to the arrow on the right after having the squeeze configuration.
I didn't share the 2nd trade since I have clients I work with privately and it won't be fair to pay for something and I give it for free
For more questions don't hesitate to ask I'll be answering with pleasure

TIME TO BUY AL RAJHI BANK !Dear investors, this is time to buy AL RAJHI BANK stocks. As you can see on the chart the price kept consolidating in a specefic channel the past eight months, I have been waiting for this exact moment to announce you this for the past three months, here we are today. After the consolidation and the small range of volumes, this week we got a high volumed springbox at the end of the down trend, plus it pulled near the 209 EMA. What are you still waiting for ? BUY AL RAJHI BANK stocks !
In case you have any question don't hesitate to ask I'll answer with pleasure

TIME TO BUY ARAMCO !Dear investors, As you can see on the weekly chart, the price last week pulled back on an interesting support it tride to break multiple times and it ended by going up as you can see on the part I drew a box on, after breaking the 1st suport it came back to re test on the main interesting support to continue its way up.
In case you got any question don't hesitate to ask and I'll be answering with pleasure !

NG1! in oversold zone. Technical bounce target 2.789 , 3.37, 4.0Natural Gas has dropped more than 43% since start of 2023, it's heavily oversold and hitting a major support zone (2.45 - 2.20 levels) , highlighted in blue box. In my previous post, I had a target of 2.33 as per Fib measured levels. I strongly believe we have seen bottom in NG short term, might go lower some more to test the support zone and build a base.
Short term I'm expecting NG to technically bounce to target 2.789, 3.37 levels (white lines).. Best case might test the $4 levels, where the down sloping pink line meets.
For any reason, if 2.20 support levels get broke, we might see lower target $1.795 and 1.44.. I believe we might see these downside targets only after a technical bounce 2.789, 3.37 levels.
Let me know your thoughts in comments section

Natural Gas: Epic Short Squeeze about to happen? Nat Gas got another daily positive close. This chart is looking ultra bullish and we may get to witness one of the greatest short squeezes.

Did You Get In On Time?Week started off great, movement to the upside as predicted. Moving toward the 200 day moving average is another positive note here.

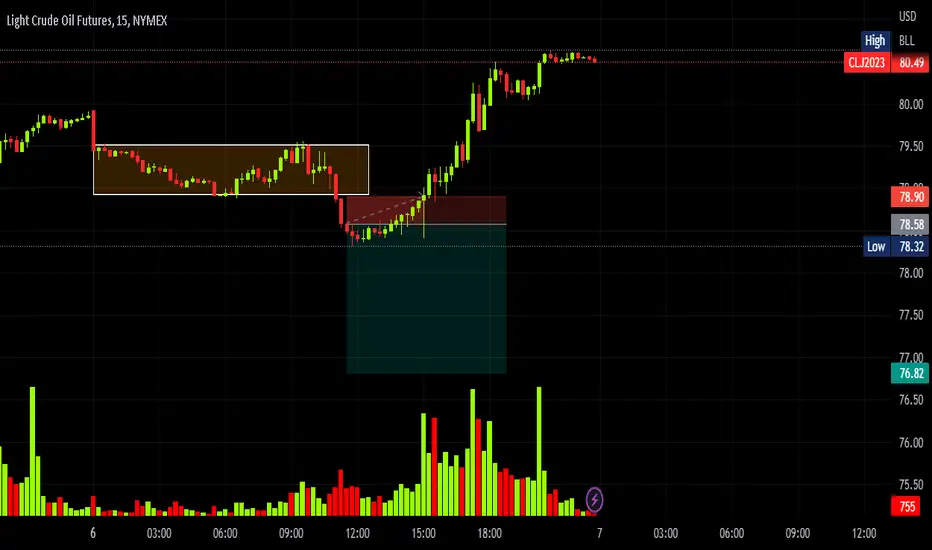
SELL CL1!A bonus trade for you for today, on the chart you can see that the price was consolidating then cut through the channel and now it kept going down. Get in and set SL and TP at your own risk
I'm sorry I can't publish the only after giving my private clients signals after the market moves. Still you can make some profits.

Pivotal day as NG challenges 4 month downtrendNatural Gas is challenging 2.80 level which offers an area of resistance from 4 month downtrend started on Nov 23rd 2022.

Recap of my trade for todayGood afternon and good evening for european traders, for my trade today on ZB we closed in loss and it's one of normal things in trading and which a lot of people don't show and share, we didn't trade any other market for some reasons.
I'm sharing this just to let beginner traders that trading isn't always winning, somedays you make losses you recover in other days.
Today we got in after pulling wack on the resistance line and added a contract on the place I placed the 2nd arrow, The big green candle came out after the news release turned up the market to continue bullish and closed after few hours.
See you tomorrow in another forecast !
If you got any question don't hesitate to ask.

Feb 28,22 - Closing Order with 400pt ProfitNice little profit maker there...I'm not sure whats going to happen on Thursday with the storage report, hence I'm taking my profit and running.
Also, this is the 5th day in a row of gains for NG so I'm going to wait for a pullback and get back in. I'm assuming price will drop some as people take profits from this last little bull run.
I'll post by Friday again.
Heiko
