SELL ZB1!Good morning traders, today I didn't publish at the morning since there wasn't a clear shot to take, Isaw on the ZB a point to get in and I got in earlier and didn't share it since I can't publish it at the same moment I give it to my clients, you still can get it and touch some profits.
SL and TP set them at your own risk
Natural Gas

Natural Gas gaining momentumThe rally continues, what's next for Natural Gas?
Massive long term reversal signals on watch.

Recap of my trade for todaygood evening and good afternoon american traders, at the morning I posted to sell natural gas and after few candles it turned out to be bullish, I took that whole up trend and I didn't post it since people I give signals to privately didn't like it to be shared, I kept it for us and we touched some good profits for today on NATURALGAS and CRUDE OIL, for the one I posted abou ZB we closed with some minor losses.
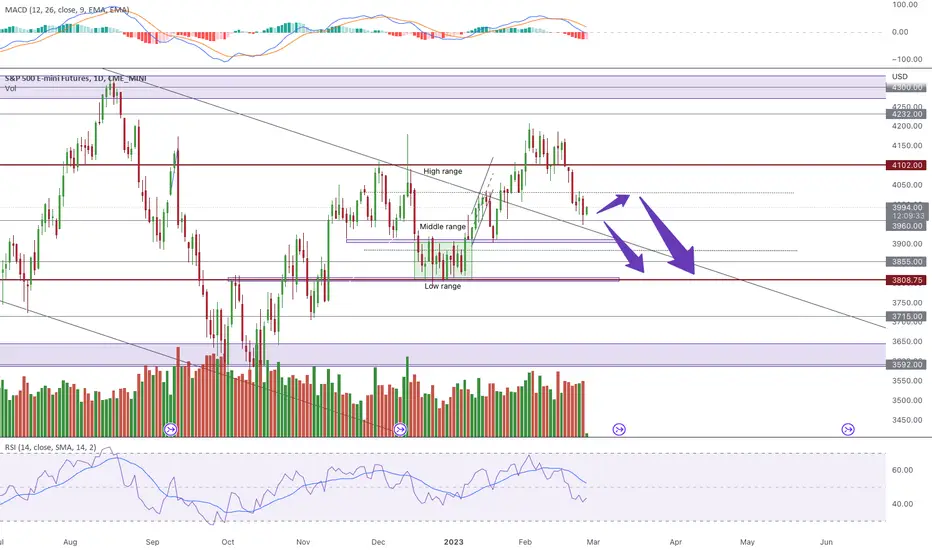
Well, on the chart you can notice I drawn some supps and resists, those came from a tool I can't share with the public since it's one of the most important things I follow on my strategy. The 1st arrow on the left signifies the point we got in as sellers after pulling back on the resistance line and getting the confirmation with the red candle, the 2nd one was the point we reversed our position to catch the up trend after having the squeeze configuration and the pullback on the support line. The 3rd arrow signifies the moment we added the 2nd contract and the last one is where we closed after having the squeeze again and the pulling back on the resistance line.
You can notice that I don't use TP since you get small profits while you can make big ones.
In case you got any question don't hestate to ask and I'll be answering with pleasure

Breakout idea on NG!The long awaited breakout may be here. Everyone and there mom has been chomping at the bit for months for this opportunity... Is that a sign that we should not get excited or ape into a long? Its up to you to decide.
I personally have been accumulating $Tell (NG stock) for 2 weeks now and just recently added more on Tuesday.
What do you think NG will do next and what are your trading plans?

Feb 27,22-NG-Was 2 the bottom?Not sure if 2 was the bottom or not, but there was a support/resistance line around 2.3 so I put a Buy Order in on Fri at 2.350 to see if I can catch 500 points.
So far so good but I might cash out shortly. We shall see.
Question is....WAS 2 the bottom? Or will price just reverse this week and head back down to 2? Regardless, keep an eye on your trades - anything can happen and the recession is still coming(even though it's already here but most people don't want to admit it - AND - their realization hasn't shown yet in the markets).
Trade safe, stay safe.
Heiko

NatGas Cup and Handle in the making?On my first public analysis, I suggested that NatGas would reach its 2.66 resistance before any profit taking that could bring it back to its 2.42 support zone. Now that the first target is reached, and considering the strenght/speed at which it got there, I am leaning to the idea that we'll have a cup and handle and not another reverse H&S forming. Therefore, 2.54 is the new support I check. The 2.66 resistance could even be turned as a resistance without a pullback. If it hold, then 3.01 becomes possible short term. Remember that NatGas is usually bullish from March to May. Considering recent behavior of the price, and despite our overall warm winter, we are now getting ready for summer months.

NATURALGAS: 3 White Soldiers at Bullish Shark PCZAt the start of the year Natural Gas had a potential Bullish Shark setup at the minimum .886 PCZ and it ultimately failed to pivot from there but now we are significantly lower at the 1.13/1.618 Confluence zone of this Shark and are showing Bullish Divergence on the MACD as well as a 3 White Soldiers pattern on the daily. The bullish Target for Natural Gas remains to be $4.5 but it could go as high as $9.00. As for stops i'd put it below the second candle of the 3 White Soldiers Pattern which should be below the PCZ.

SELL NATURALGASGood morning traders, today were riding short on NATURALGAS since it touched the resistance line on the top, for me and the persons I work with privately we got in the candle I put an arrow on after getting the confirmation of the pullback, now after crossing the vwap which plays a strong support/resistance in the system I follow we added another contract and said why not to share it with you so you too can make some profits
I don't use TP and SL, set them at your own risk
In case you got any questions don't hesitate to ask.

Fundamental and Technical Analysis | FebuaryTable of Content:
1. Eurozone Inflation Data
2. US Economics Growth
3. NVDA
4. Commodities
5. Technical Analysis
1. Eurozone Inflation Data
The Eurozone's inflation for the month of January has exceeded the previously estimated figures, as reported by MarketWatch on February 23. It has been emphasized by policymakers that the economy is undergoing a disinflation process, and a soft landing has been achieved. However, the recent surge in inflation within the European Union implies a substantial escalation in interest rates.
2. US Economic Growth
The US economy experienced a less robust economic expansion than previously estimated in the fourth quarter, as evidenced by a downward revision in consumer spending. This adjustment has resulted in weaker economic growth (Bloomberg).
The total amount of outstanding credit card debt in the United States has reached $986 billion, with an average interest rate of 20%. This marks the highest level of credit card debt since the 1980s and translates into an interest payment of $200 billion per year. These figures do not include other forms of debt such as mortgages, student loans, and car loans, which are likely to exacerbate the situation. At the same time, the US government is paying over $200 billion in interest payments
The Personal Consumption Expenditures Price Index has risen from 5.3% to 5.4%, however, this data alone is insufficient to support the notion of disinflation. The Gross Domestic Product (GDP) has been revised downwards from 2.9% to 2.7% (a decrease of 0.2%) from the preceding quarter. According to Bloomberg, the US economy experienced a weaker expansion than originally projected.
Revised fourth-quarter inflation figures have been adjusted upward.
Additionally, JP Morgan's Jamie Dimon stated that "The Federal Reserve has lost a little bit of control of inflation". He has been warning about the economy for a while and I believe that he knows something is cracking as we speak.
3. NVDA
The stock price of $NVDA experienced double-digit growth. The stock price has risen by 100% since the beginning of the year. Revenues and profits have both decreased by 21% and 52% respectively on a year-over-year basis, and every segment of the business has exhibited a decline over the same period. The CEO placed significant emphasis on the importance of Artificial Intelligence, yet he sold stocks worth over $100 million prior to the market's significant downturn and may presently be engaged in additional sales.
4. Commodities
The statement suggests an anticipated appreciation in the value of the US dollar, which is reflected in the downward movements of gold, silver, platinum, copper, and various grains such as corn, rice, and soybean. Conversely, energy commodities are experiencing an upward trend, with natural gas exhibiting a significant increase.
5. Technical Analysis
The 21-day weighted ratio of equity-only put-to-call options is suggestive of a preponderance of puts in the market and indicates a significant degree of buying pressure. This metric has demonstrated a high degree of efficacy in identifying market highs and lows by suggesting a move in the opposite direction to the put/call ratio. Notably, during the present bear market, the ratio has achieved a 100% success rate. Furthermore, the current volume of call options is the highest on record, and retail investors are contributing $1.1 billion daily to the market.
-Momentum indicators: RSI and MACD moving downwards and volume remain below average (bearish)
As previously stated, " I will take the opportunity of a rise in equity markets to short BTC at higher levels". I have now filled all my short position on BTC in a confident manner. Below is my BTC outlook
Conclusion:
The recent market rally, spurred by technical indicators, high-quantity puts, and government emphasis on disinflation, has led to a surge in retail investment. As a result, prices for some assets have skyrocketed, and the quantity of long positions in the market has reached alarming levels. This suggests an overabundance of buying and a lack of liquidity that could cause the market to dip and potentially result in retail closures, as inflation has proven to be more persistent than anticipated by governments. I remain committed to my long-term investment plan, I am acknowledging the growing fissures in some economies that could lead to a catastrophic downturn. It is essential to remain vigilant and prepare for potential market turbulence in the future.
As previously mentioned, my portfolio consists of short-term bonds, USD, SPX shorts, BTC Shorts, small quantity gold, and just acquired Natural gas contracts.
For personal records but feel free to discuss or argue.
Natural Gas: The New Luxury ItemMy analysis for the Natural Gas chart on an all-time scale leads me to believe that we will never see NGAS at such low prices, ever again in our lifetime. The comfort provided by this natural resource is in a paradigm shifting phase and soon to become a luxury.

Natural Gas prints an RSI bullish divergence As you can see in the chart, natural gas had a big downside movement for the last months. Now It looks like the bottom is printed so I will consider entering a long here with targets 3.11$ and 4.69$ .
You can see apart from the Bullish Divergence that It is starting to show a lot of strength, you can observe a gap-up between 2.314$ and 2.415$.
For the buy setup I will enter now and set an stop loss order under the gap. If the position goes well, I will keep locking profits manually trailing the stop under key areas.
Don't forget to share your thoughts on the comments and happy emotionless trading.

NATURAL GAS: Finding the Bottom?Folks,
Natural Gas is trying to make a bottom. A confirmation is possible only if it starts to trade above the levels I have marked.
I would prefer to work around my trade using the range defined.
Any major upside or downside is beyond this range.
All the best!
- Knight Kumar

Natural Gas long setup There is a possibility of a bullish wave
I cannot be certain that it will be an impulse wave that ends at levels of 13 USD, but it is certain that it will be fast until levels from 6.5 to 8 USD.
my long setup in the chart
good luck !

💨 $NATGAS UPDATE⤑ NATGAS found strong support around the key support zone as detailed in my previous post (see related idea)
⤑ The strong weekly performance points to a change of behaviour by market participants.
⤑ The change of behaviour does NOT automatically mean that there is a TREND CHANGE. This is only the first step required for a TREND CHANGE to occur.
⤑ At this time, it is the first sign that the "status quo" bear market condition has "stopped" for an unknown period of time. It may be only act as a temporary PAUSE prior to a resumption of the bear market.
⤑ In the immediate term (next couple of weeks), I would expect prices to reverse higher as there is strong upward momentum. Afterwhich the price may drop once more to re-test the support zone. The price action resulting from the re-test (if any) will guide us further to where prices may move in the longer term.
MrStocky

$UNG bounce here back to the neckline (updated levels)Alright, was a little too early previously. Updated the levels. Going to go long at $8.30ish level.
Upside to ~$17

Natural Gas - Ready for a bounceNatural Gas at support after a brutal multi month decline.
Not calling the bottom as it is not at extreme support, but price looks poised for a decent up move from here.

Natural Gas - RSI Low to Price LowThis chart shows the number of weeks between a low on the RSI for #natgas and the low in price. 2019/2020 period is omitted due to the unusual effects of pandemic and lockdowns on markets.
RSI Bottom to Price Bottom
2001 - 13 weeks
2009 - 26 weeks
2012 - 12 weeks
2016 - 13 weeks
Average = 16 weeks
Bottomed In Month
2001 - September
2009 - September
2012 - April
2016 - March

Conclusion of my trade on NATURALGASGood afternoon traders, at the morning I shared with you a trade on NATURALGAS, thanks to god the guys I give signals to privately and I could make a good profit on NASDAQ and NATURALGAS for today. As you can see on the chart we bought lower as possible after getting a signal to buy with the little candle I put an arrow on on the left. The other arrows signify candles we added positions at to finish the day with 4 contracts in total which was good for us. The reason why we close is 1st we reached twice our target, 2nd is the price pulled on the resistance line twice and that's a signal to close.
I'm being this clear in my tutorials so it can be easy for people who are still learning to trade to understand.
In case you got questions don't hesitate to ask and I'll be answering with pleasure

Natural Gas- Killing the BullsFrom our previous post, linked in description, we counted Natgas to be in wave iii of C, keeping extending to the downside as long as retailers bottom fishing in mass. We believe that Natgas will provide a beautiful long opportunity, but only once retailers will be shaken out. Price bounced from our support, but created lower highs in a triangle.
We are sort from @2.628 stop loss @2.7 risk 0.5%. Targeting a lower low in the 2.2-2.3 area.
Best
GMR


BUY NATURALGASGood morning traders, I managed to start again sharing with you one of the trades I make every day since I trade multiple markets. The one I'm sharing with you today is on NATURALGAS.
As you can see on the chart the system I follow gave me the entry point with the little candle I put the arrow at, to make things fair I gave the entry to the guys I work with first and after 15 min I share it with you. I'd you have any questions don't hesitate to ask.
TP and SL set them at your own risk


NATURAL GAS - NatGas - LongPull back is aspected .. first target until to first static resistence .. second target until dinamic resistence
