Natural Gas at supportNat Gas, the widow maker - is at the 100 month ma (green line), which was a resistance level during it's consolidation and should be a support here. How much of a bounce it can get is hard to say but my guess is at least to 6 dollars sometime this year. This is a monthly chart.
Natural Gas

Natural gas long setupHi traders.
Look my previous idea about natural gas. We were disciplined and did not try to cath a falling knife.
But now we believ the time is right for a trade. Cycles short term and long term point out a low this week
for a good entry.
We have a stoploss at 7.30 and target of 29-30 range. Trading symbol BOIL.
Hopefully our patience last few weeks will be rewarded.
I dont trade often, since i am only waiting and being patience, so the entrys are medium to long term.
And once we are inn we wait again for the profitt target to get hit. Being a good trader is having alot of patience,
and never chasing price, never trade if your emotions are out of whack, we need zen state.

BUY NATURAL GASGood morning, This morning I'm sharing with you another trade my team and I got in.
All I can say about the reason why I have bought is as you can see on the chart a pullback on the VWAP followed bu a high volumed candle which gave us confirmation to buy.
TP and SL set them on your own.

Natural Gas anticipating Wave 4Hello,
I think NATGAS completed wave(3) when it reached $2.41, if that support line hold, I expect a correction until $4.50 or even $5.00, however its too early to decide from which price wave 5 will start.
I believe the chart explain every thing. let me know if you have any comment.
good luck.
Nidal Khalid

Massive signal from the market today! Daily AnalysisWe discuss all the major indices and fundamentals heading into the important Jobs number tomorrow.
The market is in a vulnerable point especially if the economic data comes in better than expected.
Massive earnings tomorrow could add to the volatility.
2 important market signals today from 2 leading stocks.

Nat Gas Accumulation TimeWe're coming in to a zone near the $3 mark where we belive it would be prudent to start accumulating long positions in natural gas. Using Elliott Wave anaylsis in conjuction with fundamental analysis we're pretty certain there's a huge upside to natural gas. We're unsure as to whether this will be a wave 3 or a wave C to the upside, but ultimately that doesn't matter as both will provide us with an upside target of at least $10+. Fundamentally there will be a bigger surge in natural gas demand as it has become evident that the world is not ready for renewable energy to support our power needs (if it ever will be able to support us entirely) so 'cleaner' fuels such as natural gas will be used in the immediate and near term to meet the global energy demands. As always with trading we don't need to know everything, we just need to be on the right side of the movements to make money and we're pretty certain this is going to be a huge move to the upside in the coming weeks and months.

EQT | Great Entry Point | LONGEQT Corporation operates as a natural gas production company in the United States. As of December 31, 2021, it had 25.0 trillion cubic feet of proved natural gas, natural gas liquids, and crude oil reserves across approximately 2.0 million gross acres, including 1.7 million gross acres in the Marcellus play. The company was founded in 1878 and is headquartered in Pittsburgh, Pennsylvania.


Natural gas cylces- New support soon? Cycles & sentiment- work in tandem
Natural gas now moving into mid-term cycle support

Daily Analysis: Powell Moving MarketsDiscussing,
Stocks, Powell, Gold, Bitcoin, SPY, Yields, DXY, QQQ
There may be an arbitrage opportunity in the stocks market.
Stocks & bonds diverging yet again.

Feb 6,22-NG-Going down still or SidewayI zoomed out to the Weekly chart so you can see just how brutal the price has dropped over the last 8 weeks.
Question is, will it continue? Or is this going to be a bottom?
Answer is to wait this week out to see if price levels out or not. Obviously if price ends the week below 2.3 then we are still going down.
I'm looking for a decent close around 2.5 or 2.6. Then I will monitor price next week to see if there is a chance to break up to 3.
Remember we are heading into warmer weather soon and we have had a pretty warm winter overall so supplies are pretty full. Price may not do much for the next few months.
We shall see what happens. Stay safe.
Heiko

Natural Gas looks interestingTake a look at this Nat Gas chart. It looks poised for a rotation of capital to come out of the SPY and buy it at these depressed levels.

Natural Gas: The Widow MakerNatural Gas is on pace for it greatest & fastest fall in price history.
Nat Gas is hitting technical support in one of the most oversold conditions ever.
We discuss some Nat Gas cycle history that may be useful in knowing how to trade Nat Gas.

Chevon $CVX could come back strongly & surprise short traders 🚨This is energy play at a low risk area. The sector has been beaten down severely for weeks and I am expecting a turnaround soon for CVX to make another ALT that could surprise many experienced traders who are shorting the energy industries now.

Natural Gas Outlook Short And Mid TermVery weird things are happening in the natural gas space. It might be getting ready for the biggest short squeeze.

BOIL | It's Finally Time! | LONGThe fund seeks to meet its investment objective by investing normally in Natural Gas futures contracts. It may also invest in swaps if the market for a specific futures contract experiences emergencies (e.g., natural disaster, terrorist attack, or an act of God) or disruptions (e.g., a trading halt or a flash crash) or in situations where the Sponsor deems it impractical or inadvisable to buy or sell futures contracts (such as during periods of market volatility or illiquidity).

NG Natural Gas NG is extremely manipulated and oversold. All eyes on NG upside and seems like the turning point will be around $1.89

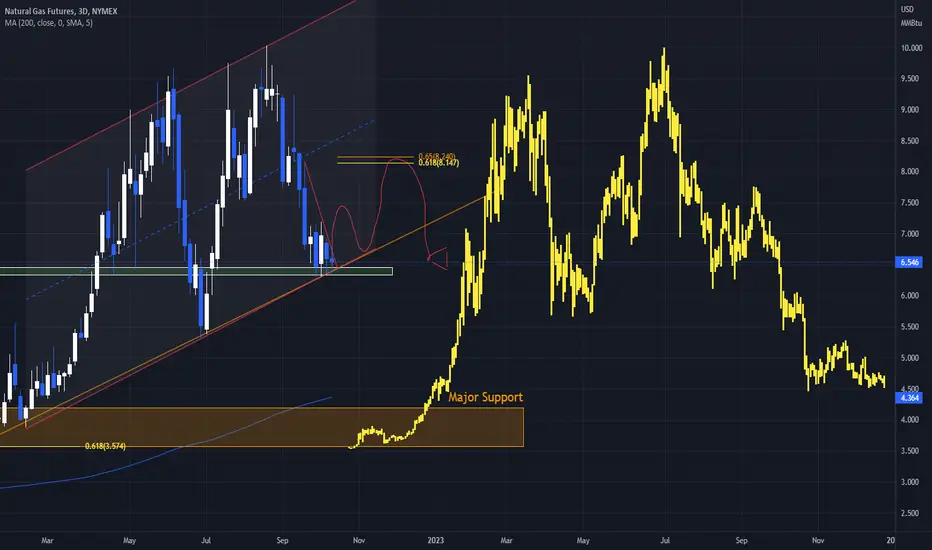
Natural Gas Short term target 4.35, long term target 2.33 Natural Gas recently hit the critical support at 3.4 and I see strong technical bounce to 4.3 level, hitting down sloping resistance line (red) which also coincides with Fib .618 level. Overall long term sentiment is still bearish, if the NG doesn't break above the 4.5 in upward momentum, we might see it crash towards 2.33 before mid of 2023.
Let me thoughts and comments on this post.

Nat Gas looking oddly similar to BTC chart before a deep declineI am not saying this will happen, in fact I am personally bullish at the moment based on a number of factors. (For more on why I am bullish check out my channel for my nat gas trade)
I thought it was worth mentioning that BTC price action over the past few years is lining up very similarly to the price action of nat gas over the past year. Based on this vague information I am still bullish, but as I explain in my other post I will be bearish as we approach a particular zone. That is when I will pull this chart back up and compare the direction between the two prices.
Just something interesting to watch over the next few months!
$UNG United States Natural Gas ETFMajor selloff in natural gas in the last couple of months.
January almost looked like a caputilation month based on the volume traded
Curretly on support, and maybe time to put some toes in the water
Trade small, stick to a stop loss
Expect volatility

NATURAL GAS-Pt.2- Short term bounce?In our previous post we explained how we believe that NaturalGas is ongoing an ABC correction from 9.995's top. Actually we believe to be finishing wave iii of C of this zig zag, as showed in the chart.
As explained in the previous post, we were waiting for the small red zone in chart between 2.4 and 2.5, where the algo tp of the whole move down and the level for which wave iii of C = 1.618 wave i of C, together with the target of the big head and shoulder pattern stand.
Since today we wicked that zone, we opened a long position at @2.471, and we are currently holding it with stop loss on entry.
Since the retail sentiment is still very extreme towards the long side and since this wave iii can still extend down, we are carefully posing our stop loss on entry. Target is 4.32. We will update below. Happy trading!

NATURAL GAS-Pt.1- Correction about to complete?Hello traders,
here is our view about natural gas.
As we can see from the monthly time frame, natgas completed an impulse after breaking a big descending triangle.
After reaching a top of 9.995, natgas created a head and shoulders pattern that coincided with a 535 structure to the downside, as showed in the main chart.
Then, wave 3 of C seems to be completed with an ending diagonal.
If the bullish macro count is in now we should go for another impulse up. Alternatively, we may get a (C) wave to complete
the monthly retracement higher than 10. In the latter case to move to 9.995 would only be a (A) cycle correction of the descent from 2005 high of 16.477.
In both cases, we expect a big buying opportunity coming soon in natural gas.
We are not taking long positions now for wave iv of C since sentiment in retail brokers is over 90% long.
When ALL the retailers are buying, who is selling to them? Who is gonna buy to actually put upward pressure on price?
This is why extreme sentiment is a contrary indicator.
We will update as soon as we see a long setup.

ERY - Signaling weakness in Energy?ERY is on the verge of breaking out of a falling wedge from the lows of the chart. Very likely to see a breakout here.
If it fails we will see the lower wedge act as next major support level.
