NATGAS Resistance Cluster Above! Sell!
Hello,Traders!
NATGAS made a bearish
Breakout of the support
Cluster of the rising and
Horizontal support levels
Which is now a resistance
Cluster round 3.717$ then
Went down and made a local
Pullback on Thursday and
Friday but we are bearish
Biased mid-term so we
Will be expecting a further
Bearish move down this week
Sell!
Comment and subscribe to help us grow!
Check out other forecasts below too!
Disclosure: I am part of Trade Nation's Influencer program and receive a monthly fee for using their TradingView charts in my analysis.
Natural Gas

Natural Gas | Oil | Dollar | Silver | Gold Price ForecastNatural Gas | Oil | Dollar | Silver | Gold Price Forecast
NYMEX:CL1! COMEX:SI1!

"XNG/USD Natural Gas" Energy Market Heist Plan (Scalping/Day)🌟Hi! Hola! Ola! Bonjour! Hallo! Marhaba!🌟
Dear Money Makers & Robbers, 🤑 💰💸✈️
Based on 🔥Thief Trading style technical and fundamental analysis🔥, here is our master plan to heist the "XNG/USD Natural Gas" Energy Market. Please adhere to the strategy I've outlined in the chart, which emphasizes long entry. Our aim is to escape near the high-risk ATR Zone. Risky level, overbought market, consolidation, trend reversal, trap at the level where traders and bearish robbers are stronger. 🏆💸"Take profit and treat yourself, traders. You deserve it!💪🏆🎉
Entry 📈 : "The vault is wide open! Swipe the Bearish loot at any price - the heist is on!
however I advise to Place sell limit orders within a 15 or 30 minute timeframe most nearest or swing, low or high level for Pullback Entries.
Stop Loss 🛑:
📌Thief SL placed at the nearest/swing High or Low level Using the 2h timeframe (3.800) Day/Scalping trade basis.
📌SL is based on your risk of the trade, lot size and how many multiple orders you have to take.
🏴☠️Target 🎯: 3.200
🧲Scalpers, take note 👀 : only scalp on the Long side. If you have a lot of money, you can go straight away; if not, you can join swing traders and carry out the robbery plan. Use trailing SL to safeguard your money 💰.
⛽💨"XNG/USD Natural Gas" Energy Market Heist Plan (Scalping/Day) is currently experiencing a bullishness,., driven by several key factors. 👇👇👇
📰🗞️Get & Read the Fundamental, Macro Economics, COT Report, Inventory and Storage Analysis, Seasonal Factors, Sentimental Outlook, Intermarket Analysis, Future trend targets & Overall Outlook Score... go ahead to check 👉👉👉🔗🔗
⚠️Trading Alert : News Releases and Position Management 📰 🗞️ 🚫🚏
As a reminder, news releases can have a significant impact on market prices and volatility. To minimize potential losses and protect your running positions,
we recommend the following:
Avoid taking new trades during news releases
Use trailing stop-loss orders to protect your running positions and lock in profits
💖Supporting our robbery plan 💥Hit the Boost Button💥 will enable us to effortlessly make and steal money 💰💵. Boost the strength of our robbery team. Every day in this market make money with ease by using the Thief Trading Style.🏆💪🤝❤️🎉🚀
I'll see you soon with another heist plan, so stay tuned 🤑🐱👤🤗🤩

NATGAS - Long Opportunity with a H&S TF 15 minThere is a H&S configuration.
We have to break the neck line.. if is will happen, we can have a new long wave until area 4.2

NATGAS Bearish Breakout! Sell!
Hello,Traders!
NATGAS made a bearish
Breakout of the key horizontal
Resistance of 3.626$ and the
Breakout is confirmed so we
Are bearish biased and we will
Be expecting a further
Bearish move down
Sell!
Comment and subscribe to help us grow!
Check out other forecasts below too!
Disclosure: I am part of Trade Nation's Influencer program and receive a monthly fee for using their TradingView charts in my analysis.

NATGAS is Bearish amid Oversold SignalsFenzoFx—NATGAS is in a downtrend, broke below the $3.66 support. The primary trend is bearish, but a consolidation phase is expected.
In this scenario, Natural Gas may test the 50.0% Fibonacci retracement level at $3.866 before the downtrend resumes. Watch this level for bearish signals, like candlestick patterns.
>>> Trade NATGAS without swap at FenzoFx Decentralized Broker

Gold | Oil | Dollar | Silver | Natural Gas Price ForecastGold | Oil | Dollar | Silver | Natural Gas Price Forecast

NATGAS Free Signal! Buy!
Hello,Traders!
NATGAS went down again
But will soon hit a horizontal
Support level around 3.784$
So after the retest we can go
Long on Gas with the Take
Profit of 3.907$ and the
Stop Loss of 3.725$
Buy!
Comment and subscribe to help us grow!
Check out other forecasts below too!
Disclosure: I am part of Trade Nation's Influencer program and receive a monthly fee for using their TradingView charts in my analysis.

Gold | Oil | Dollar | Silver | Natural Gas Price ForecastMultiple Time Frame Analysis
Support and Resistance Key Levels Analysis
Gold | Oil | Dollar | Silver | Natural Gas Price Forecast

NATGAS Growth Ahead! Buy!
Hello,Traders!
NATGAS made a retest
Of the horizontal support
Level of 3.720$ and we are
Seeing a nice strong bullish
Rebound so we are bullish
Biased and we will be
Expecting a further bullish
Move up
Buy!
Comment and subscribe to help us grow!
Check out other forecasts below too!
Disclosure: I am part of Trade Nation's Influencer program and receive a monthly fee for using their TradingView charts in my analysis.

Comstock Resources (CRK) – Expanding U.S. Natural Gas DominanceCompany Overview:
Comstock Resources NYSE:CRK is accelerating natural gas production, reinforcing its position in the Western Haynesville play, a key U.S. gas region.
Key Catalysts:
Production Expansion & Strategic Acquisitions ⛽
Increasing drilling rigs from 5 to 7 for higher output.
Acquired 64,000 net acres in Haynesville, boosting reserves & market share.
Investment in Drilling & Midstream Infrastructure 🏗️
$1.0-$1.1 billion planned for 46 horizontal wells in 2025.
$130-$150 million allocated to midstream development, optimizing gas transport & profitability.
Market Strength & Growth Outlook 📈
Positioned to capitalize on rising U.S. natural gas demand & global LNG expansion.
Investment Outlook:
Bullish Case: We are bullish on CRK above $15.50-$16.00, supported by production growth & infrastructure investment.
Upside Potential: Our price target is $30.00-$31.00, driven by expansion, operational efficiency, and market strength.
🔥 CRK – Fueling the Future of U.S. Natural Gas. #CRK #NaturalGas #EnergyStocks

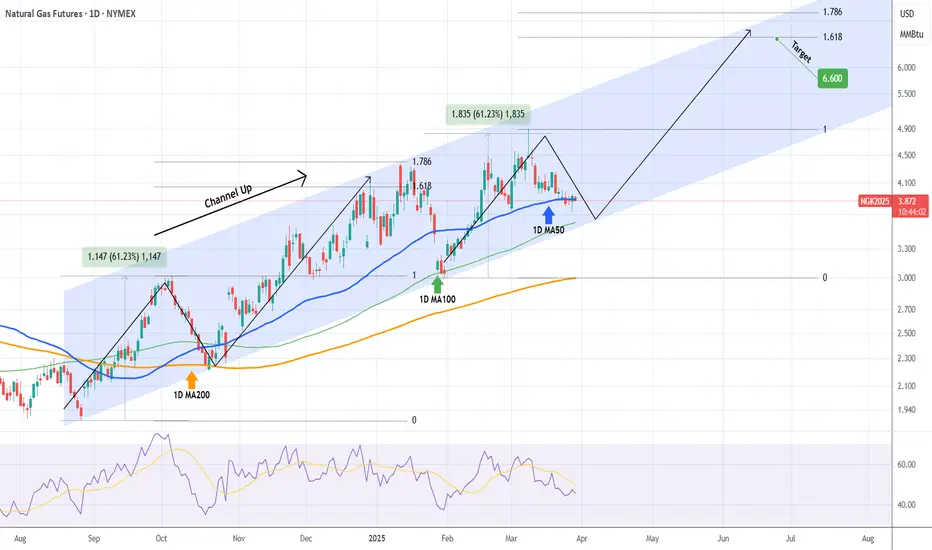
NATURAL GAS Channel Up getting ready for the next Leg to 6.600Natural Gas (NG1!) has been trading within a Channel Up since the August 27 2024 Low and right now it is consolidating on its 1D MA50 (blue trend-line).
The last Higher Low was priced on the 1D MA100 (green trend-line), which isn't far of, actually it sits at the bottom of the Channel Up. Given the strong symmetry on the Channel's initial Bullish Legs (+61.23%), we expect the new rally that is about to start to also reach the 1.618 - 1.786 Fibonacci extension Zone as the previous.
As a result, we see NG at a minimum of 6.600 by June - July.
-------------------------------------------------------------------------------
** Please LIKE 👍, FOLLOW ✅, SHARE 🙌 and COMMENT ✍ if you enjoy this idea! Also share your ideas and charts in the comments section below! This is best way to keep it relevant, support us, keep the content here free and allow the idea to reach as many people as possible. **
-------------------------------------------------------------------------------
💸💸💸💸💸💸
👇 👇 👇 👇 👇 👇
NatGas Natural Gas LongPresident Trump´s tariffs on Russia, energy crisis ,and natgas cycle starting to motivate more buyers accumulationg their positions,going for higher prices.
Technically a profit taking time of the bulls is coming to an end.
Rockets:Buy/add more buys
2 variants:For more conservative traders, and those who have higher risk appetite.
Profit targets are the same.
The entries of both apporoaches are near and closed to strong midterm supports, therefor I have already taken this trades,as they promissing lower risk to me

XNG/USD Analysis: Natural Gas Price Drops to March LowXNG/USD Analysis: Natural Gas Price Drops to March Low
On 27 January, our analysis of the natural gas chart highlighted the formation of an ascending channel. Later, on 10 March, we noted that the sharp price increase had created technical conditions for a correction.
Since then, as indicated by the arrow on the XNG/USD chart, natural gas prices have declined by approximately 19%.
Why Is the Price of Natural Gas Falling?
- Unseasonably Warm Weather: Atmospheric G2 reported on Wednesday that forecasts now indicate significant warming across the eastern half of the U.S. from 31 March to 4 April. This could reduce demand for natural gas used in heating.
- Rising Inventories: According to the EIA’s forecast, weekly natural gas storage levels are expected to increase by +33 billion cubic feet over the past week.
Technical Analysis of XNG/USD Chart
Looking at the broader trend since the start of the year, the ascending channel (marked in blue) remains relevant. However, bears have pushed the price below its median line, shifting movement into a short-term downward channel (marked in red).
Currently, natural gas is trading near the $3.780/MMBtu level, a key price point that has previously acted as both support and resistance. Whether a bearish breakdown or a bullish rebound occurs largely depends on the upcoming EIA report, scheduled for release at 17:30 GMT+3.
This article represents the opinion of the Companies operating under the FXOpen brand only. It is not to be construed as an offer, solicitation, or recommendation with respect to products and services provided by the Companies operating under the FXOpen brand, nor is it to be considered financial advice.

Natural Gas | Gold | Oil | Dollar | Silver Price ForecastMultiple time frame analysis
Support and resistance Levels |
Natural Gas | Gold | Oil | Dollar | Silver Price Forecast

Oil Market at Risk: Potential Breakdown Below Key SupportThe oil market is showing signs of weakness, with a technical triangle formation on the verge of breaking down. Key support at USD 66.50 per barrel is under threat, and several fundamental and macroeconomic factors suggest further downside risks.
Some Key Bearish Factors for Oil
1. Weakening Global Economy
Economic indicators across major economies are flashing warning signs. A slowdown in global growth, particularly in China and Europe, is reducing industrial demand for oil. Weaker economic activity typically translates to lower energy consumption, putting pressure on oil prices.
2. Stronger U.S. Dollar
A rising USD makes oil more expensive for buyers using other currencies, leading to lower demand. If the Federal Reserve maintains its hawkish stance on interest rates, a stronger dollar could continue weighing on oil prices.
3. Supply Overhang and Shale Resilience
Despite OPEC+ production cuts, oil supply remains ample. U.S. shale producers have kept output steady, while global inventories are rising. If supply continues to outpace demand, downward pressure on prices is likely.
4. China’s Slowing Recovery
China, the world’s largest oil importer, has struggled with weaker-than-expected economic data. Lower manufacturing activity and sluggish domestic demand are reducing the country’s need for crude oil, further dampening market sentiment.
5. Geopolitical De-escalation
A potential ceasefire in Ukraine could ease concerns over energy supply disruptions. Lower geopolitical risk would reduce the war-driven risk premium on oil, potentially triggering a price decline.
6. Growth in Alternative Energy
The increasing adoption of electric vehicles (EVs) and renewable energy is gradually reducing structural demand for crude oil. As governments push for greener energy solutions, long-term oil consumption trends may continue declining.
7. Speculative Unwinding
Traders and hedge funds could accelerate the sell-off if USD 66.50 support breaks. Technical breakdowns often lead to increased short-selling and stop-loss triggers, intensifying downward momentum.
Conclusion: More Downside Ahead?
With a weakening economy, strong dollar, and growing supply concerns, oil faces multiple headwinds. If key technical support at USD 66.50 breaks, the market could see further declines in the short term. Unless demand picks up or supply constraints emerge, the bearish trend may persist.
#OilMarket #CrudeOil #BearishOutlook #Energy

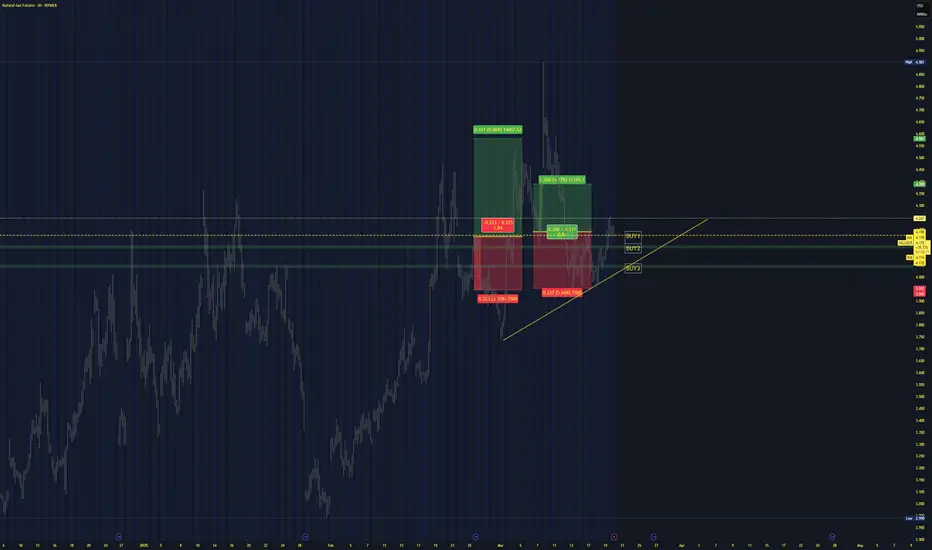
NG1! NATURAL GAS SHORT TERM TARGETNatural Gas Price Forecast: Rises to Five Day High
Natural gas strengthened on Wednesday and reached a five-day high of $4.25. The high for the day was a successful test of resistance around a trendline
Following a breakdown from the trendline last week natural gas consolidated in a relatively narrow four-day price range, largely below the trendline and the 20-Day MA.
Short term entry and targets
We can chose ,because of volatility and high uncertainty,tariffs,news... between 2 profit targets
If the 1st profit target hits,and NG reverses,possibility 1 to take profit
If it passes through, we take profit at 2nd target.
Entries:
In case to entry currently Buy1
If pullback Buy2
If pullback deep Buy3 level.
Alternatives:
Entry 1 Buy1
Entry2 cover
Entry3 Cover2
#NATURAL GAS (Supply Zone)In technical analysis, a Supply Zone is an area on a price chart where selling pressure is expected to be strong, causing the price to potentially reverse or stall. This concept is often used in trading strategies to identify potential areas where price might decline.

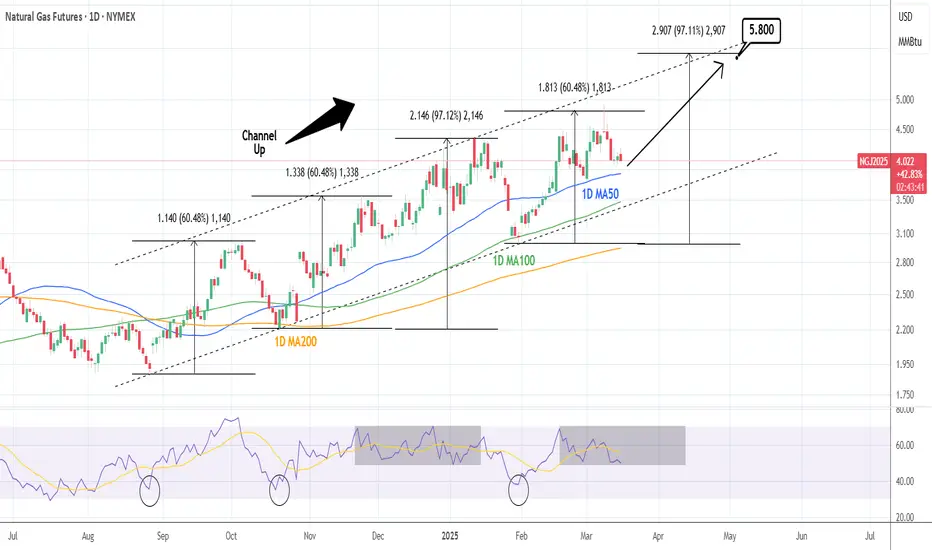
NATURAL GAS: One more technical push.Natural Gas is neutral on its 1D technical outlook (RSI = 49.489, MACD = 0.098, ADX = 23.222), which is the ideal buy opportunity inside its 8 month Channel Up, as long as the 1D MA100 holds. The last HH peaked at +97.12% before pulling back to the 1D MA100. The trade is long, TP = 5.800.
See how our prior idea has worked out:
## If you like our free content follow our profile to get more daily ideas. ##
## Comments and likes are greatly appreciated. ##
XNG/USD "Natural Gas" Energy Market Robbery Plan🌟Hi! Hola! Ola! Bonjour! Hallo! Marhaba!🌟
Dear Money Makers & Thieves, 🤑 💰🐱👤🚀
Based on 🔥Thief Trading style technical and fundamental analysis🔥, here is our master plan to heist the XNG/USD "Natural Gas" Energy Market. Please adhere to the strategy I've outlined in the chart, which emphasizes short entry. Our aim is the high-risk Green Zone. Risky level, oversold market, consolidation, trend reversal, trap at the level where traders and bullish thieves are getting stronger. 🏆💸Book Profits Be wealthy and safe trade.💪🏆🎉
Entry 📈 : "The vault is wide open! Swipe the Bearish loot at any price - the heist is on! however I advise placing Sell Stop Orders below the breakout MA or Place Sell limit orders within a 15 or 30 minute timeframe. Entry from the most recent or closest low or high level should be in retest.
Stop Loss 🛑: Thief SL placed at (4.070) swing Trade Basis Using the 4H period, the recent / swing high or low level.
SL is based on your risk of the trade, lot size and how many multiple orders you have to take.
Target 🎯:
Primary Target - 3.680 (or) Escape Before the Target
Secondary Target - 3.450 (or) Escape Before the Target
🧲Scalpers, take note 👀 : only scalp on the Short side. If you have a lot of money, you can go straight away; if not, you can join swing traders and carry out the robbery plan. Use trailing SL to safeguard your money 💰.
📰🗞️Fundamental, Macro, COT Report, Sentimental Outlook, Positioning Analysis:
XNG/USD "Natural Gas" Energy Market is currently experiencing a Bearish trend for short term period (Bullish in future)., driven by several key factors.
💨⛽Fundamental Analysis
Supply and Demand: Natural gas demand is expected to increase due to the ongoing winter season in the Northern Hemisphere.
Production: US natural gas production is expected to remain steady, with a slight increase in production from the Marcellus shale region.
Weather: Colder-than-expected weather in the US and Europe is expected to drive up natural gas demand.
💨⛽Macro Economics
Interest Rates: The US Federal Reserve has maintained its hawkish stance, keeping interest rates at 5.25% to combat inflation.
GDP Growth: The US GDP growth rate is expected to slow down to 2.0% in 2025, due to the ongoing economic uncertainty.
Global Trade: The ongoing trade tensions between the US and China are expected to have a minimal impact on the natural gas market.
💨⛽COT Data
Speculators (Non-Commercials): 35,019 long positions and 20,015 short positions.
Hedgers (Commercials): 20,011 long positions and 30,019 short positions.
Asset Managers: 25,015 long positions and 15,019 short positions.
💨⛽Market Sentiment Analysis
The overall sentiment for XNG/USD is bullish, with a mix of positive and neutral predictions.
60% of client accounts are long on this market, indicating a bullish sentiment.
💨⛽Positioning Analysis
The long/short ratio for XNG/USD is currently 1.75.
The open interest for XNG/USD is approximately 1.2 million contracts.
💨⛽Inventory and Storage Analysis
US Natural Gas Storage: The US natural gas storage level is currently at 1.8 trillion cubic feet, which is 10% below the 5-year average.
Inventory Levels: Inventory levels are expected to decline further due to the ongoing cold weather and increased demand.
💨⛽Additional Tools and Resources
Weather Forecasts: Colder-than-expected weather in the US and Europe is expected to drive up natural gas demand.
Production Data: US natural gas production is expected to remain steady, with a slight increase in production from the Marcellus shale region.
💨⛽Next Trend Move
Bullish Prediction: Some analysts predict a potential bullish move, targeting $4.20 and $4.50, due to the ongoing cold weather and increased demand.
Bearish Prediction: Others predict a potential bearish move, targeting $3.50 and $3.20, due to the expected decline in natural gas demand after the winter season.
💨⛽Future Prediction
Short-Term: Bullish: $4.00-$4.20, Bearish: $3.60-$3.40
Medium-Term: Bullish: $4.50-$4.80, Bearish: $3.20-$2.80
Long-Term: Bullish: $5.00-$5.50, Bearish: $2.50-$2.00
💨⛽Overall Summary Outlook
The overall outlook for XNG/USD is bullish, with a mix of positive and neutral predictions.
The market is expected to experience a moderate increase, with some analysts predicting a potential bullish move targeting $4.20 and $4.50.
Real-Time Market Feed
As of the current time, XNG/USD is trading at $3.90, with a 1.0% increase in the last 24 hours.
📌Keep in mind that these factors can change rapidly, and it's essential to stay up-to-date with market developments and adjust your analysis accordingly.
⚠️Trading Alert : News Releases and Position Management 📰 🗞️ 🚫🚏
As a reminder, news releases can have a significant impact on market prices and volatility. To minimize potential losses and protect your running positions,
we recommend the following:
Avoid taking new trades during news releases
Use trailing stop-loss orders to protect your running positions and lock in profits
💖Supporting our robbery plan 💥Hit the Boost Button💥 will enable us to effortlessly make and steal money 💰💵. Boost the strength of our robbery team. Every day in this market make money with ease by using the Thief Trading Style.🏆💪🤝❤️🎉🚀
I'll see you soon with another heist plan, so stay tuned 🤑🐱👤🤗🤩

Commodity Outlook: Finding antivenoms in the Year of the SnakeWe are about a month into the Chinese Year of the Snake. The preceding Year of the Dragon (10 February 2024 to 28 January 2025) brought significant momentum to the asset class with broad commodities rising 10%, precious metals rising 36%, industrial metals rising 12%, and even energy and agriculture mustering a late gain (close to 2% each)1. However, the Year of the Snake presents several macro challenges for commodities. Renewed trade protectionism from the US, under the new Trump Administration, is likely to dampen global trade. Additionally, higher bond yields and a strong US dollar create further headwinds for the commodities market. China’s reticence to stimulate big is also holding back the asset class.
Despite these headwinds, we have identified several micro factors that could provide support for certain commodities—what we refer to as our ‘antivenoms’. We remain optimistic about precious metals, aluminium, and European natural gas. Additionally, some of the macroeconomic challenges may ultimately prove less severe than initially anticipated, creating potential upside opportunities for commodities that currently reflect bearish sentiment.
Strong US dollar
The recent strength of the US dollar has historically correlated with weaker commodity prices. While this pattern has been inconsistent post-COVID-19, the dollar's resurgence could once again pressure commodities. Historical data suggests a strong dollar often aligns with declining commodity values.
Trump’s trade policies and market impact
Donald Trump’s return to the presidency introduces uncertainty into trade and commodity markets. Trump's first presidency saw a trade war with China and other nations, negatively impacting global trade and commodity prices. While extreme tariff measures have often been bargaining tactics, the risk of real implementation remains. In his second term, some tariffs were announced and then delayed; at the time of writing, we still have no real guide as to whether they will be implemented or when. This uncertainty is already dampening market sentiment and increasing long-term interest rates, further constraining commodities.
Economic and inflationary concerns
Tariffs could raise inflation in the US while simultaneously depressing global commodity prices due to reduced demand. This dynamic may complicate the Federal Reserve’s (Fed) efforts to control inflation, potentially leading to prolonged high interest rates.
Climate policy reversals
Trump has vowed to withdraw from the Paris Climate Agreement and declared a “national energy emergency,” reversing climate regulations and boosting fossil fuel production. His administration is expected to cancel a $6 billion Department of Energy program aimed at industrial emissions reduction and repeal incentives for electric vehicles. These changes could suppress demand for critical materials used in clean technology, such as base metals.
At the same time, deregulation of oil, gas, and mining operations may increase the supply of key commodities like copper, aluminium, nickel, and cobalt. Major projects, such as Rio Tinto’s copper mine in Arizona, could proceed after years of delays. While immediate production increases are unlikely in 2025, long-term supply growth is possible.
Geopolitical risks and energy markets
A ceasefire between Israel and Hamas, brokered just before Trump's inauguration, has eased some geopolitical risk, though its stability remains uncertain. As we write, a peace deal between Russia and Ukraine is being brokered by the US. Short-term oil price spikes are possible if sanctions are initially tightened to get parties to the negotiating table but, ultimately, we could see easing oil and gas prices if a deal is hashed out.
The US has been pressuring Europe to purchase more American natural gas, but Russia’s LNG shipments to the EU remain significant. A resolution of the Russia-Ukraine war could weaken US leverage in energy negotiations, making Europe less dependent on American gas.
Stricter enforcement of Iranian oil sanctions under Trump could drive oil prices higher. However, OPEC2 members may counteract this by increasing supply, potentially offsetting price gains.
China’s economic strategy and commodity demand
China remains the world’s largest consumer of commodities, yet its recent economic weakness has limited demand growth. Unlike previous economic cycles where China launched large stimulus measures, its current approach focuses on smaller, targeted interventions. The government has stabilised the real estate sector but remains wary of excessive stimulus due to debt concerns.
China is investing heavily in clean technology and renewable energy infrastructure, supporting metal prices despite weak real estate demand. US tariffs on China could accelerate its push toward energy independence, promoting domestic adoption of solar, battery, and electric vehicle technologies.
Trade tensions could escalate into retaliatory actions, such as China restricting exports of critical materials, as seen with gallium, germanium, and graphite in response to semiconductor disputes. Further restrictions could impact global supply chains for energy transition materials.
China’s depreciating Yuan complicates economic policy. The People’s Bank of China has been intervening to stabilise the currency, limiting its ability to cut interest rates. While a policy shift to boost growth led to short-term market gains in 2024, further action remains constrained by currency pressures.
Conclusion
In the Year of the Snake, we are searching for antivenoms to counter the potential threats posed by trade wars, a strong US dollar, and a China that may be unable or unwilling to overcome its economic weakness.
We see strong opportunities in gold, silver, aluminium, copper, zinc and European natural gas, as each of these has compelling drivers that could withstand broader headwinds in the commodity complex.
As policies become clearer, we may find that our fears were overstated, potentially paving the way for a relief rally across the broader commodity complex. Until then, we place our confidence in these antivenoms.

XNG/USD Analysis: Natural Gas Price Hits Over Two-Year HighXNG/USD Analysis: Natural Gas Price Hits Over Two-Year High
On 27 January, while analysing the natural gas chart, we noted that price fluctuations:
→ Were forming an ascending channel.
→ Identified $3.700 as a key resistance level.
As shown on the XNG/USD chart, bears had control in late January but failed to maintain their grip. Since then:
→ Natural gas prices have continued their upward trajectory.
→ The $3.700 level was breached, becoming part of a resistance zone with an upper boundary at $3.800, which later acted as support (as indicated by the arrow).
As a result, today, natural gas prices have surged to $4.800/MMBtu—the highest level since late December 2022.
Bullish Factors Driving the Market (According to Trading Economics):
→ Weather Conditions – A cold spell in the U.S. has increased demand for heating gas. Meteorologists predict a shift towards milder temperatures across 48 states in March.
→ LNG Exports – U.S. liquefied natural gas (LNG) exports have hit a record high of 15.6 billion cubic feet per day under the new administration. Meanwhile, trade uncertainties, including a potential slowdown in natural gas flows from Canada to the U.S., are raising concerns among market participants.
Technical Outlook for XNG/USD:
→ The market remains in an uptrend (indicated by blue lines), with the price now exceeding its upper boundary.
→ The RSI indicator is approaching overbought levels and may form a bearish divergence.
These observations suggest that the price is in a vulnerable position for a pullback. If this scenario unfolds, a test of the $4.250 area cannot be ruled out.
Trade on TradingView with FXOpen. Consider opening an account and access over 700 markets with tight spreads from 0.0 pips and low commissions from $1.50 per lot.
This article represents the opinion of the Companies operating under the FXOpen brand only. It is not to be construed as an offer, solicitation, or recommendation with respect to products and services provided by the Companies operating under the FXOpen brand, nor is it to be considered financial advice.

Gold | Oil | Dollar | Silver | Natural Gas Price ForecastFutures Commodities Forecast | Gold | Oil | Dollar | Silver | Natural Gas Price Forecast
COMEX:GC1! NYMEX:NG1! NYMEX:CL1! COMEX:SI1!
