Natural GasWednesday, 9 November 2022
22:04 PM (WIB)
The Head N Shoulder, Tweezer Top Performance, and Three Black Crowes at the Resistance Lines confirmed the Natural Gas is still in the Bearish Market zone .
At this moment, the price could face heavy pressure to downgrade.
And for exit from the Bearish Market Pressure, Natural Gas has 2 Months period of negotiation, which means after December 2022, the price could be much lower than today.
Following the news, Europe still has strong supplies of energy security for the winter season in December and after.
Unfortunately, because this is the Crisis of the Recession, everything about the price is plunged to the ground. The major trend is still Bearish.
Keep updated and note.
Natural Gas

Natural gas one more low then we explode to the upside We've been tracking this C wave for some time now and it finally looks like we're getting the wave 5 of C which should finish somewhere around the $5 area. Once we reach this price point we will be going long with an ultimate target of $15 which is a HUGE trade.

sell on usoilrocky week for oil as China has made the decision to keeo the COVID zero policy. The lockdown in China is causing demand fears for oil along with recession fears as the Fed did yet another interest rate hike and the Dollar oars.
USOil is creating a double Top you can continue to hold long turn. The last leg formed took only 10 days to form. Or do shorter term hold taking a TP at 86.00, 84.50

UNG: Best guess of what is next for natural gas. We did get a bounce up in natural gas after my first post on October 23rd. (see link below if interested). Price rose just enough to close the closest gap. In the hourly chart this was followed by a .78 correction. It may move lower in Monday to closes the small gap below the current price but sometimes starting gaps are not closed right away. If Monday goes up I would think it is likely the next higher gap would get closed.
On the daily chart I used the daily RSI (using the positive reversal) to determine a possible target if the rally continues. When using the RSI remember it is determined by the closing price.
As always: act on your own analysis. But I hope this is helpful. Have a great weekend.

Natural GasTuesday, 8 November 2022
21:36 PM (WIB)
There is traffics of Tankers carrying liquefied Natural Gas that are floating off Europe’s Coast, waiting for the price of the fuel to rise emerging the winter season. This is getting hot on Natural Gas because the price chart doesn’t look will rise higher. Although there is a big gap loop that reached around $7.322, the Bearish Market seems to refuse the Natural Gas price going higher. Or that might be a very brave and courageous negotiation from the Bearish Market? Until now, the price has reached $6.5 exactly where the MA200 stands on it.
It looks like the Bears are coming with the superpower of volumes from upstairs. At this stage, there is no information about where is the direction of the Bears, because the MACD and Stochastic RSI not showing for the price has been oversold at all. However, as this bargain is getting bigger and bigger, it’s time for the Bullish Market to stand up at MA200. This will give a strong sign for the market to increase the price of Natural Gas. The price is still possible to drop off to around $6, where that price is 61.8% of the Bearish Golden Ratio.
The Tankers will stay longer or might be back again if the Natural Gas price doesn't show will higher from now.

Trading Of The DayTuesday, 8 November 2022
18:05 PM (WIB)
Focus on dynamic support for long-term transactions is the best thing to do today.
Natural Gas is on the way to reaching $9 or even more.
Crude Oil is on the way to reaching $99 or even more.

Nov 7,22-NG Winner Again-1000 pt profitWhat a beautiful open last night for NG - It had a massive Gap Up where in my last post to you I said I was looking for another 700 pt profit closing at 6.7. Because of the Gap Up I was able to close my Buy Order at 7. Buy at 6 and close at 7 is a 1000 point profit - NICE :-)
Last up is my first Buy Order from about a month ago at 7. I'm looking again for a 700 pt profit, but depending what price action is looking like I might close it out at 7.5, we shall see.
Anyway, 3 for 3 on some decent profits over the last few weeks - congrats to all who have been following my trades.
Stay safe and take care.
Heiko

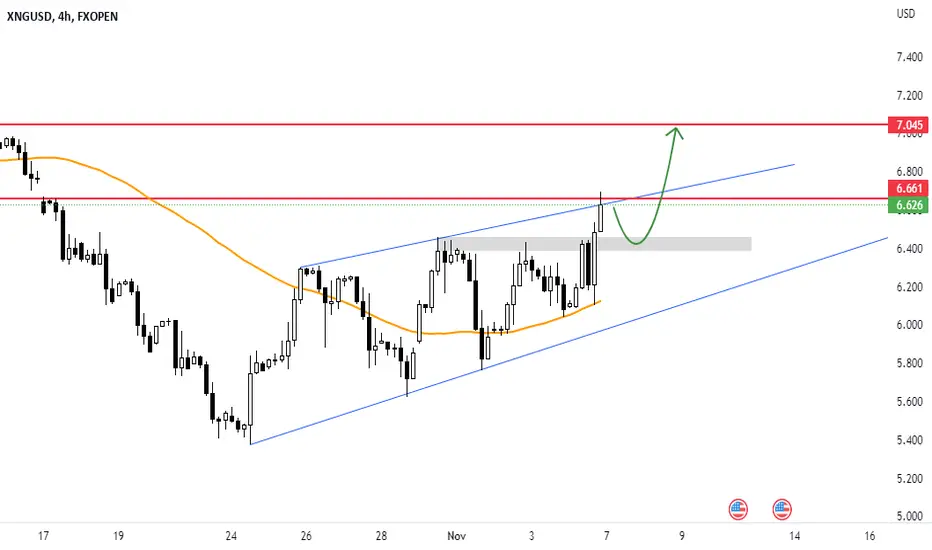
XNGUSD - NGAS NEXT WEEK MOVEGas this week had a strong bullish movement, and I expect it to complete this movement next week, with a correction that may target 6.40 levels, from which it may launch towards 7.0 levels.The gas has been in an ascending channel for 11 days, but will it breach it and rise towards the 7.0 levels? We wait next week to see what it has in store.
🔥💥 Like, Shared and subscription 💥🔥
Note: If you are a beginner trader, you should be aware of these rules:
1: Do not covet
2: Don't trade too much
3: Secure your positions after entering the profit
4: Enter contracts that fit your portfolio
5: Adhere to all recommendations
NGAS: Will Demand for Natural Gas Increase With Climate Change?Natural Gas's all-time price action/chart suggest that it is due for a sizeable, generational bull run, to start within the next 3 years. One could blame it on war or climate change or politics but I am not smart enough to determine which may be the actual cause, if any. I can instead deduct from NGAS' wavemap that we are unlikely to enjoy the low prices we've seen during the early 90s or at late as Spring 2020.
I've never looked at an inflation chart or have been able to determine what's next for us in that regard but I think this commodity alone can give us some decent expectations. What happens if/when it costs 20x more to keep your home cool in the summer (or warm in the winter)?
With an extended diagonal wave in primary Wave 1 of NGAS, we can expect that primary Wave 3 will be likely extended beyond the 1.618 level. We cannot say that this will occur for sure but it is as likely as it ever is. After finding possible support below $5 in 2024, this commodity could make citizens want to hit the rewind button irl. By 2037-2040, Natural Gas could and should be more than the price of Oil.
At this point and time, I genuinely believe that NGAS will go 40X within the next 15 years. This is indication that I've found through continued analysis of price action. I have no reason to doubt this perspective but am well aware that it could be invalidated upon any given day. For continued analysis of this worldwide commodity and help with taking advantage of a possibly upcoming generational swings, come surf with me and the Digital Surf Trading Community.

NATURALGAS - Fill the gap ✅Hello traders!
‼️ This is my analysis on NATURALGAS .
Here we are bullish from H4 timeframe perspective, so I am looking for longs. I expect price to fill that gap above and the to make a retracement to look for a long from trendline.
Like, comment and subscribe to be in touch with my content!

Nat Gas ShortHead and Shoulders short breakout.
3.3 risk ratio.
Would be nice for humanity if gas prices drop.
More than a trade, a potential economic indicator.

Norwegian pennystock Flex LNG (Natural gas transportation)Table of contents:
§ 1 About FLNG
§ 2 The market
§ 3 Why I am bullish
§ 4 The risks
§ 1
Flex LNG(FLNG) is a Norwegian company.
They specialize in transporting liquid natural gas around the world for heat, cooking etc.
They also create ships themselves, specially created within the CE regulations to ensure safe transport, as natural gas is highly flammable and explosive (who would have figured that one out...)
Now, FLNG has done something that might be incredibly smart or it might be incredibly stupid depending on which way things goes:
Most companies transporting gas and oil get a fixed rate on the transport, however FLNG has made it so they get paid based on the spot price of natural gas (futures are called NG1! if you want to see the price)
This means if the price of natural gas goes up, so does their revenues, which also creates an interesting scenario for us as I will explain in more details in § 3.
§ 2
FLNG's market is mostly based in China and India (~2 billion people) which in latest years have used a lot of coal for heating, the problem with burning coal is that it's very harmful to the environment, it releases a lot of CO2 and last but not least it releases microscopic particles in the air increasing cases of astma and COPD (Chronic Obstructing Pulmonary Disease) which I don't have to tell you - is reall bad.
Now both China and India needs to move over to a more environmental friendly source of energy and heat, this is where natural gas comes in.
When you burn natural gas, you only get CO2 and water as a biproduct, which is still bad for global warming, but does not increase cases of COPD or astma.
§ 3
I am bullish when it comes to FLNG as I believe it will be ranging a lot based on time of year, as we can see when it comes to natural gas spot prices, this can make it a lot easier to predict price movements, as price has historically been highest in the winter (because it's cold and people need more heating, again, who would have figured...), and lower in the summer as very few people need heat in the summer.
I also think that because the market is so huge with at least 2 billion people I think there is a LOT of room for expansion.
§ 4
Although I believe this is an up and coming industry that will be huge the coming years, there is no guarantee that FLNG will be the leaders in the market, but seeing as Norway historically have been one of the leading ship builders and also leading within oil technology I strongly believe flex have a high potential. However, if it does not reach a 50-100% increase within February, it will likely not happen this year as spot prices will be on their way down again.
Another risk is market turbulence which might hurt FLNGs price.
To end it off with a little bit of my techincal analysis:
Price bounced from the 80NOK mark (~$10) where it has not been since it's true pennystock days where liquidity was scarce. Price was trending downwards after the winter just like NG prices have too. I believe the 80NOK level will hold because a lot of bigger institutions bought in at 120NOK and I believe they will either look to average down around the 80NOK mark to get their average to 100NOK to lower their overall downside.
And as we are smarter than the institutions (not really) I came up with an idea on how to spot more accurately when price is likely to explode (thank me later):
Look at weather forcast for the most populated areas in China and India, when temperatures start dropping it's probably time to buy either FLEX or NG futures.
Thank you all for reading and have a great rest of your day.

Natural Gas (NATGASUSD): Technical Outlook 💨
A lot of questions about Natural Gas.
Here is my detailed technical outlook.
2 weeks ago, the market reached a key daily structure support and nicely bounced from that.
Zooming in the chart and analyzing a price action, we may spot an ascending triangle formation - a classic bullish accumulation pattern.
The price sets higher lows, respecting 6.2 - 6.6 horizontal resistance.
I believe that the next bullish move will initiate after a bullish breakout of the underlined structure (we need a daily candle close above that to confirm the breakout).
A bullish continuation will be expected to 7.076 then.
Alternatively, a bearish breakout of a trend line may push the market to a current low.
❤️If you have any questions, please, ask me in the comment section.
Please, support my work with like, thank you!❤️

NGThe possibility of increasing the price of natural gas up to the desired range where the corrective movement of time is higher is very high.

✅NATGAS SHORT FROM RESISTANCE🔥
✅NATGAS is going up now
But a strong resistance cluster level is ahead
Thus I am expecting a pullback
And a move down towards the target
SHORT🔥
✅Like and subscribe to never miss a new idea!✅

NATURAL GAS: I'M WAITING NEXT SPRINGHi guys,
as you can see on my NatGas analyses, for now i'm bearish but this doesn't mean i'm short on price.
I'm just watching and waitinig for a good entry point to long NatGas, and now seems obvious we were in a big channel that now is broken.
So what's next?
Maybe we will see a retest of support in these weeks and then a big fall, since all EU country have big reserve for this winter.
Next year will be more different.
Let's see.
