Short Term Trade Idea Natural Gas Buy at ₹ 275/- Target ₹ 295/-. Buyer's are buying and it will move to ₹ 287/- in short term. Don't panic if some reverse happens to ₹ 257/-. If you will wait, again price will rebound like it happened in last week.
Natural Gas

Natural Gas | Oil | Dollar | Silver | Gold Price ForecastNatural Gas | Oil | Dollar | Silver | Gold Price Forecast

NATGAS BULLISH BIAS|LONG|
✅NATGAS fell again to retest the support of 3.20$
But it is a strong key level
So I think that there is a high chance
That we will see a bullish rebound and a move up
LONG🚀
✅Like and subscribe to never miss a new idea!✅

NATGAS Will Grow! Buy!
Hello,Traders!
NATGAS made a retest of
The horizontal support level
Of 3.00$ and we are already
Seeing a local bullish rebound
So we will be expecting a
Further bullish move up
Buy!
Comment and subscribe to help us grow!
Check out other forecasts below too!

Natural Gas Prices Rebound from 2.5-Month LowNatural Gas Prices Rebound from 2.5-Month Low
On 19 November, we analysed the natural gas price chart, noting:
→ the formation of an upward channel (marked in blue);
→ a potential bullish attempt to break the key $3.200 level, which had acted as resistance (highlighted with arrows).
As seen on the XNG/USD chart, the price did rise above $3.200 but failed to hold. After fluctuating in the upper half of the channel, it dropped below $3.200 to the channel's lower boundary, driven by:
→ a bearish report from the Energy Information Administration, showing US gas inventories above the five-year average;
→ a report from financial firm LSEG noting increased average gas production across 48 US states.
This decline pushed natural gas prices to a 2.5-month low around the $2.935 level.
What Could Happen Next?
From a technical perspective on the XNG/USD chart:
→ support from the channel's lower boundary (reinforced by the psychological $3.000 mark) is already evident in an emerging price reversal (indicated by an arrow);
→ on the other hand, the $3.200 level may resume acting as resistance.
It’s likely that natural gas prices will fluctuate between $3.000 and $3.200, with weather forecasts playing a decisive role in shaping consumption expectations for the winter season.
This article represents the opinion of the Companies operating under the FXOpen brand only. It is not to be construed as an offer, solicitation, or recommendation with respect to products and services provided by the Companies operating under the FXOpen brand, nor is it to be considered financial advice.

NaturalGas enters resistance zone. H4 25.11.2024⛽️ NaturalGas enters resistance zone 📉
On gas the price has entered the zone of strong resistance 3.51-3.63 from which I expect a new exit of the price down. Now on the comeback a false break above is possible, but in general the zone for selling is strong. I aim for a bounce down to 3.0 and 3.15, and there will clarify. The main support is near 3.0 and there is the boundary of the ascending channel from which they can bounce up again.
FX:NGAS

NATGAS BULLISH REBOUND AHEAD|LONG|
✅NATGAS will be retesting a support level of 3.128$ soon
From where I am expecting a bullish reaction
With the price going up but we need
To wait for a reversal pattern to form
Before entering the trade, so that we
Get a higher success probability of the trade
LONG🚀
✅Like and subscribe to never miss a new idea!✅

Natural Gas | Oil | Dollar | Silver | Gold Price ForecastNatural Gas | Oil | Dollar | Silver | Gold Price Forecast

NATURAL GAS - 2025 IS THE LAST YEAR IT WILL BE CHEAP !📣 Hello everyone!
I believe that with a high degree of probability, a long-term reversal model "Inverted head and shoulders" is being formed on the price chart of natural gas.
If the above is true, then in 2025 the right shoulder will be formed and this is the last year when natural gas will cost so cheap $$ !
From my point of view, after the "Inverted head and shoulders" model finds its confirmation, or if the high 9.1560$ is broken even earlier, WE CAN CONDITIONALLY SAY THAT THE PRICE OF GAS WILL NEVER DROP <1.5$ AGAIN - IN MY UNDERSTANDING, THIS PROBABILITY IS >90%
Oil will also form a bottom next year and from the end of 2025 - the beginning of 2026, I expect the beginning of a long-term bull market!
That's all for today, I wish you good luck in making independent trading decisions and profit. Please analyze the information received from me, always think only with your head!
Goodbye! ✊

NATGAS Support Ahead! Buy!
Hello,Traders!
NATGAS is going down to
Retest the horizontal support
Of 3.09$ and as we are
Locally bullish biased
We will be expecting a
Local bullish rebound
Buy!
Comment and subscribe to help us grow!
Check out other forecasts below too!

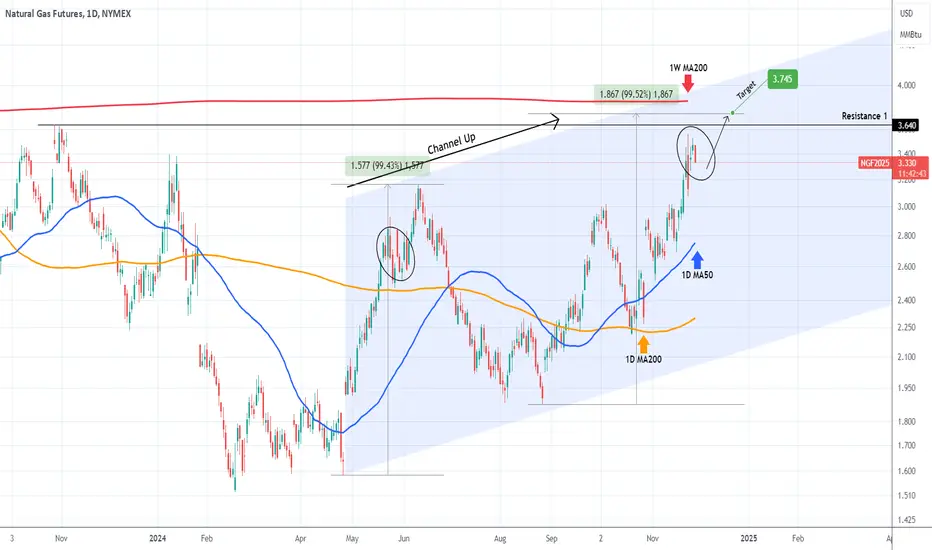
NATURAL GAS Final push before peakingNatural Gas (NG1!) rose and hit our 2.900 Target called on our last analysis (August 29, see chart below) and after a pull-back, broke above the Triangle:
The Triangle transitioned to a Channel Up and the price is already near the end of its Bullish Leg. The 1W MA200 (red trend-line) is the long-term Resistance (untouched since January 17 2023) so only above it can we justify a new bullish trend.
Until then, our Target is 3.745, which represents a +99.50% rise from the last Higher Low, which is the same % rise as the first Bullish Leg of the Channel Up.
-------------------------------------------------------------------------------
** Please LIKE 👍, FOLLOW ✅, SHARE 🙌 and COMMENT ✍ if you enjoy this idea! Also share your ideas and charts in the comments section below! This is best way to keep it relevant, support us, keep the content here free and allow the idea to reach as many people as possible. **
-------------------------------------------------------------------------------
💸💸💸💸💸💸
👇 👇 👇 👇 👇 👇
Natural Gas , is there still potential that can be acquired or?Hi guys, let's take a look into natural gas which has been quite underwhelming for the past probably 6-12 months without any significant movement. The only recent interest shift in the price is the previous resistance line becoming a Resistance Line siting at the level of 3.20 and the formation of a new stable Support Line at the level of 2.60-2.70 level. The main drive into the prices of Natural Gas has been the Hurricane Helene disrupting the overall supply chain in the U.S. and the recent news coming from Russia and it's change to the Nuclear Weapon legislation , after Ukraine received the green light from the U.S. and the U.K. to use their current provided arsenal of weapons. As of now the main moving power of Natural Gas is Europe and its supply of NG. It has been confirmed that Europe has enough storage of Natural Gas to take care of the winter, but as we are seeing November is starting to become colder and December&January is expected to be significantly colder so there would definitely be higher demand than usual. My personal input on this opportunity is in two options.
Option 1 strong entry , from the current level of 3.50 with a target of
Target 1 : 4.00
Target 2 : 4.25
Option 2 calculated entry , wait for the price to drop down and retest the resistance line of 3.20 and then follow up with the same targets.
Target 1 : 4.00
Target 2 : 4.25

Crude Oil to $72 and then potentially $75Crude Oil to $72 and then potentially $75
Idea would invalidate with a daily close below $68.8

NATGAS SHORT FROM RESISTANCE|
✅NATGAS is going up now
But a strong resistance level is ahead of 3.646$
Thus I am expecting a pullback
And a move down towards the target at 3.300$
SHORT🔥
✅Like and subscribe to never miss a new idea!✅

Natural Gas - Bullish Momentum Re-rating?The last few weeks have been huge for Natural Gas NYMEX:NG1!
...But why are Natural Gas futures up over 20%?
Here are some potential reasons:
Colder than Forecasted Winter coming for the US
Trump Administration favorable of Natural Gas as future energy source
Purchase Spree by Funds with existing net short Positions
Although the Natural Gas market in its entirety is complex, these reasons do present as potential catalysts to an appreciating price environment.
But is there potential for further upside going forward?
Looking at the chart, we can see a recent breakout attempt above the $3.2 region - This has resulted in an official re-rating of momentum to 'Bullish', as signified by the blue symbol (IMO).
Our Price Guide:
Upside continuation potential if price can hold above $3.400
Significant bearish continuation risk potential if price retreats back below the $3.076 mark
We're inspired to bring you the latest developments across worldwide markets, helping you look in the right place, at the right time - We will continue to monitor the Natural Gas market in the event there are any rapid changes.
Thank you for reading! Stay tuned for further updates, and we look forward to being of service along your trading & investing journey...
Please note all information contained within this post is strictly for informational purposes only and is not intended to be investment advice. DYOR & Consult your licensed financial advisors before acting on any information contained within this post.
Love & Wisdom,

Natural Gas: Analyzing Seasonal Trends and Supply PressuresIn the natural gas market, we observe a critical juncture that suggests a potential shift in pricing trends. Over the past decade, historical data has revealed a recurring seasonal pattern that may indicate the onset of a bearish phase during this particular time of year.
Currently, the market is approaching a significant supply zone, which could serve as a pivotal trigger for price corrections. This area has consistently tested traders' sentiments, and if the pressures of supply outstrip demand, it may catalyze a downward movement in prices.
Given these observations, positioning for a short scenario seems increasingly viable. As market participants weigh their options, it is essential to remain vigilant and analyze how these supply-demand dynamics will unfold in the coming weeks. Understanding the interplay between seasonal trends and market sentiment will be crucial as we navigate this potentially shifting landscape in the natural gas sector.
✅ Please share your thoughts about NG in the comments section below and HIT LIKE if you appreciate my analysis. Don't forget to FOLLOW ME; you will help us a lot with this small contribution.

Natural Gas | Oil | Dollar | Silver | Gold Price ForecastNatural Gas stock Bulls Support & Resistance Guide

NATGAS REBOUND AHEAD|LONG|
✅NATGAS is approaching a demand level around 3.00$
So according to our strategy
We will be looking for the signs of the reversal in the trend
To jump onto the bearish bandwagon just on time to get the best
Risk reward ratio for us
LONG🚀
✅Like and subscribe to never miss a new idea!✅

How To Trade Natural Gas: Tools and Approaches How To Trade Natural Gas: Tools and Approaches
Natural gas trading presents unique opportunities due to its critical role in the global energy market and its inherent volatility. This article delves into the various strategies and tools traders can use to navigate natural gas CFDs, from fundamental and technical analysis to understanding market dynamics.
Overview of the Natural Gas Market
Made up of primarily methane, natural gas is a key fossil fuel that’s grown in use over the past two decades. It forms deep beneath the Earth's surface from the remains of plants and animals buried under layers of sediment and subjected to intense heat and pressure over millions of years. It’s typically found near oil reserves and must be extracted and processed before it can be used.
Natural gas is a relatively clean-burning energy source, at least compared to coal or oil. It plays a crucial role in the global energy sector, accounting for about 23% of energy consumption worldwide in 2023, according to Statista, and 33% of US energy consumption in 2022, according to the EIA.
It’s also highly versatile, used across various sectors. For instance, in 2022, natural gas provided approximately 38% of the energy consumed by the US electric power sector (EIA), making it a primary source for electricity generation. The industrial sector also accounted for around 32% of natural gas consumption, using it as both a fuel and a raw material for producing chemicals, fertilisers, and hydrogen.
Natural gas is also essential for residential and commercial heating, particularly in colder regions. Moreover, the transportation sector adopts natural gas, particularly in the form of compressed natural gas (CNG) and liquefied natural gas (LNG), to reduce emissions and costs.
Market Structure and Participants
The natural gas market consists of various key players, including producers, consumers, and traders. Major producing countries include the United States, Russia, and Qatar. According to the EIA, the US led the world in LNG exports in 2023, averaging 11.9 billion cubic feet per day. Natural gas production involves extraction, processing, and transportation to end-users via extensive pipeline networks and LNG shipping routes.
The supply chain for natural gas begins with extraction from reservoirs, followed by processing to remove impurities and liquids. The processed gas is then transported through pipelines or converted into LNG for shipping to international markets. Once delivered, it is distributed to consumers for the various applications described.
Key participants in the natural gas market include multinational energy companies (e.g., ExxonMobil, Gazprom), regional producers, and numerous traders who facilitate the buying and selling of natural gas on commodity exchanges. These players operate within a complex regulatory framework that varies by country, influencing production levels, prices, and market dynamics.
Key Factors Influencing Natural Gas Prices
Let’s now take a closer look at the factors driving natural gas prices.
Supply and Demand Dynamics
The balance of supply and demand is a fundamental driver of natural gas prices. On the supply side, production levels play a crucial role. As with many commodities, higher production, in this case driven by advancements in extraction technologies like hydraulic fracturing, typically leads to lower prices.
Storage levels also impact prices; high storage volumes, or inventories, can cushion against supply disruptions, keeping prices relatively stable. Conversely, low storage levels can lead to price spikes.
Consumption patterns are equally important; industrial usage, residential heating, and electricity generation are primary demand drivers. Additionally, the cost of extraction, including technological and labour costs, feeds into the overall pricing of natural gas.
Geopolitical Events and Policies
Geopolitical stability and regulatory policies significantly affect natural gas prices. For example, the substantial 2022 reduction of Russian gas exports to Europe caused record price increases due to severe supply constraints.
Trade policies, such as tariffs and export restrictions, also impact prices. The US has seen a notable rise in LNG exports in recent years and become a major supplier of natural gas to Europe. Recent policy decisions aimed at energy security and diversification, especially in Europe and Asia, have led to increased demand for non-Russian natural gas, affecting global prices.
Weather Patterns and Seasonal Variations
Weather significantly affects natural gas demand and supply. Cold winters increase demand for heating, often leading to higher prices, while mild winters can reduce demand and depress prices. Similarly, hot summers boost demand for electricity to power air conditioning, influencing prices. Natural disasters like hurricanes can disrupt production and transportation infrastructure, causing supply shortages and price spikes.
Natural Gas Trading Instruments
When it comes to actually trading gas, there are a few instruments traders use.
Contracts for Difference (CFDs)
CFDs are a popular instrument for trading natural gas due to their flexibility and leverage. A CFD is a derivative that allows traders to speculate on the price movements of natural gas without owning the physical commodity. Traders can go long (buy) if they anticipate price increases or short (sell) if they expect prices to fall. They are the most popular choice for anyone looking to be a natural gas trader. The CFD natural gas symbol is XNGUSD. You can trade US natural gas CFDs in FXOpen’s TickTrader trading platform.
One of the main advantages of CFDs is leverage, which allows traders to control a large position with a relatively small amount of capital, potentially enhancing returns but also increasing risk. Additionally, CFDs offer access to the natural gas market with lower upfront costs and the convenience of trading on various platforms without the need for storage or delivery logistics.
Futures Contracts
Natural gas futures are standardised contracts traded on exchanges such as the New York Mercantile Exchange (NYMEX). These contracts obligate the buyer to purchase a specific amount of natural gas at a predetermined price on a future date.
Futures are widely used by producers and consumers to hedge against price volatility and by speculators seeking to take advantage of price movements. While natural gas futures are suitable for some traders, their complexity and potential obligation to take delivery may deter those simply looking to speculate on the market’s price movements.
Options Contracts
Options on natural gas futures provide the right, but not the obligation, to buy or sell futures contracts at a set price before the option's expiration. These can be used to hedge positions in the natural gas market or to speculate with limited risk. Options strategies can range from simple calls and puts to more complex combinations like spreads and straddles, but are also highly complicated and require a strong understanding of how options work.
Exchange-Traded Funds (ETFs)
ETFs allow investors to gain exposure to natural gas prices without trading futures or options directly. These funds track the price of natural gas or the performance of natural gas companies. ETFs are generally used by investors to diversify their portfolios and participate in the natural gas market with lower complexity compared to futures and options.
What to Know Before Trading Natural Gas
Before trading natural gas, it’s important to consider the following key aspects:
- Trading Units: Natural gas is typically traded in units of million British thermal units (MMBtu).
- Trading Hours: Natural gas trading hours are specific, with futures trading on the NYMEX from 6:00 PM to 5:00 PM ET, Sunday through Friday. Ensure you know the trading schedule of your platform before getting started. Both CFD US natural gas and forex pairs can be traded on FXOpen’s TickTrader platform on a 24/5 basis.
- Volatility: Natural gas prices are highly volatile, often more so than currency pairs and many other commodities. Be prepared for significant price swings.
- Spreads: The relatively wide spread of natural gas, or the difference between the bid and ask price, can lead to higher trading costs.
- Leverage and Margin: Trading natural gas, especially through CFDs, involves leverage, which can amplify both gains and losses. Ensure you understand margin requirements and risk management strategies before getting started.
Key Strategies for Trading Natural Gas CFDs
Trading natural gas CFDs can be a lucrative endeavour, but it requires a solid understanding of the market and effective natural gas trading strategies.
Fundamental Analysis
Fundamental analysis focuses on the economic factors that influence natural gas prices. Key elements include supply and demand dynamics, inventory levels, and macroeconomic indicators. For instance, the US Energy Information Administration (EIA) releases weekly reports on natural gas storage levels, which provide insights into supply and demand balance. High inventory levels generally indicate lower prices, while low inventory can signal higher prices due to anticipated supply constraints.
Economic growth and industrial demand also play significant roles; as industries expand, natural gas consumption typically rises, driving prices higher. Moreover, expectations of colder-than-normal winters increase demand for heating, driving prices up, while mild winters can suppress demand. Lastly, geopolitical events, such as conflicts in gas-producing regions, can disrupt supply chains and cause price volatility.
Technical Analysis
While fundamental analysis helps determine the market outlook, technical analysis is often used by traders to find entry and exit points.
Key principles like support and resistance levels, trend identification, and breakout strategies still apply in natural gas markets. However, price volatility may make some established technical strategies less effective. It’s key to test different indicators and patterns to find what works best.
Momentum indicators, such as the Stochastic indicator or Moving Average Convergence Divergence (MACD); trend tools, like the Average Directional Index (ADX) and moving averages; and volume-based tools, such as the VWAP and Fixed Range Volume Profile (FRVP), can all assist in analysing and trading natural gas CFDs.
In practice, a fundamental-first approach may look like a trader monitoring inventory reports, economic growth, and weather patterns to gain an idea of the market’s direction. They might then use technical analysis signals to time trades and find precise entry and exit points.
Sentiment and Positioning Analysis
Sentiment analysis involves gauging the overall market mood, which can significantly influence natural gas prices. While there is no single unified measure of natural gas trading sentiment, tools such as Investing.com’s Natural Gas Scoreboard can offer a quick look at how traders view the market. Market positioning can be identified using the Commitment of Traders (COT) report, which shows the positions of different market participants in natural gas futures contracts.
Generally speaking, bullish sentiment and positioning might drive prices up, while the opposite sentiment can push prices down. However, traders should also note that sentiment and positioning can indicate overreactions, creating opportunities for contrarian strategies.
Tools for Trading Natural Gas
There are several tools that traders can use to analyse and trade natural gas. For instance:
1. Trading Platforms
- TradingView: Offers comprehensive charting tools and real-time market data.
- MetaTrader 4/5: Provides advanced trading and analysis tools widely used by traders.
- TickTrader: FXOpen’s own TickTrader features an advanced charting platform with more than 1,200 trading tools.
You can trade at any of these platforms with FXOpen.
2. Inventory and Storage Reports
- EIA's Natural Gas Weekly Update: Offers comprehensive analysis of markets, including supply, demand, and price trends.
- EIA’s Natural Gas Weekly Storage Report: Features a snapshot of the US supply of natural gas across different regions.
3. Sentiment and Positioning
- CFTC's Commitments of Traders (COT) Report: Provides insights into market positioning by different trader categories.
- Investing.com’s Natural Gas Scoreboard: Indicates the bullish or bearish sentiment surrounding natural gas.
4. Market Reports
- American Gas Association (AGA) Reports: Provides detailed analysis and statistics on markets.
5. Weather Forecasts
- AccuWeather or Weather Underground: Accurate weather forecasts are essential as they significantly impact natural gas demand.
- National Oceanic and Atmospheric Administration (NOAA): Offers long-term climate predictions.
6. News Websites
- Bloomberg
- Reuters
- MarketWatch
- CNBC
7. News Aggregators and Economic Calendars
- Energy EXCH
- FinancialJuice
The Bottom Line
Trading natural gas can be an interesting endeavour with the right strategies and tools. By understanding market dynamics and leveraging advanced platforms, traders can navigate this volatile market effectively. Open an FXOpen account to access a robust trading platform and start trading natural gas CFDs today, maximising your trading potential with professional tools and support.
FAQs
Where Can I Trade Natural Gas?
You can trade natural gas through brokers that offer CFDs, such as FXOpen. These platforms allow you to speculate on live prices without owning the physical commodity. FXOpen provides a natural gas trading platform via TickTrader, known for its user-friendly interface and access to a wide range of trading tools and resources.
How to Trade Natural Gas?
Trading natural gas can be done through various methods, including CFDs, futures, options, and ETFs. CFDs are most popular for retail traders due to their lower capital requirements and leverage options.
How to Buy Natural Gas Futures?
To buy natural gas futures, you need to open an account with a broker that offers futures trading, such as CME Group. After funding your account, you can trade futures contracts, which are standardised agreements to buy or sell natural gas at a specific price on a future date.
This article represents the opinion of the Companies operating under the FXOpen brand only. It is not to be construed as an offer, solicitation, or recommendation with respect to products and services provided by the Companies operating under the FXOpen brand, nor is it to be considered financial advice.

Natural Gas Prices Reach Yearly HighsNatural Gas Prices Reach Yearly Highs
According to the XNG/USD chart, natural gas prices have risen by approximately 13% since early November and this week hit a new 2024 high.
Factors Driving Bullish Sentiment (as reported by Reuters):
→ A sharp increase in global gas prices.
→ Forecasts of colder weather and higher heating demand in the United States.
Will Natural Gas Prices Continue to Rise?
From a fundamental perspective, the Energy Information Administration (EIA) forecast on 13 November predicts natural gas prices could peak in January 2025.
From a technical analysis standpoint of the XNG/USD chart, the $3.200 level is a critical resistance, having previously triggered price reversals in October (B) and June (not shown on the chart). Price movements since early August have formed a trend channel (shown in blue).
Bullish Arguments:
→ The $2.7 level serves as support, aligned with Fibonacci retracement levels, as the B→C pullback is at 50% of the A→B rise.
→ The $2.93 level has flipped from resistance to support (indicated by arrows).
Bearish Arguments:
→ Prices reversed sharply downward earlier this week from the $3.200 level, showing seller activity.
→ Reports indicate utilities are injecting gas into storage at faster-than-expected rates, suggesting stockpiles could meet increased cold-weather demand.
Bulls may attempt to keep prices within the blue channel and make further attempts to breach the $3.200 level. However, XNG/USD signals show that bears are ready to push back.
This article represents the opinion of the Companies operating under the FXOpen brand only. It is not to be construed as an offer, solicitation, or recommendation with respect to products and services provided by the Companies operating under the FXOpen brand, nor is it to be considered financial advice.

Natural Gas | Oil | Dollar | Silver | Gold Price ForecastNatural Gas | Oil | Dollar | Silver | Gold Price Forecast
AMEX:USO Oil Stock Forecast
TVC:DXY US dollar Stock Forecast
Gold OANDA:XAUUSD Stock Forecast
Silver OANDA:XAGUSD

N-gas / Natural Gas CFD Market Money Heist Plan on Bullish SideHaaiii!! My Dear Robbers / Money Makers & Losers, 🤑 💰
This is our master plan to Heist N-gas / Natural Gas CFD Market based on Thief Trading style Technical Analysis.. kindly please follow the plan I have mentioned in the chart focus on Long entry. Our target is Red Zone that is High risk Dangerous level, market is overbought / Consolidation / Trend Reversal / Trap at the level Bearish Robbers / Traders gain the strength. Be safe and be careful and Be rich.
Entry : Can be taken Anywhere, What I suggest you to Place Buy Limit Orders in 15mins Timeframe Recent / Nearest Low Point.
Stop Loss 🛑 : Recent Swing Low using 2h timeframe
Attention for Scalpers : If you've got a lot of money you can get out right away otherwise you can join with a swing trade robbers and continue the heist plan, Use Trailing SL to protect our money 💰.
Warning : Fundamental Analysis news 📰 🗞️ comes against our robbery plan. our plan will be ruined smash the Stop Loss. Don't Enter the market at the news update.
Loot and escape on the target 🎯 Swing Traders Plz Book the partial sum of money and wait for next breakout of dynamic level / Order block, Once it is cleared we can continue our heist plan to next new target.
Support our Robbery plan we can easily make money & take money 💰💵 Follow, Like & Share with your friends and Lovers. Make our Robbery Team Very Strong Join Ur hands with US. Loot Everything in this market everyday make money easily with Thief Trading Style.
Stay tuned with me and see you again with another Heist Plan..... 🫂

Natural Gas Oil, Dollar, Silver, Gold Price ForecastNatural Gas stock Bulls
Gold OANDA:XAUUSD Stock Forecast
Silver OANDA:XAGUSD
