U.S. NATURAL GAS - BEARISH DIVERGENCE DETECTED
U.S. NATURAL GAS - BEARISH DIVERGENCE DETECTED🕵🏻♂️
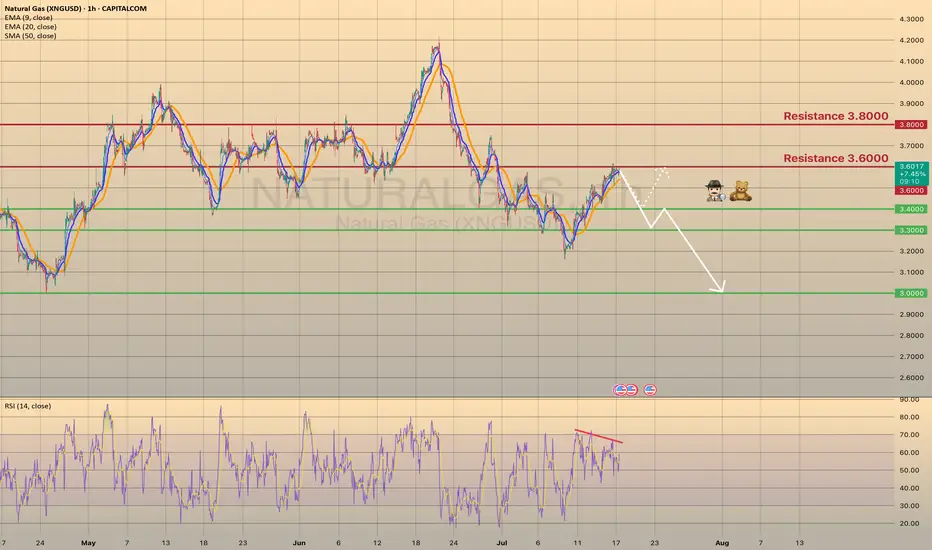
The Natural gas has been trading bullish for 7 days in a row since last Wednesday, reaching the 3.6000 resistance level. Primarily this happened due to a warm weather in the U.S. states, that supports the demand on gas. Despite warmer-than-normal summer weather, analysts expect energy firms to inject more gas into storage than usual in coming weeks. Record-high output in June, likely to be surpassed in July, and reduced gas flows to LNG export plants since April's peak, support this trend.
Technically chart shows us a bearish divergence on 1-h timeframe. I suppose the price to slowly decline towards major support level of 3.0000 with minor rebounds. The 2nd option is the rebound from 3.4000 support level with a first target of 3.6000.
Naturalgasshort
Natural Gas Short Term Sell IdeaH4 - Bearish divergence
Most recent uptrend line breakout
H1 - Bearish trend pattern followed by a pullback
Until the two strong resistance zones hold my short term view remains bearish here.

2023 Tradingdesk for Natural gasFrom now i will have one main idea, and all the ideas as we reach cycle targets for the year will be updated in the thread.
I dont trade short term, keep in mind my ideas are longer term, and its boring.
We wait for the cycles to bottom and we wait once in the trade for the trade to mature.
Fallow, like so you dont miss the updates.

$NGAS - HOW WILL EUROPE REACT? DOWNTREND STRONG.$NGAS - HOW WILL EUROPE REACT?
DOWNTREND STRONG....
Gas price is coming home.
$3.00 is not too far away.
But how will the European government react?
It seems like they want to keep the consumer price high.
#NaturalGas

Natural gas: head and shoulders top pattern; $5 in sight?US natural gas prices have formed a head and shoulders top pattern, which may signal a weakening of the current major bullish trend and a subsequent reversal into a bearish one.
The left shoulder coincided with the relative highs at the end of July at $9.30/MMbtu, a level that was then followed by a pullback to $7.53 (August 8) prior to the beginning of a new rally toward the head at nearly $10.
The right shoulder was formed by the decline from $9.97 to $7.80, followed by a brief rebound at $9.22 and another decline to the current $7.86.
Although a brief breakdown was seen in the September 19 session, natural gas is now testing the neckline of the head and shoulders pattern. If confirmed, we could see a return to the level of $5.30, which were hit in early July 2022.
Additional bearish technical signals for the price of US natural gas include the MACD oscillator dipping below the zero line and the RSI slightly pointing south.
Idea written by Piero Cingari, forex and commodity analyst at Capital.com


NATURAL GAS LONGS 📉📉Expecting bullish price action on NATURAL GAS after the gap fill, i think price will go higher to fill the bearish imbalances.
What do you think ? Comment below..

NATURALGAS SHORTS 📉📉📉📉 Expecting bearish price action on NATURALGAS, and we could try to short a market top on this area. We have a lot of bullish imbalances on the NATURALGAS that has to be filled into the incoming week. Also we had a big expansion move and the price should make the retracement move from there.
RSI is overbought in this area meaning the price is very expensive.
What do you think ? Comment below..

Short on breakShort on break - 1H close below trendline
Price Targets
3.980 - previous gap fill zone
3.536 - to reach this point is very optimistic lol
Alternatively, we can look for a bounce from trendline, same as what was posted in the IDEAS section
Prices and trendline drawn based on Natural Gas Continuous Futures listed on NYMEX, prices may differ from your broker

Gas waits for decreaseHi everyone! In the idea of June 30 I waited for the beginning of reduction of price of gas. However, the price rose by new height. Despite this, my opinion did not change and I consider that gas is close to a turn. Technical indicators, including CCI point to it.
TP1 = 3.539
TP2 = 3.046
Information provided is only educational and should not be used to take action in the market.

Natural GAS short: section fast transactionsHi everyone! The natural gas price reached trend lines and now technical indicators point out overbought. Therefore I expect the movement down to level 1.618 according to Fibonacci.
Sold on 2.609
TP = 2.415
Information provided is only educational and should not be used to take action in the market.
This section is intended for short-term speculation. Be ready to leave a position at any time.

NATURAL GAS SWING OPPORTUNITY Price is moving inside a Falling wedge, generally we will buy after a breakout of the falling wedge


Natural Gas Big Bear DumpMarket already on the move, structure a clear bear channel that has already broken, more dump to follow.
Trade at your own risk, analysis based on technicals only.

Natural Gas (Weekly) SHORT. SELL in Bearish SHARK PRZWeekly (long term) sale!
Target range: $2.30-$2.15

Natural gas regular divergence, Short order
Regular divergence
Overbought
R1 Pivot
Short order at R1

NATURAL GAS FUTURES (NG1!) DailyDates in the future with the greatest probability for a price high or price low.
The Djinn Predictive Indicators are simple mathematical equations. Once an equation is given to Siri the algorithm provides the future price swing date. Djinn Indicators work on all charts, for any asset category and in all time frames. Occasionally a Djinn Predictive Indicator will miss its prediction date by one candlestick. If multiple Djinn prediction dates are missed and are plowed through by same color Henikin Ashi candles the asset is being "reset". The "reset" is complete when Henikin Ashi candles are back in sync with Djinn price high or low prediction dates.
One way the Djinn Indicator is used to enter and exit trades:
For best results trade in the direction of the trend.
The Linear Regression channel is used to determine trend direction. The Linear Regression is set at 2 -2 30.
When a green Henikin Ashi candle intersects with the linear regression upper deviation line (green line) and both indicators intersect with a Djinn prediction date a sell is triggered.
When a red Henikin Ashi candle intersects with the linear regression lower deviation line (red line) and both indicators intersect with a Djinn prediction date a buy is triggered.
This trading strategy works on daily, weekly and Monthly Djinn Predictive charts.
This is not trading advice. Trade at your own risk.

NATURAL GAS FUTURES (NG1!) WeeklyDates in the future with the greatest probability for a price high or price low.
The Djinn Predictive Indicators are simple mathematical equations. Once an equation is given to Siri the algorithm provides the future price swing date. Djinn Indicators work on all charts, for any asset category and in all time frames. Occasionally a Djinn Predictive Indicator will miss its prediction date by one candlestick. If multiple Djinn prediction dates are missed and are plowed through by same color Henikin Ashi candles the asset is being "reset". The "reset" is complete when Henikin Ashi candles are back in sync with Djinn price high or low prediction dates.
One way the Djinn Indicator is used to enter and exit trades:
For best results trade in the direction of the trend.
The Linear Regression channel is used to determine trend direction. The Linear Regression is set at 2 -2 30.
When a green Henikin Ashi candle intersects with the linear regression upper deviation line (green line) and both indicators intersect with a Djinn prediction date a sell is triggered.
When a red Henikin Ashi candle intersects with the linear regression lower deviation line (red line) and both indicators intersect with a Djinn prediction date a buy is triggered.
This trading strategy works on daily, weekly and Monthly Djinn Predictive charts.
This is not trading advice. Trade at your own risk.

NATURAL GAS FUTURES (NG1!) MonthlyDates in the future with the greatest probability for a price high or price low.
The Djinn Predictive Indicators are simple mathematical equations. Once an equation is given to Siri the algorithm provides the future price swing date. Djinn Indicators work on all charts, for any asset category and in all time frames. Occasionally a Djinn Predictive Indicator will miss its prediction date by one candlestick. If multiple Djinn prediction dates are missed and are plowed through by same color Henikin Ashi candles the asset is being "reset". The "reset" is complete when Henikin Ashi candles are back in sync with Djinn price high or low prediction dates.
One way the Djinn Indicator is used to enter and exit trades:
For best results trade in the direction of the trend.
The Linear Regression channel is used to determine trend direction. The Linear Regression is set at 2 -2 30.
When a green Henikin Ashi candle intersects with the linear regression upper deviation line (green line) and both indicators intersect with a Djinn prediction date a sell is triggered.
When a red Henikin Ashi candle intersects with the linear regression lower deviation line (red line) and both indicators intersect with a Djinn prediction date a buy is triggered.
This trading strategy works on daily, weekly and Monthly Djinn Predictive charts.
This is not trading advice. Trade at your own risk.

NATURAL GAS FUTURES (NG1!) DailyDates in the future with the highest probability for price direction reversals

Natural Gas depleting bullish chanceWith news about NatGas weather saying that mild temperatures were expected these past days and being correct, Natural Gas is behaving inside a bearish triangle decreasing its three consecutive maximums and depleting a bullish chance that has until Feb 7 to occur. But it might certainly be tomorrow when the fossile commodity decides to either break 1.931 resistance towards 2.08 or destroy 1.87 support and go towards 1.611, a historical minimum.

NatGas Negative divergence and possible double-top on 4H!Going back to 2.375 by the end of next week if warmer weather and NatGas Storage numbers are supportive...

Natural Gas - Weak bearish w/ bullish anticipation by Mid NovI am counting on a price surge for natural gas as winter is coming (not a Game of Thrones reference I swear). To think the demand for gas to heat up homes during colder season is not a far off assumption. It is October and probability is natural gas would surge up by mid-November, the soonest. Right now, I am still bearish due to technical chart reasons. There are levels I marked (mentally) that if price have established itself trading above it, then I will be more than happy to shift my bias.
