Natural Gas Prices Fall to Yearly LowNatural Gas Prices Fall to Yearly Low
Analysing the chart on 22 July, we constructed a descending channel and assumed that natural gas prices would continue to form a bearish market structure of lower highs and lower lows. Since then, the market has declined by almost 10%.
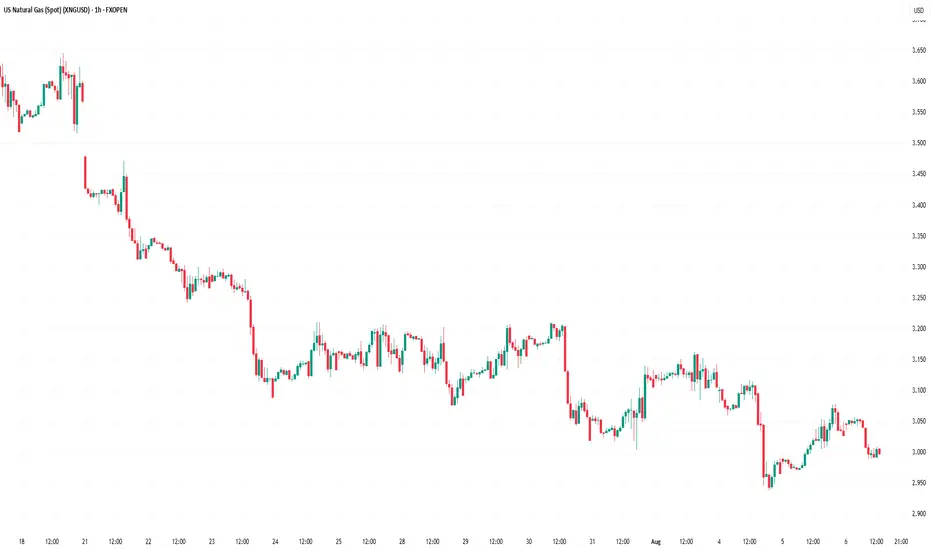
As the XNG/USD chart shows today, natural gas prices are hovering around the psychological level of $3.000/MMBtu. Earlier this week, gas was trading around $2.940/MMBtu — the lowest level of 2025.
According to media reports, the price decline is driven by both high production levels and favourable weather forecasts for August, the hottest month of the year. What might happen next?
Technical Analysis of the XNG/USD Chart
We have updated the descending channel, taking into account the recent fluctuations in natural gas prices.
The chart shows that bearish momentum remains intact — the rise from point B to C appears to be a corrective rebound within the prevailing downward trend, with the following developments:
→ point C formed in the 0.5–0.618 area, which corresponds to classic Fibonacci retracement levels following the A→B impulse;
→ the former support at 0.365 has now become resistance.
Bulls may hope that the current sentiment could shift following tomorrow’s natural gas storage report (scheduled for 17:30 GMT+3). A drop in inventories could potentially trigger a bullish impulse on the XNG/USD chart.
This article represents the opinion of the Companies operating under the FXOpen brand only. It is not to be construed as an offer, solicitation, or recommendation with respect to products and services provided by the Companies operating under the FXOpen brand, nor is it to be considered financial advice.
Naturalgastrading
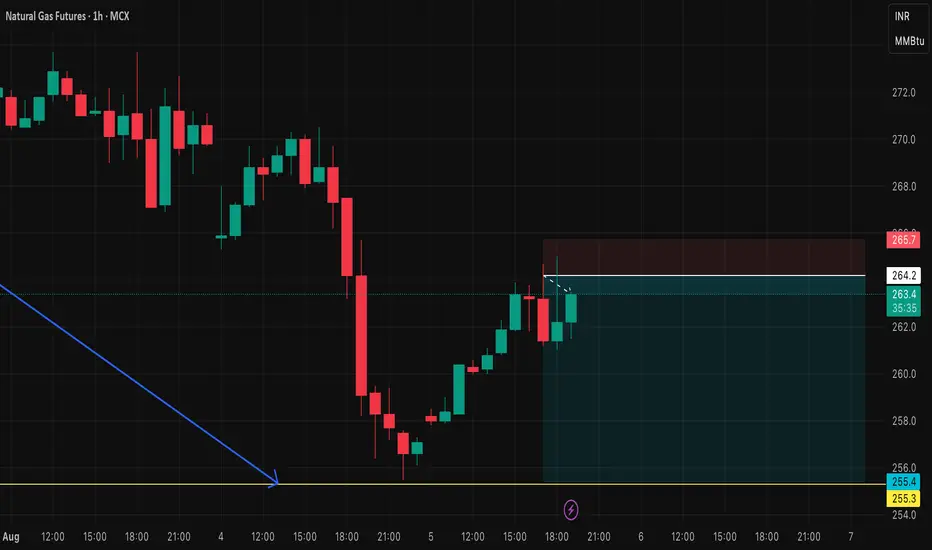
NF FUT short setupNG FUT short setup
Entry price - 264.2
Stop loss - 265.7
Target - 255.5
Risk Reward - 1:5.6
Natural Gas Price Drops by 7%Natural Gas Price Drops by 7%
As the XNG/USD chart shows today, natural gas is trading around $3.333/MMBtu, although yesterday morning the price was approximately 7% higher.
According to Reuters, the decline in gas prices is driven by:
→ Record-high production levels. LSEG reported that average gas output in the Lower 48 rose to 107.2 billion cubic feet per day so far in July, surpassing the previous monthly record of 106.4 billion cubic feet per day set in June.
→ Favourable weather forecasts. Although the peak of summer heat is still anticipated, forecasts indicate that temperatures over the next two weeks may be lower than previously expected.
As a result, today’s XNG/USD chart appears bearish.
Technical Analysis of the XNG/USD Chart
The chart indicates that since mid-May, natural gas prices have been fluctuating within a descending channel (marked in red), with July’s peak (E) highlighting the upper boundary of the pattern.
A key resistance area is now represented by a bearish gap, formed between:
→ the former support level at $3.525;
→ the $3.470 level – which, as the arrow suggests, is already showing signs of acting as resistance.
Under these conditions, it is reasonable to assume that the price may continue forming a downward market structure A-B-C-D-E, consisting of lower highs and lows, potentially moving towards the channel’s median – which approximately corresponds to July’s low (around the $3.200 level).
This article represents the opinion of the Companies operating under the FXOpen brand only. It is not to be construed as an offer, solicitation, or recommendation with respect to products and services provided by the Companies operating under the FXOpen brand, nor is it to be considered financial advice.

Natural Gas Prices on the RiseNatural Gas Prices on the Rise
As shown on the XNG/USD chart today, natural gas prices are trading around $3.960 per MMBtu — the highest level in over a month. This week’s series of bullish candles confirms strong demand.
Natural gas is becoming more expensive due to concerns over the military conflict between Iran and Israel. According to media reports:
→ Israel has attacked Iran’s South Pars gas field, and Donald Trump has called for the evacuation of Tehran.
→ Market participants fear that a blockade of the Strait of Hormuz could disrupt oil and natural gas supply chains.
In addition, forecasts of extreme heat in the US and increased demand for gas-powered air conditioning are also pushing prices higher.
Technical Analysis of the XNG/USD Chart
The chart shows that since mid-May, natural gas price movements have formed a narrowing triangle, suggesting a temporary balance between supply and demand.
However, the triangle has been broken to the upside — a sign of demand strength — with the price:
→ breaking through resistance at $3.800 per MMBtu;
→ forming the outlines of an ascending channel (shown in blue).
The following factors could act as resistance to the current upward move in natural gas prices:
→ the upper boundary of the channel;
→ the psychological level of $4.000 per MMBtu, near the May peak.
However, given that the hottest months of summer lie ahead and the situation in the Middle East remains highly volatile, it is reasonable to assume that the upward trend may continue.
This article represents the opinion of the Companies operating under the FXOpen brand only. It is not to be construed as an offer, solicitation, or recommendation with respect to products and services provided by the Companies operating under the FXOpen brand, nor is it to be considered financial advice.

"XNG/USD Natural Gas" Energy Market Heist Plan (Scalping/Day)🌟Hi! Hola! Ola! Bonjour! Hallo! Marhaba!🌟
Dear Money Makers & Robbers, 🤑 💰💸✈️
Based on 🔥Thief Trading style technical and fundamental analysis🔥, here is our master plan to heist the "XNG/USD Natural Gas" Energy Market. Please adhere to the strategy I've outlined in the chart, which emphasizes long entry. Our aim is to escape near the high-risk ATR Zone. Risky level, overbought market, consolidation, trend reversal, trap at the level where traders and bearish robbers are stronger. 🏆💸"Take profit and treat yourself, traders. You deserve it!💪🏆🎉
Entry 📈 : "The vault is wide open! Swipe the Bearish loot at any price - the heist is on!
however I advise to Place sell limit orders within a 15 or 30 minute timeframe most nearest or swing, low or high level for Pullback Entries.
Stop Loss 🛑:
📌Thief SL placed at the nearest/swing High or Low level Using the 2h timeframe (3.800) Day/Scalping trade basis.
📌SL is based on your risk of the trade, lot size and how many multiple orders you have to take.
🏴☠️Target 🎯: 3.200
🧲Scalpers, take note 👀 : only scalp on the Long side. If you have a lot of money, you can go straight away; if not, you can join swing traders and carry out the robbery plan. Use trailing SL to safeguard your money 💰.
⛽💨"XNG/USD Natural Gas" Energy Market Heist Plan (Scalping/Day) is currently experiencing a bullishness,., driven by several key factors. 👇👇👇
📰🗞️Get & Read the Fundamental, Macro Economics, COT Report, Inventory and Storage Analysis, Seasonal Factors, Sentimental Outlook, Intermarket Analysis, Future trend targets & Overall Outlook Score... go ahead to check 👉👉👉🔗🔗
⚠️Trading Alert : News Releases and Position Management 📰 🗞️ 🚫🚏
As a reminder, news releases can have a significant impact on market prices and volatility. To minimize potential losses and protect your running positions,
we recommend the following:
Avoid taking new trades during news releases
Use trailing stop-loss orders to protect your running positions and lock in profits
💖Supporting our robbery plan 💥Hit the Boost Button💥 will enable us to effortlessly make and steal money 💰💵. Boost the strength of our robbery team. Every day in this market make money with ease by using the Thief Trading Style.🏆💪🤝❤️🎉🚀
I'll see you soon with another heist plan, so stay tuned 🤑🐱👤🤗🤩

How Can You Trade Energy Commodities?How Can You Trade Energy Commodities?
Energy trading connects global markets to the vital resources that power economies—oil and natural gas. These commodities aren’t just essential for industries and homes; they’re also dynamic assets for traders, influenced by geopolitics, supply, and demand.
Whether you’re exploring benchmarks like Brent Crude and WTI or understanding natural gas markets, this article unpacks the essentials of energy commodities and how to trade them.
What Is Energy Trading?
Energy trading involves buying and selling energy resources that power industries and households worldwide. These commodities are essential for modern life and are traded in global markets both as physical products and financial instruments.
Energy commodities include resources like oil, natural gas, gasoline, coal, ethanol, uranium, and more. In this article, we’ll focus on the two that traders interact with the most: oil and natural gas.
Oil is often divided into benchmarks like Brent Crude and WTI, which set global and regional pricing standards. These benchmarks represent crude oil that varies in quality and origin, impacting its trade and refining applications.
Natural gas, on the other hand, plays a critical role in electricity generation, heating, and industrial processes. It’s traded in various forms, including pipeline gas and liquefied natural gas (LNG), offering flexibility in transportation and supply.
What makes energy commodities unique is their global demand and sensitivity to external factors. Weather patterns, geopolitical developments, and economic activity all heavily influence their prices. For traders, this creates a dynamic market with potential opportunities to take advantage of price movements.
Additionally, energy commodities can act as economic indicators. A surge in oil prices, for example, might reflect growing demand from expanding industries, while a drop could indicate reduced consumption. Understanding these resources isn’t just about their practical use—it’s about grasping their role in shaping global markets and financial systems.
Oil: Brent Crude vs WTI
Brent Crude and WTI (West Texas Intermediate) are the world’s two leading oil benchmarks, shaping prices for a resource critical to industries and economies. Despite both being types of crude oil, they differ significantly in origin, quality, and market influence.
Brent Crude
Brent Crude is a globally recognised benchmark for oil pricing, primarily sourced from fields in the North Sea. Its importance lies in its role as a pricing reference for about two-thirds of the world’s oil supply. What makes Brent unique is its lighter and sweeter quality, meaning it has lower sulphur content and is easier to refine into fuels like petrol and diesel.
This benchmark is particularly significant in European, African, and Asian markets, where it serves as a key indicator of global oil prices. Its value is heavily influenced by international demand, geopolitical events, and production levels in major exporting countries. For traders, Brent offers a window into global supply and demand trends, making it a critical component of energy markets.
West Texas Intermediate (WTI)
WTI, or West Texas Intermediate, is the benchmark for oil produced in the United States. Extracted primarily from Texas and surrounding regions, WTI is even lighter and sweeter than Brent, making it suitable for refining into high-value products like petrol.
WTI’s pricing is heavily tied to North American markets, with its hub in Cushing, Oklahoma, a key point for storage and distribution. Localised factors, like US production rates and storage capacity, often create price differentials between WTI and Brent, with Brent typically trading at a premium. For example, logistical bottlenecks in the US can drive WTI prices lower.
The main distinction between the two lies in their geographical focus: while Brent captures the international market’s pulse, WTI provides insights into North American energy dynamics. Together, they form the foundation of global oil pricing.
Natural Gas: A Growing Energy Commodity
Natural gas is a cornerstone of the global energy market, valued for its versatility and role in powering economies. It’s used extensively for electricity generation, heating, and industrial processes, with demand continuing to rise as countries seek cleaner alternatives to coal and oil.
This energy commodity comes in two primary forms for trade: pipeline natural gas and liquefied natural gas (LNG). Pipeline gas is delivered directly via extensive networks, making it dominant in regions like North America and Europe.
LNG, on the other hand, is supercooled to a liquid state for transportation across oceans, opening up markets that lack pipeline infrastructure. LNG trade has grown rapidly in recent years, with key suppliers like Qatar, Australia, and the US meeting surging demand in Asia.
Pricing for natural gas varies regionally, with hubs like Henry Hub in the US and the National Balancing Point (NBP) in the UK serving as benchmarks. These hubs reflect regional dynamics, such as weather conditions, storage levels, and local supply disruptions.
Natural gas prices are also closely tied to broader geopolitical and economic factors. For example, harsh winters often drive up heating demand, while conflicts or sanctions affecting major producers can create supply constraints. This volatility makes natural gas an active and highly watched market for traders, offering potential opportunities tied to shifting global conditions.
Price Factors of Energy Commodities
Energy commodity prices are influenced by a mix of global events, market fundamentals, and local factors. Here’s a breakdown of key elements driving oil and gas trading prices:
- Supply and Production Levels: Output from major producers like OPEC nations, the US, and Russia has a direct impact on prices. Supply cuts or surges can quickly move markets.
- Geopolitical Events: Conflicts, sanctions, or political instability in oil and gas-rich regions often disrupt supply chains, creating volatility.
- Weather and Seasonal Demand: Cold winters boost natural gas demand for heating, while summer driving seasons often increase oil consumption. Extreme weather events, such as hurricanes, can also damage infrastructure and reduce supply.
- Economic Growth: Expanding economies typically consume more energy, driving demand and prices higher. Conversely, a slowdown or recession can weaken demand.
- Storage Levels: Inventories act as a cushion against supply disruptions. Low storage levels often signal tighter markets, pushing prices up.
- Transportation Costs: The cost of shipping oil or LNG across regions impacts pricing, particularly for seaborne commodities like Brent Crude and LNG.
- Exchange Rates: Energy commodities are usually priced in dollars, meaning currency fluctuations can affect affordability in non-dollar markets.
- Market Sentiment: Traders’ expectations, shaped by reports like US inventory data or OPEC forecasts, can influence short-term price movements.
How to Trade Energy Commodities
Trading energy commodities like oil and natural gas involves navigating dynamic markets with the right tools, strategies, and risk awareness. Here’s a breakdown of how traders typically approach energy commodity trading:
Instruments for Energy Trading
Energy commodities can be traded through various instruments, typically through an oil and gas trading platform. For instance, FXOpen provides access to oil and gas CFDs alongside 700+ other markets, including currency pairs, stocks, ETFs, and more.
- CFDs (Contracts for Difference): Popular among retail traders because they allow access to global energy markets without owning the physical assets. They offer leverage and provide flexibility to take advantage of both rising and falling prices. Additionally, CFDs have lower entry costs, no expiration dates, and eliminate concerns like storage or delivery logistics. Please remember that leverage trading increases risks.
- Futures: These are contracts to buy or sell commodities at a future date. While they provide leverage and flexibility, trading energy derivatives like futures is often unnecessarily complex for the average retail trader.
- ETFs (Exchange-Traded Funds): Energy ETFs diversify exposure to energy commodities or related sectors.
- Energy Stocks: Shares in oil and gas companies provide indirect exposure to commodity price changes.
Analysis: Fundamental and Technical
Energy traders rely on two primary types of analysis:
- Fundamental Analysis: Examines supply and demand factors like OPEC decisions, weather patterns, geopolitical tensions, and economic indicators such as GDP growth or industrial output.
- Technical Analysis: Focuses on price charts, identifying patterns, trends, and important levels to anticipate potential market movements.
Combining these approaches can offer a broader perspective, helping traders refine their strategies.
Taking a Position and Managing Risk
Once traders identify potential opportunities, they decide on position size and duration based on their analysis. Risk management is critical to help traders potentially mitigate losses in these volatile markets. Strategies often include:
- Diversifying positions to reduce exposure to a single commodity.
- Setting limits on position sizes to align with overall portfolio risk.
- Monitoring leverage carefully, as it can amplify both potential returns and losses.
Risk Factors in Energy Commodities Trading
Trading energy commodities like oil and natural gas offer potential opportunities, but it also comes with significant risks due to the market's volatility and global nature.
- Price Volatility: Energy markets are highly sensitive to geopolitical events, economic shifts, and supply disruptions. This can lead to rapid price swings, particularly if the event is unexpected.
- Leverage Risks: Many instruments, like CFDs and futures, allow traders to use leverage, amplifying both potential returns and losses. Mismanaging leverage can lead to significant setbacks.
- Geopolitical Uncertainty: Events like conflicts in oil-producing regions or trade sanctions can disrupt supply chains and sharply impact prices.
- Market Sentiment: Energy prices can react strongly to reports like inventory data, OPEC announcements, or unexpected news, creating rapid shifts in sentiment and price direction.
- Overexposure: Focusing too heavily on a single energy commodity can magnify losses if the market moves against the position.
- Economic Factors: Slowing industrial activity or recession fears can reduce demand for energy, putting downward pressure on prices.
The Bottom Line
Energy commodities trading offers potential opportunities, driven by global demand and supply. Whether focusing on oil, natural gas, or other energy assets, understanding the fundamentals and risks is key to navigating this complex market. Ready to explore oil and gas commodity trading via CFDs? Open an FXOpen account to access advanced tools, competitive spreads, low commissions, and four trading platforms designed to support your journey.
FAQ
What Are Energy Commodities?
Energy commodities are natural resources used to power industries, homes, and transportation. Key examples include crude oil, natural gas, and coal. These commodities are traded globally as physical assets or through financial instruments like futures and CFDs.
Can I Make Money Trading Commodities?
Trading commodities offers potential opportunities to take advantage of price movements, but it also involves significant risks. The effectiveness of your trades depends on understanding of market dynamics, analyses of supply and demand, and risk management. While some traders achieve returns, losses are also common, especially in volatile markets like energy.
How Do I Start Investing in Energy?
Investing in energy typically begins with choosing an instrument like ETFs or stocks, depending on your goals and risk tolerance. Researching market fundamentals, monitoring geopolitical and economic factors, and practising sound risk management are essential steps for new investors.
What Is an Energy Trading Platform?
An energy trading platform, or power trading platform, is software that enables traders to buy and sell energy commodities. These energy trading solutions provide access to pricing data, charting tools, and news feeds, helping traders analyse markets and execute trades efficiently.
Trade on TradingView with FXOpen. Consider opening an account and access over 700 markets with tight spreads from 0.0 pips and low commissions from $1.50 per lot.
This article represents the opinion of the Companies operating under the FXOpen brand only. It is not to be construed as an offer, solicitation, or recommendation with respect to products and services provided by the Companies operating under the FXOpen brand, nor is it to be considered financial advice.

NATURAL GAS: Channel Down bottomed and is rebounding to 4.800Natural Gas is neutral on its 1D technical outlook (RSI = 47.119, MACD = -0.072, ADX = 39.523) as the bearish wave of the long term Channel Up found support on its bottom and the 1D MA100 and is rebounding. It hasn't yet crossed over the 1D MA50 but when it does the bullish signal will be validated. On any occassion, last time the 1D RSI rebounded near this level, it was on the October 18th and August 27th 2024 lows. Both later rebounded by at least +60.48%. We aim for a similar target (TP = 4.800).
See how our prior idea has worked out:
## If you like our free content follow our profile to get more daily ideas. ##
## Comments and likes are greatly appreciated. ##

XNG/USD "Natural Gas" Energy Market Bearish Heist Plan🌟Hi! Hola! Ola! Bonjour! Hallo!🌟
Dear Money Makers & Robbers, 🤑 💰
Based on 🔥Thief Trading style technical and fundamental analysis🔥, here is our master plan to heist the XNG/USD "Natural Gas" Energy Metal market. Please adhere to the strategy I've outlined in the chart, which emphasizes short entry. Our aim is the high-risk Green Zone. Risky level, oversold market, consolidation, trend reversal, trap at the level where traders and bullish robbers are stronger. 👀 Be wealthy and safe trade.💪🏆🎉
Entry 📉 : Traders & Thieves with New Entry A Bear trade can be initiated at any price level.
however I advise placing sell limit orders within a 15 or 30 minute timeframe. Entry from the most recent or closest high level should be in retest.
Stop Loss 🛑: Using the 4h period, the recent / nearest high level
Goal 🎯: 2.950 (or) Before escape in the market
Scalpers, take note : only scalp on the Short side. If you have a lot of money, you can go straight away; if not, you can join swing traders and carry out the robbery plan. Use trailing SL to safeguard your money 💰.
📰🗞️Fundamental, Macro, Sentimental Outlook:
The XNG/USD "Natural Gas" Energy market is expected to move in a bearish direction, driven by several key factors.
Based on current market conditions, the XNG/USD Natural Gas market is expected to move in a Bearish direction.
🔆Fundamental Factors:
-Supply and Demand Balance: The natural gas market is expected to move into a supply surplus, driven by increasing production and decreasing demand.
-US Natural Gas Production: US natural gas production is expected to increase, putting downward pressure on prices.
-LNG Export Capacity: Increasing LNG export capacity from the US is expected to put downward pressure on natural gas prices.
🔆Macroeconomic Factors:
-Mild Winter Weather: Warmer-than-expected winter weather in the US is expected to decrease demand for natural gas, putting downward pressure on prices.
-Global Economic Slowdown: Slowing global economic growth, particularly in China, is expected to decrease demand for natural gas.
-US Dollar Strength: A stronger US dollar is expected to put downward pressure on natural gas prices, making them more expensive in international markets.
🔆Trader/Market Sentimental Analysis:
-Trader Sentiment: The CoT report shows that speculative traders are net short natural gas, indicating a bearish sentiment.
-Market Sentiment: The market sentiment is bearish, with many analysts expecting natural gas prices to decline due to the supply and demand balance.
-Technical Analysis: The technical analysis shows that natural gas is in a downtrend, with a bearish breakdown below the $3.00 level.
🔆Sentimental Outlook:
Bearish Sentiment: 65%
Bullish Sentiment: 20%
Neutral Sentiment: 15%
🔆Overall, the bearish outlook is driven by a combination of macroeconomic and fundamental factors, with a 60% chance of a bearish move, 20% chance of a bullish move, and 20% chance of a neutral move.
⚠️Trading Alert : News Releases and Position Management 📰 🗞️ 🚫🚏
As a reminder, news releases can have a significant impact on market prices and volatility. To minimize potential losses and protect your running positions,
we recommend the following:
Avoid taking new trades during news releases
Use trailing stop-loss orders to protect your running positions and lock in profits
🚨Please note that this is a general analysis and not personalized investment advice. It's essential to consider your own risk tolerance and market analysis before making any investment decisions.
🚨Keep in mind that these factors can change rapidly, and it's essential to stay up-to-date with market developments and adjust your analysis accordingly.
💖Supporting our robbery plan will enable us to effortlessly make and steal money 💰💵 Tell your friends, Colleagues and family to follow, like, and share. Boost the strength of our robbery team. Every day in this market make money with ease by using the Thief Trading Style.🏆💪🤝❤️🎉🚀
I'll see you soon with another heist plan, so stay tuned 🫂

XNG/USD "Natural Gas" Energy Market Heist Plan🌟Hi! Hola! Ola! Bonjour! Hallo!🌟
Dear Money Makers & Robbers, 🤑 💰
Based on 🔥Thief Trading style technical and fundamental analysis🔥, here is our master plan to heist the XNG/USD "Natural Gas" Energy Market market. Please adhere to the strategy I've outlined in the chart, which emphasizes long & Short entry. 👀 Be wealthy and safe trade 💪🏆🎉
Entry 📈 : "The loot's within reach! Wait for the breakout, then grab your share - whether you're a Bullish thief or a Bearish bandit!"
Buy entry above 3.500
Sell Entry below 3.000
Stop Loss 🛑: Using the 1H period, the recent / nearest Pullbacks.
Target 🎯:
-Bullish Robbers TP 4.000 (or) Escape Before the Target
-Bearish Robbers TP 2.600 (or) Escape Before the Target
📰🗞️Fundamental, Macro, COT, Sentimental Outlook:
The XNG/USD "Natural Gas" Energy Market market is currently experiencing a bullish trend,., driven by several key factors.
🔆 Fundamental Factors
- Supply and Demand Imbalance: The global demand for natural gas is outpacing supply, leading to a surge in prices.
- Weather Patterns: Colder-than-expected winter weather in the Northern Hemisphere is driving up demand for heating fuels, including natural gas.
🔆 Macroeconomic Factors
- Global Economic Trends: The global economy is experiencing a slowdown, but the energy sector remains resilient due to strong demand for natural gas.
- Inflation Rates: Rising inflation rates are driving up the cost of living, but the impact on the XNG/USD pair is currently neutral.
🔆 COT Report
- Speculative Positions: Speculative traders are net long on the XNG/USD pair, indicating a bullish sentiment.
- Commercial Traders: Commercial traders are net short on the pair, indicating a bearish sentiment.
🔆 Market Sentiment and Positioning
- Client Sentiment: 60% of client accounts are long on this market, indicating a bullish sentiment.
- Market Positioning: The XNG/USD pair is currently overbought, with a possibility of a price correction.
🔆 Conclusion:
The sentimental outlook for XNG/USD is mixed, with varying degrees of bullishness and bearishness among institutional investors, large banks, investment companies, and retail traders. While some market participants are optimistic about natural gas prices due to rising demand and supply constraints, others are cautious due to mild winter weather and increased production.
🔆 Prediction and Overall Outlook
- Based on the analysis, the XNG/USD pair is expected to move in a bullish trend, with a 65% probability of reaching $4.50 in the short term. However, there is a 35% chance of a price correction to $3.80 due to overbought conditions.
⚠️Trading Alert : News Releases and Position Management 📰 🗞️ 🚫🚏
As a reminder, news releases can have a significant impact on market prices and volatility. To minimize potential losses and protect your running positions,
we recommend the following:
Avoid taking new trades during news releases
Use trailing stop-loss orders to protect your running positions and lock in profits
📌Please note that this is a general analysis and not personalized investment advice. It's essential to consider your own risk tolerance and market analysis before making any investment decisions.
📌Keep in mind that these factors can change rapidly, and it's essential to stay up-to-date with market developments and adjust your analysis accordingly.
💖Supporting our robbery plan will enable us to effortlessly make and steal money 💰💵 Tell your friends, Colleagues and family to follow, like, and share. Boost the strength of our robbery team. Every day in this market make money with ease by using the Thief Trading Style.🏆💪🤝❤️🎉🚀
I'll see you soon with another heist plan, so stay tuned 🫂

"NATURAL GAS" Commodities Market Bullish Heist PlanHello!! My Dear Robbers / Money Makers & Losers, 🤑 💰
This is our master plan to Heist "NATURAL GAS" Commodities Market based on Thief Trading style Technical Analysis.. kindly please follow the plan I have mentioned in the chart focus on Long entry. Our target is Red Zone that is High risk Dangerous level, market is overbought / Consolidation / Trend Reversal / Trap at the level Bearish Robbers / Traders gain the strength. Be safe and be careful and Be rich.
Entry 📈 : Can be taken Anywhere, What I suggest you to Place Buy Limit Orders in 15mins Timeframe Recent / Nearest Low Point take entry should be in pullback.
Stop Loss 🛑 : Recent Swing Low using 2H timeframe
Target 🎯 : 3500.0
Attention for Scalpers : Focus to scalp only on Long side, If you've got a lot of money you can get out right away otherwise you can join with a swing trade robbers and continue the heist plan, Use Trailing SL to protect our money 💰.
Warning : Fundamental Analysis news 📰 🗞️ comes against our robbery plan. our plan will be ruined smash the Stop Loss 🚫🚏. Don't Enter the market at the news update.
Loot and escape on the target 🎯 Swing Traders Plz Book the partial sum of money and wait for next breakout of dynamic level / Order block, Once it is cleared we can continue our heist plan to next new target.
💖Support, Like and follow our Robbery plan we can easily make money & take money 💰💵 Follow, Like & Share with your friends and Lovers. Make our Robbery Team Very Strong Join Ur hands with US. Loot Everything in this market everyday make money easily with Thief Trading Style.
Stay tuned with me and see you again with another Heist Plan..... 🫂

"NATURAL GAS" Commodities Market Bullish Heist PlanHola! Ola! My Dear Robbers / Money Makers & Losers, 🤑 💰
This is our master plan to Heist "NATURAL GAS" Commodities Market based on Thief Trading style Technical Analysis.. kindly please follow the plan I have mentioned in the chart focus on Long entry. Our target is Red Zone that is High risk Dangerous level, market is overbought / Consolidation / Trend Reversal / Trap at the level Bearish Robbers / Traders gain the strength. Be safe and be careful and Be rich.
Entry 📈 : Can be taken Anywhere, What I suggest you to Place Buy Limit Orders in 15mins Timeframe Recent / Nearest Low Point take entry should be in pullback.
Stop Loss 🛑 : Recent Swing Low using 2H timeframe
Target 🎯 : 3.500
Attention for Scalpers : Focus to scalp only on Long side, If you've got a lot of money you can get out right away otherwise you can join with a swing trade robbers and continue the heist plan, Use Trailing SL to protect our money 💰.
Warning : Fundamental Analysis news 📰 🗞️ comes against our robbery plan. our plan will be ruined smash the Stop Loss 🚫🚏. Don't Enter the market at the news update.
Loot and escape on the target 🎯 Swing Traders Plz Book the partial sum of money and wait for next breakout of dynamic level / Order block, Once it is cleared we can continue our heist plan to next new target.
💖Support our Robbery plan we can easily make money & take money 💰💵 Follow, Like & Share with your friends and Lovers. Make our Robbery Team Very Strong Join Ur hands with US. Loot Everything in this market everyday make money easily with Thief Trading Style.
Stay tuned with me and see you again with another Heist Plan..... 🫂

Turbulent Times Ahead for Natural Gas MarketNatural gas prices began the week with a gap-up, driven by forecasts of colder weather increasing demand, but have since faced strong selling pressure, making traders cautious.
◉ Technical Analysis
● A bullish turnaround seems imminent for Natural Gas prices, highlighted by the appearance of an Inverted Head & Shoulder pattern on the daily chart.
● After breaking out, the price momentarily reached the $3.290 resistance level before retreating and revisiting the breakout point.
● The price is now attempting to breach the resistance zone again, with expectations of exceeding the level soon.
● However, a drop below $2.800 could trigger a further correction.
◉ Overall Outlook
Natural gas prices are poised for a volatile week as traders weigh colder weather expectations against bearish technical signals. Thursday's inventory data will be crucial in determining the next price move.

N-gas / Natural Gas CFD Market Money Heist Plan on Bullish SideHaaiii!! My Dear Robbers / Money Makers & Losers, 🤑 💰
This is our master plan to Heist N-gas / Natural Gas CFD Market based on Thief Trading style Technical Analysis.. kindly please follow the plan I have mentioned in the chart focus on Long entry. Our target is Red Zone that is High risk Dangerous level, market is overbought / Consolidation / Trend Reversal / Trap at the level Bearish Robbers / Traders gain the strength. Be safe and be careful and Be rich.
Entry : Can be taken Anywhere, What I suggest you to Place Buy Limit Orders in 15mins Timeframe Recent / Nearest Low Point.
Stop Loss 🛑 : Recent Swing Low using 2h timeframe
Attention for Scalpers : If you've got a lot of money you can get out right away otherwise you can join with a swing trade robbers and continue the heist plan, Use Trailing SL to protect our money 💰.
Warning : Fundamental Analysis news 📰 🗞️ comes against our robbery plan. our plan will be ruined smash the Stop Loss. Don't Enter the market at the news update.
Loot and escape on the target 🎯 Swing Traders Plz Book the partial sum of money and wait for next breakout of dynamic level / Order block, Once it is cleared we can continue our heist plan to next new target.
Support our Robbery plan we can easily make money & take money 💰💵 Follow, Like & Share with your friends and Lovers. Make our Robbery Team Very Strong Join Ur hands with US. Loot Everything in this market everyday make money easily with Thief Trading Style.
Stay tuned with me and see you again with another Heist Plan..... 🫂

Natural Gas Trading: Strategies Around Key Levels 15-10-2024Navigating Natural Gas Trading: Strategies Around Key Levels
Natural gas trading can be both exciting and challenging, especially when you have clear reference points like your mid-point and upper/lower levels. In this blog, we'll explore strategies to navigate the current market with a mid-point of 208.50, an upper level of 209.90, and a lower level of 207.10.
Understanding the Key Levels
Mid-Point (208.50): This serves as the equilibrium level in the market. Prices often oscillate around this point, making it a significant area to watch for potential trades.
Upper Level (209.90): This is your resistance level. If prices approach this point, it may indicate an opportunity to go short, anticipating a reversal.
Lower Level (207.10): This serves as your support level. If prices test this area, consider going long, expecting a bounce back.
Trading Strategy
1. Price Action Analysis
Before making any trades, observe the price action around these levels. Watch for candlestick patterns, volume spikes, and other indicators that suggest market sentiment.
If Price Approaches 209.90: Look for signs of resistance. A reversal pattern (like a double top or shooting star) may suggest that the price is likely to drop. Consider placing a short trade with a stop-loss above this level.
If Price Approaches 207.10: Watch for bullish signals. A strong bullish candlestick or a reversal pattern could indicate that the price will bounce back. In this case, consider a long position with a stop-loss just below this level.
2. Risk Management
Always prioritize risk management. Set your stop-loss orders based on your risk tolerance. For example, if you're trading near the upper or lower levels, consider setting your stop-loss a few ticks outside these levels to avoid getting stopped out by minor fluctuations.
3. Monitoring Market Conditions
Natural gas prices can be highly influenced by external factors like weather, supply reports, and geopolitical events. Stay updated on relevant news and reports to make informed trading decisions.
Conclusion
Trading natural gas around key levels requires a solid understanding of price action and market sentiment. By using your mid-point, upper, and lower levels strategically, you can identify potential trade opportunities. Remember to incorporate risk management to protect your capital. Whether the price moves towards the upper level or the lower level, having a plan in place will help you navigate the market with confidence.
Dear Traders,
As you navigate the dynamic world of trading, it’s crucial to remain vigilant about the financial risks involved. Here are key considerations to keep in mind:
Market Volatility: Financial markets, including natural gas, can be highly volatile. Prices can change rapidly due to unexpected news or economic data. Always be prepared for sudden fluctuations.
Leverage Risks: Trading with leverage can amplify both gains and losses. While it allows for larger positions, it also increases the risk of significant financial loss. Use leverage cautiously and understand the implications.
Risk Management: Implementing a solid risk management strategy is essential. Set stop-loss orders to limit potential losses and only risk a small percentage of your capital on any single trade.
Emotional Discipline: Trading can evoke strong emotions, leading to impulsive decisions. Maintain discipline and adhere to your trading plan, even in challenging market conditions.
Market Research: Stay informed about market trends, economic indicators, and geopolitical events that may impact prices. Informed traders make better decisions.
Education and Experience: Continuous learning is vital. Consider practicing with a demo account to hone your skills before committing real capital.
Consult a Financial Advisor: If you're uncertain about your trading strategy or financial situation, seeking advice from a qualified financial advisor can provide valuable insights.
Trading can be rewarding, but it carries inherent risks. Stay informed, manage your risks carefully, and trade responsibly.
Wishing you successful trading!

NATURAL GAS: Peak reversal. Strong sell signal.Natural Gas is about to turned neutral on its 1D technical outlook (RSI = 58.678, MACD = 0.175, ADX = 30.811), previously from an overbough state, as it made a standard LH rejection at the top of a year long Triangle pattern. The 1D RSI peaked like all prior LH, the 1D MACD is forming a Bearish Cross (again like all prior LH), so we have a prime sell signal in our hands. Common target on all was the 1.786 Fibonacci extension (TP = 2.165).
## If you like our free content follow our profile to get more daily ideas. ##
## Comments and likes are greatly appreciated. ##

NATURAL GAS: Rejection on the 7 month Resistance.Natural Gas is only marginally bullish on its 1D technical outlook (RSI = 56.609, MACD = 0.187, ADX = 40.616) as it failed to cross over the LH trendline. At the same time, it is supported on the 1D MA200 having broken out for the first time since January 3rd. Long-term we remain slightly bullish on NG but on the short-term, we will wait for LH validation. If the price crosses above it, we will take a short term buy and aim for the R1 level (TP = 3.350). If instead the price crosses under the 1D MA200, we will take a short term sell aiming at the 1D MA50 (TP = 2.200).
See how our prior idea has worked out:
## If you like our free content follow our profile to get more daily ideas. ##
## Comments and likes are greatly appreciated. ##

Downtrend Breakout, So Uptrend Confirmation. Long Term AnalysisThis is Long -Term Analysis to understand the "Upcoming" Market Direction. Now Confirmed the Downtrend has Breakout. So market definitely move into Uptrend. It might temporarily move downside as a Retest of the Trendline. Must follow Trend continuation technic.
I marked 0.5 Fibonacci Retracement. It is Next Target for Short Term Traders.
I want to help people Make Profit all over the World throughout my entire life. Additionally, I am eager to Receive Money form Worldwide because of my Potential.

NATURAL GAS: Ahead of a 12 month Bull Market at least.Natural Gas is on a very sharp four month decline after failing to cross over the 1M MA50, the second most aggressive four month drop so far in the past 19 years. Since the July 2008 High, the market is trading inside a Channel Down and this sharp decline is technically the final phase of the Bearish Wave to a LL at the bottom of the Channel Down. That means that a long term buy opportunity is gradually approaching and we are estimating a fair target level to be 1.400 unless the 1M RSI touches the 15 year Buy Zone earlier. Every bottom rebound extended initially to at least +134% and that is our target (TP = 3.100) for the next 12 months. It will also be a potential test of the 1M MA200.
See how our prior idea has worked out:
## If you like our free content follow our profile to get more daily ideas. ##
## Comments and likes are greatly appreciated. ##

NATURAL GAS: Buy opportunity near oversold levels.Natural Gas is almost oversold on its 1D technical outlook (RSI = 33.738, MACD = -0.139, ADX = 32.983) right at the bottom of the three month Channel Down. Last time the 1D RSI dipped under 30.000 (oversold level), the LL was formed, the Channel Down bottomed and posted a strong December-January rally. Due to the long term bearish trend on NG, we don't expect such a rally this time but the price is low enough to justify a short term buy to test the 1D MA50 (TP = 2.500).
## If you like our free content follow our profile to get more daily ideas. ##
## Comments and likes are greatly appreciated. ##

NATURAL GAS: Long term Cycles target 1.400.Natural Gas is very consistent with its long term patterns and in particular Cycles that have been in effect since the 2008 crisis. The dominant pattern since then has been a Channel Down and with the application of the Fibonacci levels we get a good understanding of the Cyclical phases. We need to look at the 1W timeframe for that, where the technical is already bearish (RSI = 40.467, MACD = 0.009, ADX = 38.451), recently rejected near the 1W MA200 and now under the 1W MA50.
We can see another three patterns with declines under the 1W MA50 after a 1W Death Cross formation. All pushed near the bottom of the Channel Down, with only the 2009-2012 taking longer. Every monthly rally is a sell entry for us from now on (TP = 1.400).
## If you like our free content follow our profile to get more daily ideas. ##
## Comments and likes are greatly appreciated. ##

NATURAL GAS: Rebound expected near the 1D MA50.Natural Gas is on a six day bearish streak, turning neutral on the 1D technical outlook (RSI = 47.415, MACD = 0.105, ADX = 27.914). The pattern since April is a Bullish Megaphone and every pullback like this, has been a buy opportunity. The last one reversed just before it hit the 1D MA50, and as the 1D RSI is also near the S1 level, we turn bullish, targeting the R1 level (TP = 3.645).
## If you like our free content follow our profile to get more daily ideas. ##
## Comments and likes are greatly appreciated. ##

NATGAS Analysis 30July2023This analysis is still with the old analysis. Still in a positive condition bullish. After the price forms a choch structure and corrected, the price is stuck in the Fibo Retracement area 0.382 and is likely to continue bullish up to the right level of Fibo 1,618 in contact with the highest price in March.

NatGas: Come on! 👏NatGas needs to show a bit more motivation to complete wave 3 in green, as we expect the corresponding top near the upper end of the white zone between $1.88 and $3.43. After the price has also dealt with the short counter movement of wave 4 in green, it should finish the green five part upwards movement, rising from the white zone toward the top of wave iv in pink. As soon as this is placed, we reckon with a significant downwards movement, which should lead to the low of wave 2 in green before the ascent can start anew. However, there is a 40% chance that NatGas could leave the white zone on the lower side prematurely, thus developing wave alt.2 in green earlier already.
