InfoEdge / Naukri BreakdownThe stock has broken down and retested, therefore may undergo a mild correction in the short term. Trade is supported by Resitances Nearby.
Risk Reward Ratio - 1.5:1
SL is placed above the resistance zone & the upper trendline. The target is placed near support.
NAUKRI

INFO EDGE (NAUKRI) Trend AnalysisOne of the high risk stocks to go for a positional trade as per its fundamentals.
A clear Head & Shoulder pattern formed and recent price action shows strong bearish divergence with RSI for a bearish continuation.
Price has retested the neckline and is heading towards a downside target of around 2350.
It lies in confluence with golden FIB and long term trendline support.
Good to accumulate around 2200-2500 level for a possible upside of around 4300-4500 level (83% ROI)
Stop Loss around 2000 (Mandatory)
Few fundamental aspects:
Earnings include other income of 13,810 crores, whereas operating profit is just 439 crores for FY 2021-22.
This other income has made the PE look cheaper around 18, keeping aside the other income can make PE above 100.
Intangible assets valuation increased to 902 crores from 75 crores (whopping 12 times in a year) sounds exorbitant.
Being a market leader, there is no doubt on its business aspects but I am not going to invest in this until the fundamentals look attractive, its highly overvalued as per the facts I have mentioned.
Other income is income derived from activities unrelated to the main focus of a business.
Examples are:
Income on bank deposits,
Interest on loan to customer or 3rd party,
Rental income from investment property,
Dividend on equity investments,
Profit on disposal of property, plant & equipment and
Scrap sales
Kindly do your own due diligence before taking any action.
Do follow me to get notified whenever I will be posting updates on some of my TAs in near future if I observe any changes to my current ideas.
Peace!!


NAUKRI Short term target 55501. Its forming HNS pattern , Fundamentally strong financials better placed than competitors


Price not holding support? what to do? hindi last ek month se kisi bhi indices ne good perform nhi kiya hai. kaafi saare shares apne support ko bhi hold nhi kr paa rhe hai. for more info watch the video.

Naukri/Info edge at support Everything mentioned clearly in chart.
also before investing/trading consult with your financial advisor. I'm not responsible for your loss\gain.

Support Zone of Nifty IT: Good time to Accumulate Tech StocksNifty IT heading towards Support Zone. Time for Bottom Fishing of Tech Stocks.
Go through heavy weight counters of IT Sectors
Infy
NSE:INFY
TCS
NSE:TCS
Tech M
NSE:TECHM
Naukri
NSE:NAUKRI

Info Edge Available at weekly + daily support, also candle shunting till ATH
can be a good low rist entry...

INFOEDGE/NAUKRI AT IMPORTANT LEVELHello Traders,
The last stock given here on tradingview did not close above the buying levels so here I am with a stock that is not a breakout trade but a support/resistance trade. The stock I am speaking about is Infoedge.
Now Infoedge gave a breakout of old resistance and went on a bull run for a 2 weeks or so but then failed to made a higher high and came down, now the point where Naukri is right now is the old broken resistance turned into support and it is supporting and resisting the fall for downward levels.
There is also a long-term trendline providing support at the same place making it a confluence circle so we can have a upmove from the same point again.
RSI has room for bulls
MACD crossing to green levels
Last breakout zone turned support
Trendline support present
Buy Above - 5760
Targets mentioned in the chart above

Nauri Short PositionWe have a short position coming up on Naukri. Please visit tradesignals.io for more info.


ZOMATO 15MINZOMATO 15MIN is travelling is a zone with a triangle a pattern breakout that can give targets.

NAUKRI - Formation of Bullish H&S pattern - Medium/Long TermThe above analysis is done purely on basis of Price Action & Chart Patterns.
The analysis is done on daily TF hence price may take few days to few weeks in order to reach the targets.
Entry can be done on pullbacks or on CMP as well. It should be accumulated for longer term as well.
For understanding how to trade a Bullish Head & Shoulder Structure, refer to the ideas linked below.
The above analysis is purely for educational purpose. Traders must do their own study before entering into any trade. Traders must trade as per their own risk taking capacity and money management.
Feel Free to comment or message me for any query or suggestion regarding this stock or Price Action Analysis.
Checkout my other ideas to understand how one can earn from stock markets with simple trade setups.


NAUKRI (INFO EDGE) - POSITIONAL TRADEBUY ZONE : 4800 to 4900
Can look for : 5600+, 6400+
View not valid if DAY CLOSE below 4220


Naukri...... Strugling..............naukri struggling to breakout above trendline........
Once breakouts the levels are given,,,,,,,
happy trading..
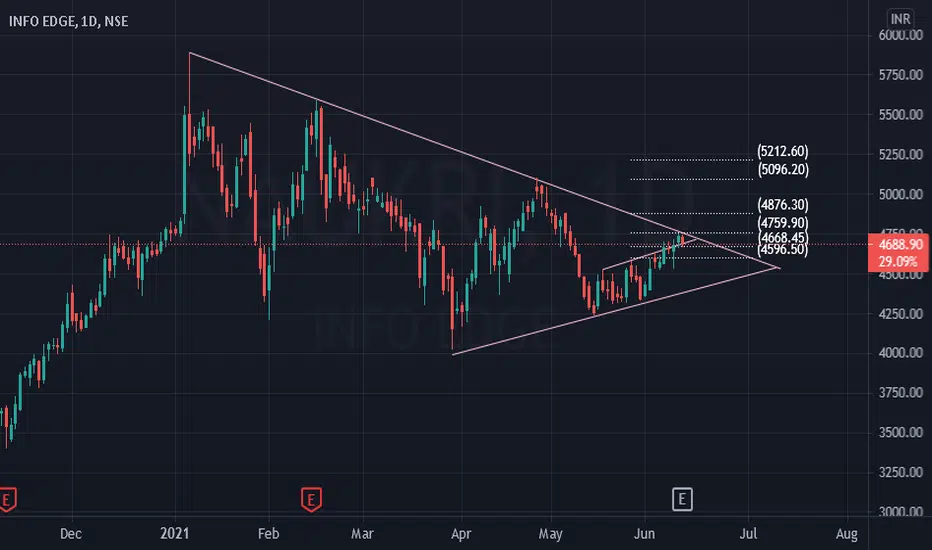
INFO EDGE (NAUKRI)One can think of purchasing Naukri at current levels and has to accumulate it till 4200 levels. As it price action is in triangle formation seen in the attachment image. Once breakout is confirm it can go back to previous highs in next 3 months time. So, one can initiate a buy with sl of 4050.


Info Edge (Naukri)Info edge changed its trend and has a beautiful swing trade oppurtunity. Broke 4370 level like a hero and am excited to see its next few days moves. Levels are marked in the chart where i ll take partial profits.

Naukri/Info edgeTaking trendline support as wel l as 200EMA support
Adding at CMP 4400-4450
Strict SL 4200
tgt as per your greed
